Long
Long
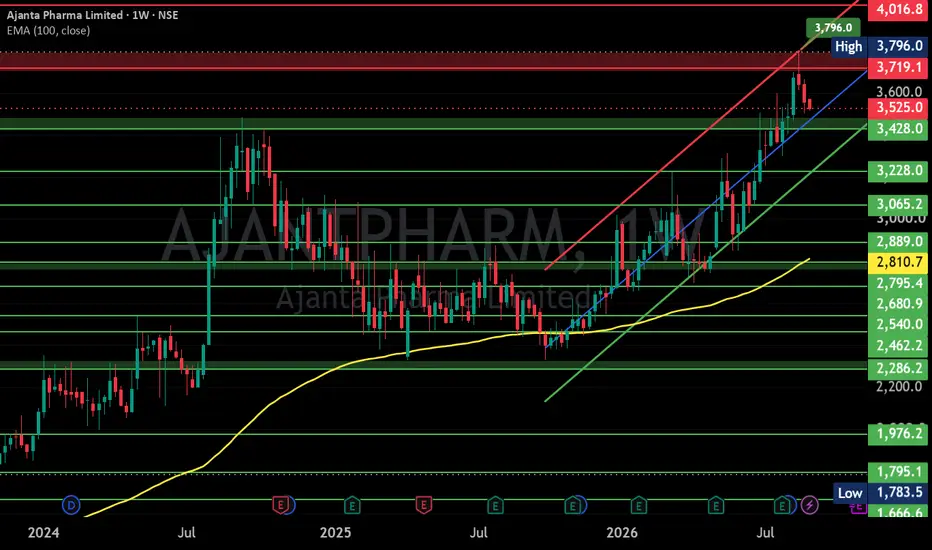
AJANTA PHARMA S/R
Support and Resistance Levels:
Support Levels: These are price points (green line/shade) where a downward trend may be halted due to a concentration of buying interest. Imagine them as a safety net where buyers step in, preventing further decline.
Resistance Levels: Conversely, resistance levels (red line/shade) are where upward trends might stall due to increased selling interest. They act like a ceiling where sellers come in to push prices down.
Breakouts:
Bullish Breakout: When the price moves above resistance, it often indicates strong buying interest and the potential for a continued uptrend. Traders may view this as a signal to buy or hold.
Bearish Breakout: When the price falls below support, it can signal strong selling interest and the potential for a continued downtrend. Traders might see this as a cue to sell or avoid buying.
MA Ribbon (EMA 20, EMA 50, EMA 100, EMA 200) :
Above EMA: If the stock price is above the EMA, it suggests a potential uptrend or bullish momentum.
Below EMA: If the stock price is below the EMA, it indicates a potential downtrend or bearish momentum.
Trendline: A trendline is a straight line drawn on a chart to represent the general direction of a data point set.
Uptrend Line: Drawn by connecting the lows in an upward trend. Indicates that the price is moving higher over time. Acts as a support level, where prices tend to bounce upward.
Downtrend Line: Drawn by connecting the highs in a downward trend. Indicates that the price is moving lower over time. It acts as a resistance level, where prices tend to drop.
Disclaimer:
I am not SEBI registered. The information provided here is for learning purposes only and should not be interpreted as financial advice. Consider the broader market context and consult with a qualified financial advisor before making investment decisions.  Long
Long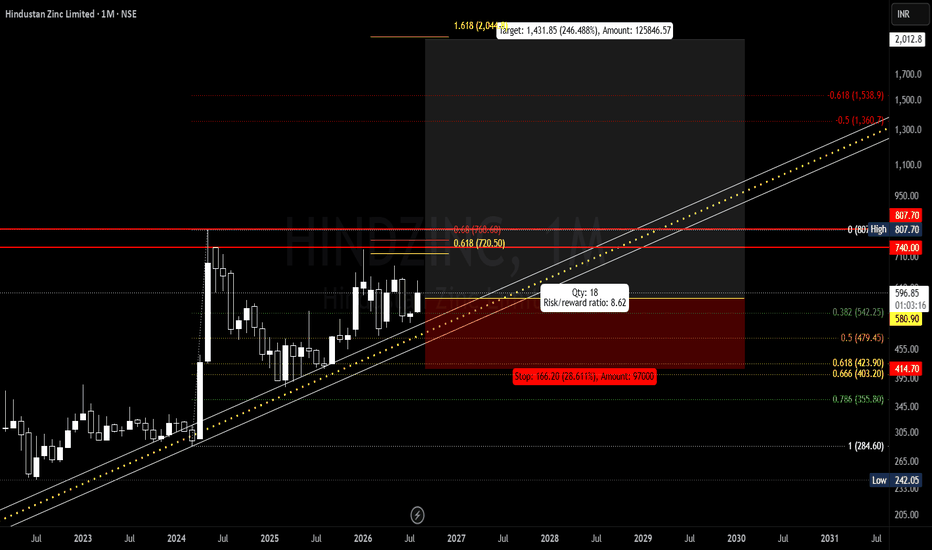
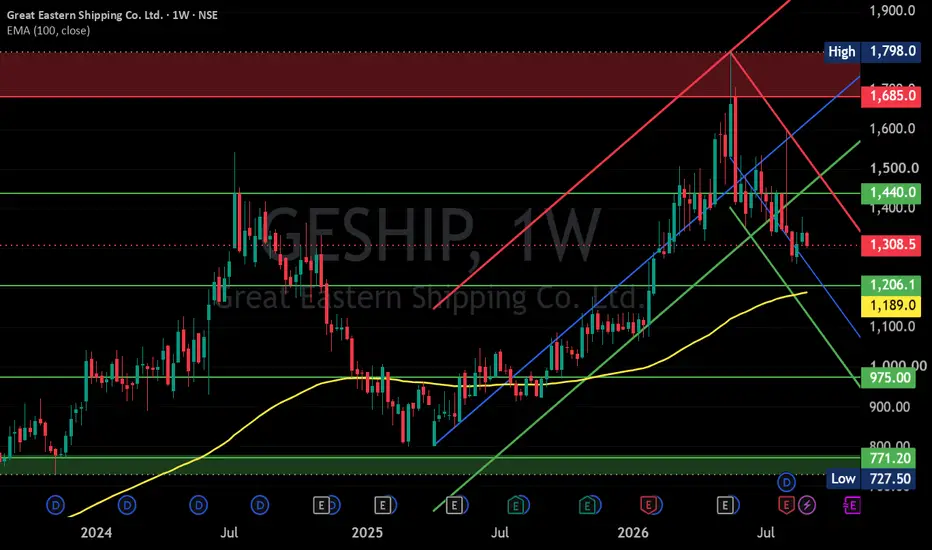
GESHIP
Support and Resistance Levels:
Support Levels: These are price points (green line/shade) where a downward trend may be halted due to a concentration of buying interest. Imagine them as a safety net where buyers step in, preventing further decline.
Resistance Levels: Conversely, resistance levels (red line/shade) are where upward trends might stall due to increased selling interest. They act like a ceiling where sellers come in to push prices down.
Breakouts:
Bullish Breakout: When the price moves above resistance, it often indicates strong buying interest and the potential for a continued uptrend. Traders may view this as a signal to buy or hold.
Bearish Breakout: When the price falls below support, it can signal strong selling interest and the potential for a continued downtrend. Traders might see this as a cue to sell or avoid buying.
MA Ribbon (EMA 20, EMA 50, EMA 100, EMA 200) :
Above EMA: If the stock price is above the EMA, it suggests a potential uptrend or bullish momentum.
Below EMA: If the stock price is below the EMA, it indicates a potential downtrend or bearish momentum.
Trendline: A trendline is a straight line drawn on a chart to represent the general direction of a data point set.
Uptrend Line: Drawn by connecting the lows in an upward trend. Indicates that the price is moving higher over time. Acts as a support level, where prices tend to bounce upward.
Downtrend Line: Drawn by connecting the highs in a downward trend. Indicates that the price is moving lower over time. It acts as a resistance level, where prices tend to drop.
Disclaimer:
I am not SEBI registered. The information provided here is for learning purposes only and should not be interpreted as financial advice. Consider the broader market context and consult with a qualified financial advisor before making investment decisions.  Long
Long
 Long
Long
BTR Intraday Short Setup I BSE Ltd I 31 Aug 2026Today’s chart is a good example of why intraday trading is not about predicting every candle — it is about waiting for a structured setup.
On the 15-minute BSE Ltd. chart, price spent the earlier session building upward momentum and eventually reached the 3,400–3,410 area. Around this zone, the BTR Sell Signal appeared.
From there, price showed a sharp bearish move and continued lower.
📌 Setup Structure
🔴 BTR Sell Signal: around 3,410
🛑 SL / Invalidation Reference: 3,410
🎯 T1: 3,345.8
🎯 T2: 3,313.6
🎯 T3: 3,281.5
At the time of the chart, price was around 3,316, meaning the move had already travelled significantly from the signal area and was approaching the lower target zones.
🧠 The real lesson
The important part isn't simply that the market moved down after the signal.
The important part is the process:
Wait → Identify the setup → Define invalidation → Observe price → Manage risk
A trader doesn't need to participate in every candle.
Sometimes the best trade is simply waiting for the market to come to your setup.
And once the move has already travelled a substantial distance, chasing the price can create a completely different risk profile than the original setup.
That is where patience + discipline + predefined risk become more important than excitement.
BTR is a tool — not a decision maker.
An indicator can help structure the chart and provide reference points. It cannot remove market uncertainty, guarantee an outcome, or replace risk management.
No prediction.
No chasing.
No emotional entry.
Just a defined setup and disciplined observation.
📊 Chart shared for educational and technical-study purposes only. This is not a recommendation or solicitation to buy or sell any security. Traders should independently evaluate risk, suitability and market conditions before taking any position.  Short
Short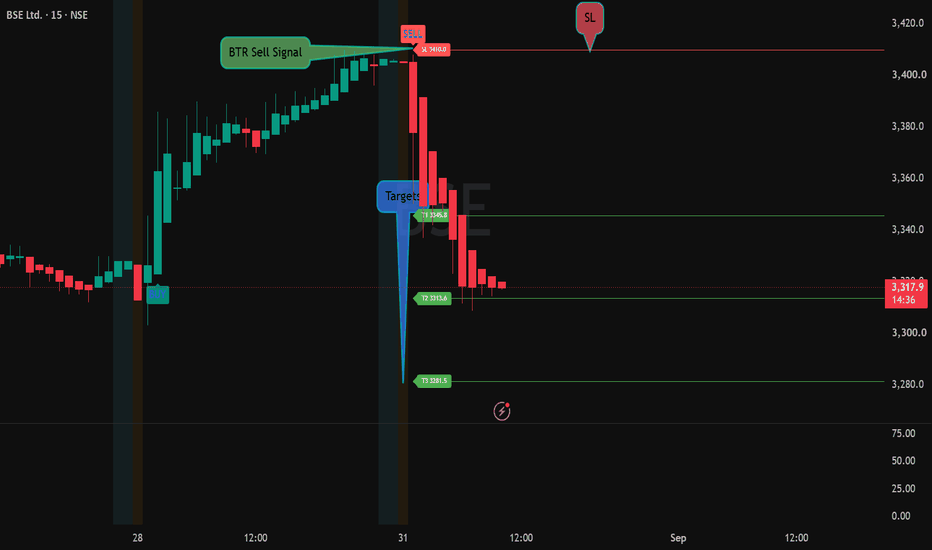
MCX 15-Minute Technical Study | BTR Setup | 27 Aug 26Today’s chart shows an interesting example of how a structured setup can develop after a strong price move.
On the MCX 15-minute chart, price first moved higher and then formed a BTR Sell Signal near the 3,340–3,350 zone. From there, price started moving lower with a sequence of bearish candles.
The chart shows the following reference levels:
🔴 BTR Sell Signal: ~3,340
🛑 SL / Invalidation Level: 3,362.0
🎯 T1: 3,265.8
🎯 T2: 3,217.6
🎯 T3: 3,169.5
At the time of the chart, MCX was around 3,287.5, so the first potential target at 3,265.8 was getting closer.
What this chart demonstrates
The key observation isn't simply “price went down after the signal.”
It is the importance of having a pre-defined structure:
Setup → Invalidation → Potential Targets → Price Observation
Once a setup appears, patience becomes important. Price doesn't have to immediately reach a target. It can consolidate, reverse, or invalidate the setup.
A technical indicator can help organize these reference points, but the decision, risk, position size and execution remain with the trader.
For me, the bigger lesson from charts like this is:
Don't chase the move. Define the setup, define the invalidation, and let price decide what happens next.
This is a technical chart study for educational purposes, not a recommendation to buy, sell, or trade MCX. Market conditions can change quickly, and historical/chart observations do not guarantee future results. TARIL S/R
Support and Resistance Levels:
Support Levels: These are price points (green line/shade) where a downward trend may be halted due to a concentration of buying interest. Imagine them as a safety net where buyers step in, preventing further decline.
Resistance Levels: Conversely, resistance levels (red line/shade) are where upward trends might stall due to increased selling interest. They act like a ceiling where sellers come in to push prices down.
Breakouts:
Bullish Breakout: When the price moves above resistance, it often indicates strong buying interest and the potential for a continued uptrend. Traders may view this as a signal to buy or hold.
Bearish Breakout: When the price falls below support, it can signal strong selling interest and the potential for a continued downtrend. Traders might see this as a cue to sell or avoid buying.
MA Ribbon (EMA 20, EMA 50, EMA 100, EMA 200) :
Above EMA: If the stock price is above the EMA, it suggests a potential uptrend or bullish momentum.
Below EMA: If the stock price is below the EMA, it indicates a potential downtrend or bearish momentum.
Trendline: A trendline is a straight line drawn on a chart to represent the general direction of a data point set.
Uptrend Line: Drawn by connecting the lows in an upward trend. Indicates that the price is moving higher over time. Acts as a support level, where prices tend to bounce upward.
Downtrend Line: Drawn by connecting the highs in a downward trend. Indicates that the price is moving lower over time. It acts as a resistance level, where prices tend to drop.
Disclaimer:
I am not SEBI registered. The information provided here is for learning purposes only and should not be interpreted as financial advice. Consider the broader market context and consult with a qualified financial advisor before making investment decisions.  Long
Long
 Long
Long
 Long
Long
 Long
Long
 Long
Long
Hatsun Agro🥛 STOCK TO WATCH 🥛
₹1,155–1,170 → ₹2,760 👀
A quality dairy-consumption name appearing on my Weekly R4 Momentum Breakout Scanner.
Hatsun Agro Product Ltd.
📌 Buy Zone: ₹1,155–1,170
📌 Breakout Zone: ₹1,152
🛑 Stop Loss: ₹889
🎯 Target: ₹2,760
Why Hatsun Agro?
🥛 Strong private-sector dairy franchise: Hatsun's portfolio includes Arun Icecreams, Arokya, Hatsun, HAP Daily and Ibaco, with products spanning milk, curd, paneer, ghee, ice creams and other dairy categories.
📈 Q1 FY27 revenue milestone: Revenue from operations reached ₹3,090.49 Cr, up 19.31% YoY — crossing ₹3,000 Cr quarterly revenue for the first time.
🏭 Large manufacturing footprint: Hatsun currently operates 22 processing plants, with a large procurement and distribution network.
🌾 Deep milk-procurement network: The company procures milk directly from 5 lakh+ farmers, providing scale and supply-chain integration.
🚀 FY26 growth remained strong: FY26 revenue rose 14.48%, EBITDA increased 15.60%, while PAT jumped 27.76% to ₹356.20 Cr.
💰 Expansion ahead: Hatsun has announced plans for around ₹1,000 Cr FY27 capex, including procurement, production, outlet expansion and new product initiatives.
Why It Caught My Attention
✅ 19%+ Q1 revenue growth
✅ ₹3,000 Cr+ quarterly revenue milestone
✅ Strong dairy brand portfolio
✅ 22 processing plants
✅ 5 lakh+ farmer procurement network
✅ ₹1,000 Cr FY27 capex plan
✅ Strong FY26 profitability growth
✅ Weekly R4 Momentum Breakout
⚠️ One Point to Watch
Q1 FY27 revenue growth was excellent, but operating profit declined 10.85% YoY and PAT was down 1.11% YoY according to reported quarterly data. Margin recovery therefore remains an important trigger to monitor.
⚠️ HIGH RISK – HIGH REWARD SETUP. Follow the defined stop-loss and disciplined position sizing. Do not chase an extended move.
Risk Defined. Reward Visible.
📢 Disclaimer: This content is for educational purposes only and not investment advice. Please do your own due diligence before making any investment decisions.
© 20K Microcap Investing | R4 Momentum Desk
#Hatsun #HatsunAgro #HATSUN #DairyStocks #FMCGStocks #ConsumerStocks #DairyIndia #FoodStocks #StockMarketIndia #IndianStocks #StocksToWatch #R4Breakout #MomentumInvesting #20KMicrocap  Long
Long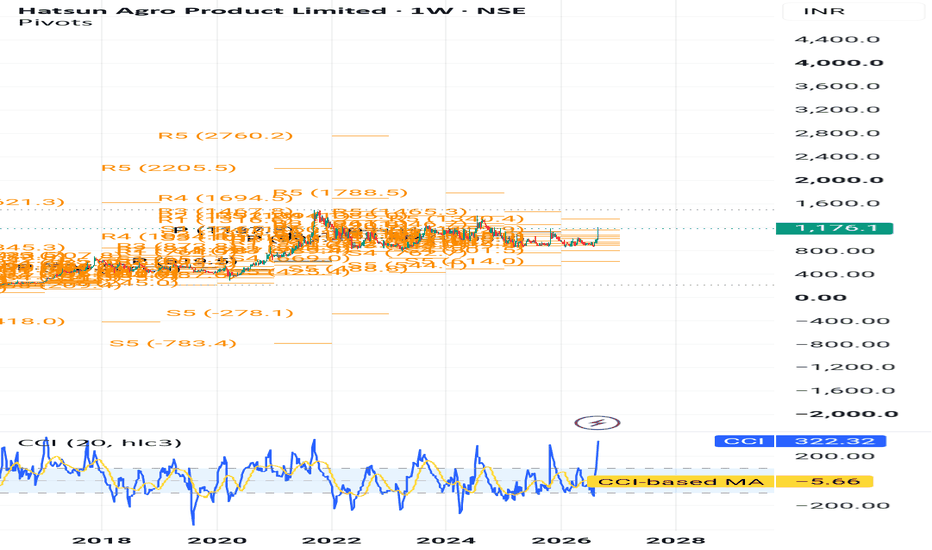
 Long
Long
VadilalVadilal — Trade Setup
Setup: Bullish MTF Demand Continuation
Trend: UP across HTF + MTF + ITF
Buy Zone: ₹7,072–7,478
Preferred Entry: ₹7,478
Confirmation: Sustained hold above ₹7,478
Stop Loss: ₹7,072
Risk: ₹406/share
Target 1: ₹8,500–9,000
Target 2: ₹10,796
Position Target: ₹10,796
Gross RR: 8.2 : 1
Net RR: 7.01 : 1
Key Demand: ₹7,072–7,478
Quality Points
Excellent multi-timeframe alignment — every HTF, MTF and ITF trend is UP.
Strong demand confluence: Weekly, Daily and all ITF zones cluster around ₹7,072–7,478.
Entry at ₹7,478 is at the proximal edge of the strongest immediate demand zone.
₹7,072 is the key structural invalidation level; holding above it keeps the setup bullish.
Upside structure is attractive, with ₹10,796 offering substantial positional potential.
Risk is ₹406, which is materially wider than ASK Automotive, so position sizing should reflect the larger per-share risk.
The supplied 8.2x gross RR / 7.01x net RR makes the setup particularly attractive if the demand zone holds.
Setup conclusion: Strong bullish positional setup — excellent HTF/MTF/ITF confluence, clear demand support and high upside potential. Preferred approach is to accumulate around ₹7,072–7,478 rather than chase an extended move.  Long
Long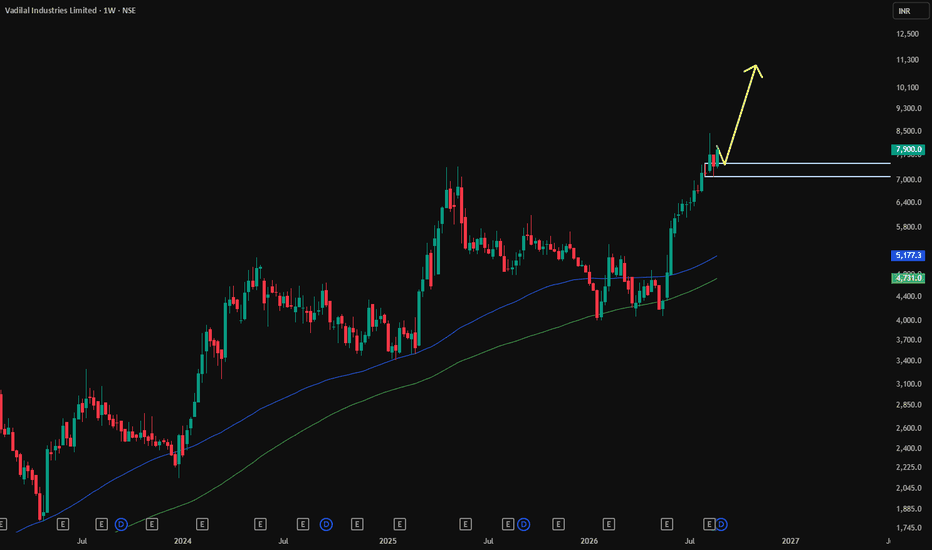
 Long
Long
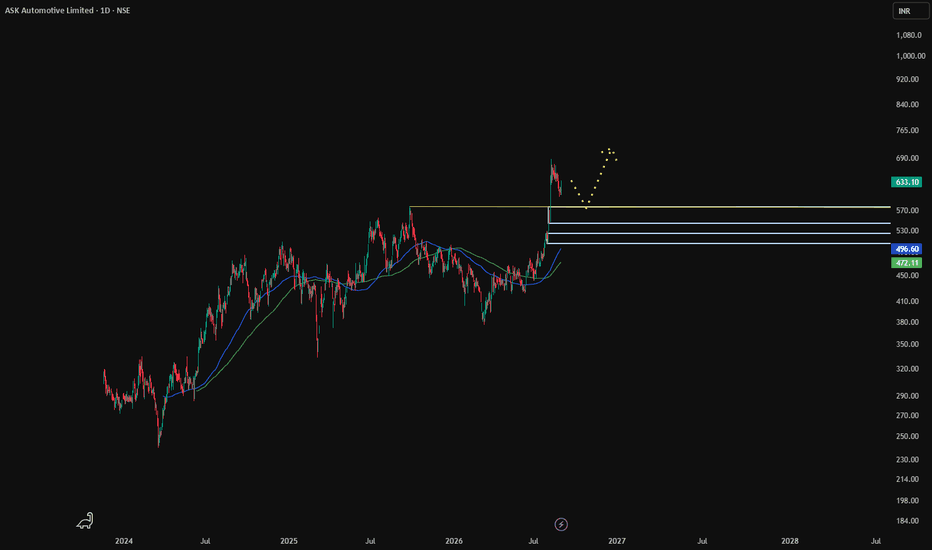
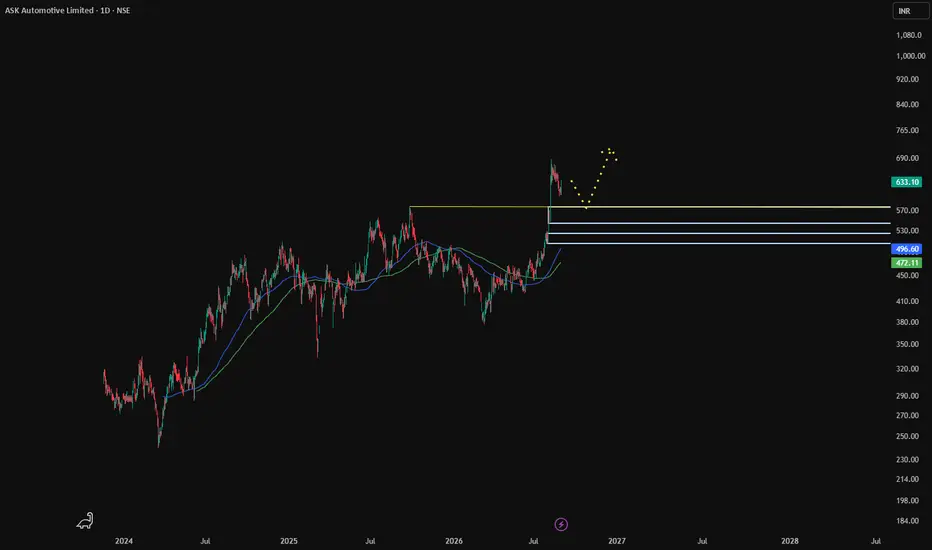
ASK AutomotiveASK Automotive — Consolidated Quality Points
Trend: Strong UP trend across HTF, MTF and ITF — clear multi-timeframe alignment.
Demand Structure: Strong demand cluster around 529–576, with ITF support concentrated at 544–576.
Entry: 554, positioned within the MTF demand zone.
Risk: 10 points to SL at 544 — very tightly controlled downside.
Reward: 203 points to target 757, giving 21.4x gross RR and 15.32x net RR based on the supplied calculations.
Structure Quality: Monthly, Weekly, Daily and ITF all support the bullish setup, creating strong demand confluence.
Momentum Trigger: Sustained movement above 576 would strengthen the continuation setup.
Key Risk: The 544 SL is very tight relative to normal price fluctuations; a temporary dip can trigger SL even if the broader trend remains UP.
Positional Potential: Target 757 is aligned with the projected MTF/position target, offering substantial upside if the demand structure holds.
Trade View: Bullish setup with excellent risk efficiency, but execution around the tight SL is critical.
ASK Automotive — Trade Setup
Setup: Bullish MTF Demand Continuation
Trend: UP — HTF + MTF + ITF aligned
Buy Zone: ₹530–554
Preferred Entry: ₹554
Confirmation: Sustained move above ₹576
Stop Loss: ₹544
Risk: ₹10/share
Target 1: ₹603
Target 2: ₹652
Target 3: ₹757
Gross RR: 21.4 : 1 to ₹757
Net RR: 15.32 : 1
Key Demand: ₹529–576
Critical Level: ₹544 — below this, the immediate setup weakens.
Execution: Prefer entry on hold/retest of ₹544–554 rather than chasing a sharp move. A sustained breakout above ₹576 provides additional confirmation.
Setup conclusion: UPTREND + DEMAND CONFLUENCE + VERY LOW RISK + HIGH UPSIDE POTENTIAL.  Long
Long