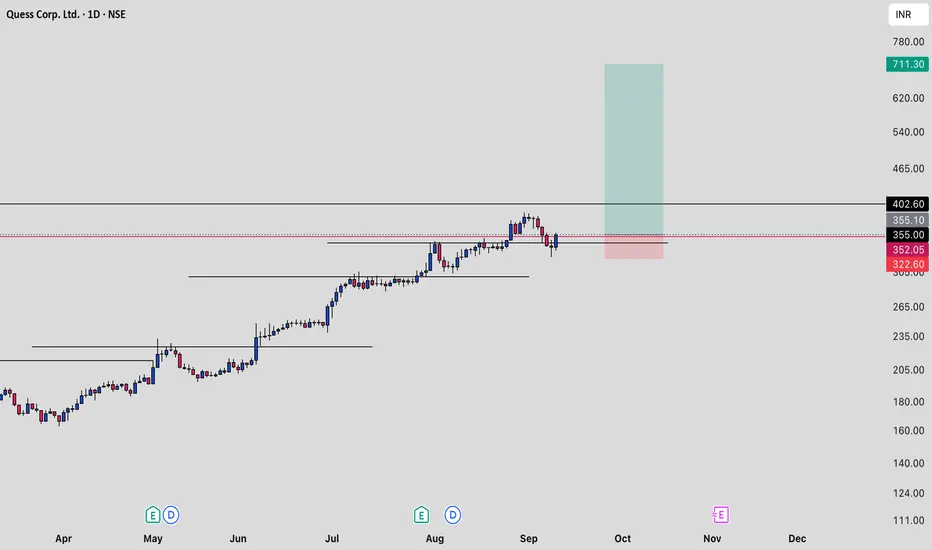
Long
Long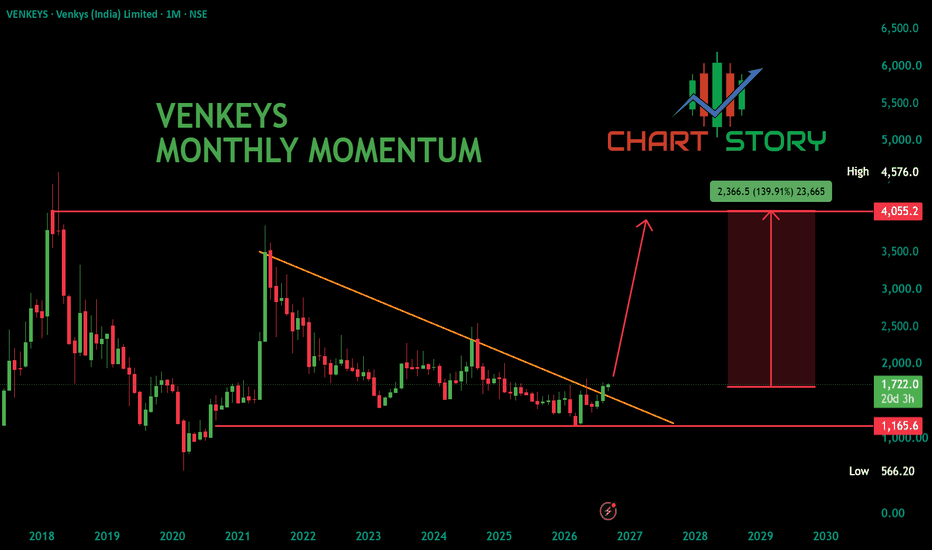
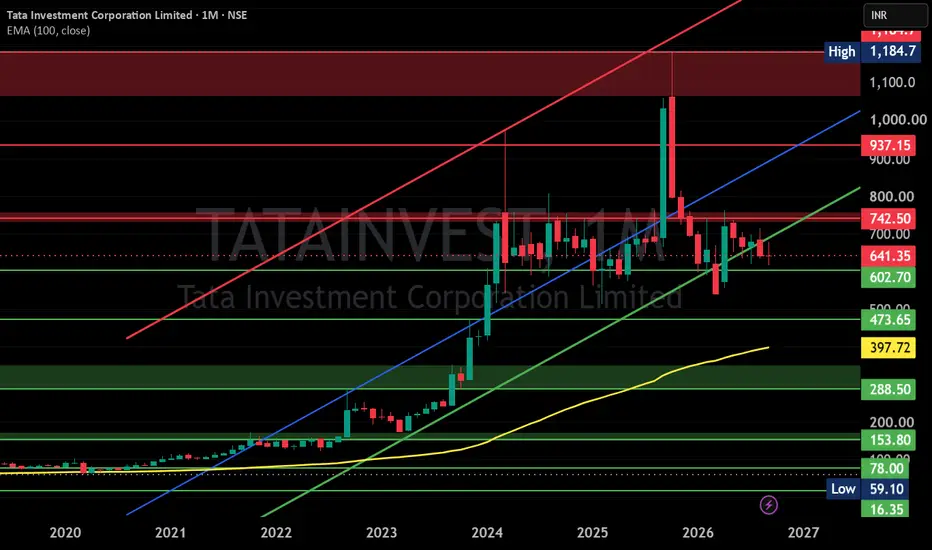
TATA INVEST COP LTD S/R
Support and Resistance Levels:
Support Levels: These are price points (green line/shade) where a downward trend may be halted due to a concentration of buying interest. Imagine them as a safety net where buyers step in, preventing further decline.
Resistance Levels: Conversely, resistance levels (red line/shade) are where upward trends might stall due to increased selling interest. They act like a ceiling where sellers come in to push prices down.
Breakouts:
Bullish Breakout: When the price moves above resistance, it often indicates strong buying interest and the potential for a continued uptrend. Traders may view this as a signal to buy or hold.
Bearish Breakout: When the price falls below support, it can signal strong selling interest and the potential for a continued downtrend. Traders might see this as a cue to sell or avoid buying.
MA Ribbon (EMA 20, EMA 50, EMA 100, EMA 200) :
Above EMA: If the stock price is above the EMA, it suggests a potential uptrend or bullish momentum.
Below EMA: If the stock price is below the EMA, it indicates a potential downtrend or bearish momentum.
Trendline: A trendline is a straight line drawn on a chart to represent the general direction of a data point set.
Uptrend Line: Drawn by connecting the lows in an upward trend. Indicates that the price is moving higher over time. Acts as a support level, where prices tend to bounce upward.
Downtrend Line: Drawn by connecting the highs in a downward trend. Indicates that the price is moving lower over time. It acts as a resistance level, where prices tend to drop.
Disclaimer:
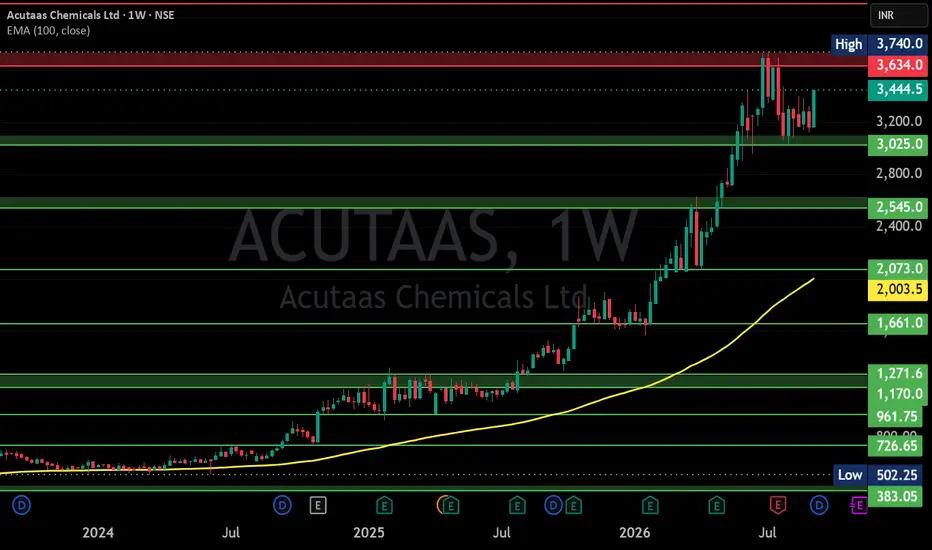
I am not SEBI registered. The information provided here is for learning purposes only and should not be interpreted as financial advice. Consider the broader market context and consult with a qualified financial advisor before making investment decisions. ACUTAAS CHEM LTD S/R
Support and Resistance Levels:
Support Levels: These are price points (green line/shade) where a downward trend may be halted due to a concentration of buying interest. Imagine them as a safety net where buyers step in, preventing further decline.
Resistance Levels: Conversely, resistance levels (red line/shade) are where upward trends might stall due to increased selling interest. They act like a ceiling where sellers come in to push prices down.
Breakouts:
Bullish Breakout: When the price moves above resistance, it often indicates strong buying interest and the potential for a continued uptrend. Traders may view this as a signal to buy or hold.
Bearish Breakout: When the price falls below support, it can signal strong selling interest and the potential for a continued downtrend. Traders might see this as a cue to sell or avoid buying.
MA Ribbon (EMA 20, EMA 50, EMA 100, EMA 200) :
Above EMA: If the stock price is above the EMA, it suggests a potential uptrend or bullish momentum.
Below EMA: If the stock price is below the EMA, it indicates a potential downtrend or bearish momentum.
Trendline: A trendline is a straight line drawn on a chart to represent the general direction of a data point set.
Uptrend Line: Drawn by connecting the lows in an upward trend. Indicates that the price is moving higher over time. Acts as a support level, where prices tend to bounce upward.
Downtrend Line: Drawn by connecting the highs in a downward trend. Indicates that the price is moving lower over time. It acts as a resistance level, where prices tend to drop.
Disclaimer:
I am not SEBI registered. The information provided here is for learning purposes only and should not be interpreted as financial advice. Consider the broader market context and consult with a qualified financial advisor before making investment decisions. SONACOMS building its third base after a strong runLong setup, worth walking through.
Stock topped in September 2024 and then went into a proper Stage 4 decline that ran all the way to October 2025. Thirteen months of lower highs under a falling trendline, price under both averages, several sharp flushes along the way. Nothing to do through any of it.
The low came in October 2025. Price stopped making new lows and then spent the next six months building the first base, roughly November through April. Wide, choppy, a big shakeout in February that took it back to the base low before it recovered. That base sat right on the long term average while it flattened out underneath.
Base 1 broke in late April. Price cleared the range and the trendline in the same move and Stage 2 was confirmed.
Base 2 came in May and June, tight and short, holding the rising short term average. Broke out in early July and the stock ran from around 620 to 830.
Since mid August it has been building the third base at the highs. About four weeks sideways, range tightening, average rising into it from below. Today up 0.93%, closed at 806.90.
Thirteen months of decline, six months of base building, then the move. Most of the work in this chart happened while nothing appeared to be happening.
Watching the third base now. Valid while the base low holds. Close back below it and I stand aside.
Not a recommendation, just sharing what I am watching.  Long
Long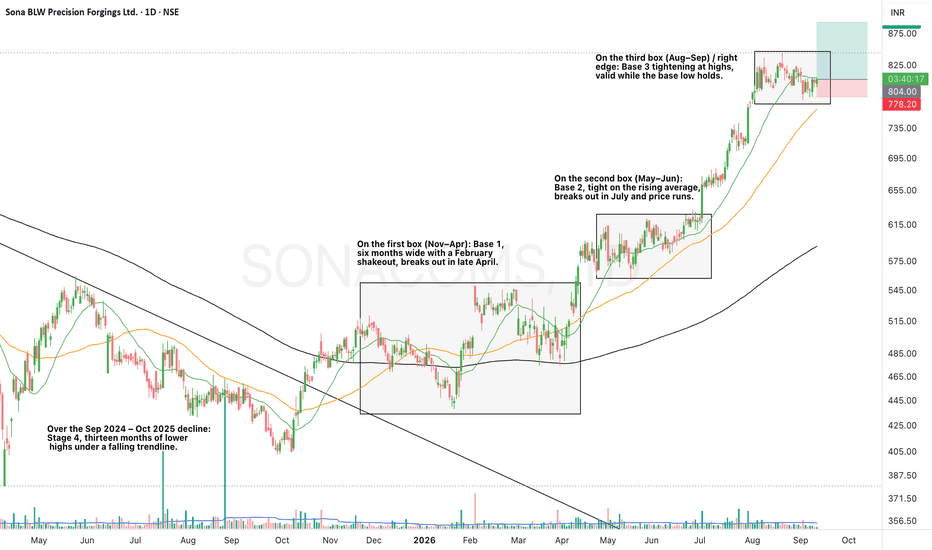
 Long
Long
Ather Energy (ATHERENERG) — Positional SetupBased on your 6-month chart, Ather Energy is showing a strong recovery after a sharp breakout and is now consolidating below the recent high near ₹1,722.
🔥 Technical Setup
Level Zone
Current price ₹1,632.5
Immediate resistance ₹1,680–₹1,722
Major breakout ₹1,722
Target 1 ₹1,800
Target 2 ₹1,900
Target 3 ₹2,000+
Immediate support ₹1,580–₹1,600
Strong support ₹1,430–₹1,450
🎯 Positional Strategy
Aggressive entry:
₹1,600–₹1,630 zone if the stock continues to hold the rising moving-average support.
Breakout entry:
Above ₹1,722 with strong volume and a sustained close.
Targets after breakout:
🎯 ₹1,800 → ₹1,900 → ₹2,000+
Stop-loss:
For a breakout trade, a close below ₹1,650 can be used as a tighter risk level.
For a wider positional setup, ₹1,580 is the more important technical support.
My preferred setup: I would not chase ₹1,630 blindly. The cleaner risk/reward is either a controlled entry around ₹1,580–₹1,610 or a confirmed breakout above ₹1,722.  Long
Long
BAJAJFINSV - Symmetrical Triangle Breakdown | Short Trade SetupHello traders, let's break down the current market structure for Bajajfinsv Limited (BAJAJFINSV) on the 125-minute timeframe.
After printing a recent high at 2,118.5, the stock entered a phase of price compression, forming a neat symmetrical triangle pattern. Price action is now breaking below the lower support line of this pattern, signaling that sellers are taking control and momentum is turning bearish.
Key Technical Observations:
Symmetrical Triangle Breakdown: The converging trendlines highlight a period of consolidation where volatility dried up. The breach below the lower trendline indicates a breakdown in favor of the bears.
Key Support Target: The horizontal dotted lines around the 1,930 level mark a significant prior structure and demand zone, serving as our primary target for this move.
Trade Setup (Short):
Entry: Initiate short position below 2010.
Stop Loss (SL) : Place a strict SL above the triangle breakdown structure at 2035.
Target: 1930 (Key structural support / demand zone).
Trade Psychology & Risk Management:
Key Takeaway: Consistent trading relies on discipline over anticipation. Ensure entry occurs strictly upon confirmation below the entry trigger level, and always keep your risk defined with a strict stop loss. Understanding the language of charts is about executing your plan with zero emotion.
Currently, the expectation is that before the stock can make a fresh, sustained upward move, it is likely to retrace and test its previous base. This pullback is a standard price action behavior as the market seeks liquidity at established demand zones.
This previous base is clearly formed around the yellow dotted lines marked on the chart, which correspond precisely to the 1,920 – 1,930 price level. Watching how the price reacts as it approaches this 1,930 target zone will be crucial; a successful test and bounce from this base would validate the next leg up.
What are your thoughts on BAJAJFINSV? Do you expect the price to reach the 1,930 demand zone, or do you anticipate a bounce back into the pattern? Let’s discuss in the comments!
This analysis is for educational purposes only and does not constitute financial advice.  Short
Short
 Long
Long
 Long
Long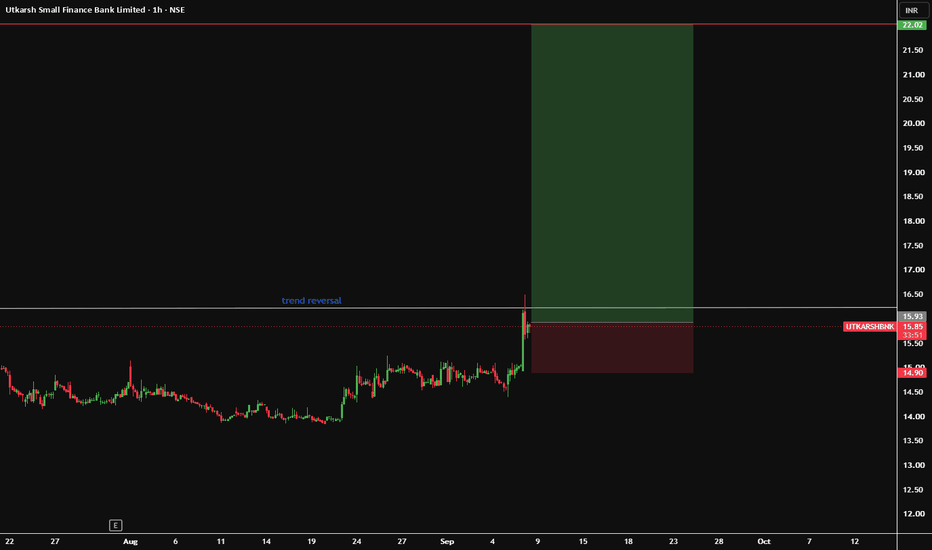
 Long
Long
 Long
Long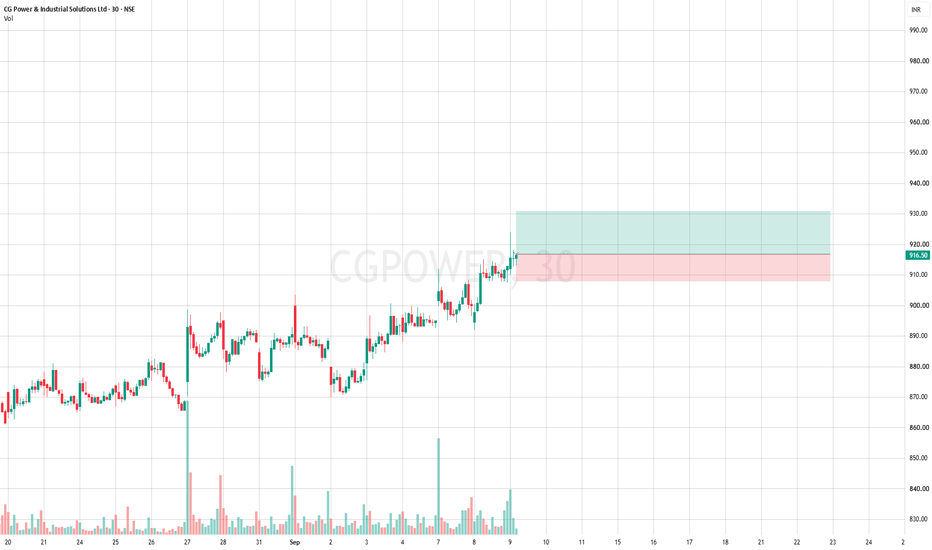
Marksans Pharma (MARKSANS) — Positional SetupBased on your chart, Marksans Pharma is in a strong consolidation/base near its highs, with an important breakout level around ₹335.5. The setup is attractive, but I would prefer confirmation rather than chasing inside the base.
Technical setup
CMP: ₹330.15
Key resistance / pivot: ₹335.5
Immediate breakout: Sustained close above ₹335.5–₹340
Upside zones: ₹360 → ₹380 → ₹400
Base support: ₹315–₹320
Major positional support: ₹300
Risk level: A decisive close below ₹300 would weaken the setup.
RS Rating: 90 — strong relative strength.
The chart shows a series of higher bases and the stock is holding close to its recent high.
🎯 Positional strategy
Aggressive: Entry only after a convincing breakout above ₹340 with strong volume.
Conservative: Wait for ₹340+ breakout and then look for a successful retest of ₹335–₹340.
Targets:
🎯 T1: ₹360
🎯 T2: ₹380
🎯 T3: ₹400
Stop-loss: ₹315 for a tighter trade, or ₹300 on a wider positional basis depending on your risk tolerance.
The key point: ₹335–₹340 is the decision zone. Don't treat an intraday move above it as a confirmed breakout.
Marksans Pharma: Breakout Setup Near ₹335
Marksans Pharma is showing an interesting positional setup after a strong uptrend followed by a tight consolidation near its recent highs.
The stock is currently trading around ₹330, with ₹335–₹340 acting as an important breakout zone. A sustained close above this zone, preferably accompanied by strong volume, could signal the next leg of the uptrend.
From a technical perspective, the stock has maintained strong relative strength, with an RS Rating of 90. The recent price structure also indicates that buyers are defending the higher levels.
The important technical levels are ₹335–₹340 on the upside and ₹315–₹320 as the first support zone. A break below ₹300 would significantly weaken the positional setup.
Fundamentally, Marksans Pharma has several positives. The company has a portfolio of more than 350 products and 2,000+ SKUs. Its latest consolidated quarter reported revenue of ₹841 crore, operating profit of ₹213 crore and net profit of ₹159 crore, with an operating margin of 25%.
The company is also described by Screener as almost debt-free, while its five-year profit growth has been strong. However, investors should also consider the stock's relatively high valuation and elevated debtor days.
For traders and positional investors, ₹335–₹340 is therefore the key zone to watch. A strong breakout can open the possibility of ₹360, ₹380 and ₹400 over time.
Setup: Buy on a confirmed breakout/retest rather than chasing the price.
Disclaimer: This is a technical/fundamental analysis for educational purposes and is not investment advice. Always manage position size and risk according to your own strategy.  Long
Long
YUKEN INDIA## Yuken India Ltd. (CMP ₹1,067.00, NSE: YUKEN)
**The SmartWay Research Desk | 10 September 2026**
A Bengaluru‑based engineering company, incorporated in 1976. Yuken India Ltd. is a joint venture with **Yuken Kogyo (Japan)**, engaged in manufacturing **hydraulic pumps, valves, power units, and industrial hydraulic equipment**. The company caters to industries such as machine tools, steel, automotive, construction, and infrastructure.
**Promoter Holding (Jun 2026):** **Yuken Kogyo (Japan) & Indian Partners — ~73.2% stake (no pledges)**
---
### FY22–FY26 Snapshot
- **Revenue Growth:** FY26 revenue ₹842 Cr vs ₹742 Cr in FY25 (+13.5% YoY). → **Good**
- **Net Profit:** FY26 PAT ₹112 Cr vs ₹96 Cr in FY25 (+16.7% YoY). → **Good**
- **Operating Margin:** FY26 EBITDA ₹182 Cr, margin 21.6% vs 20.9% last year (+70 bps). → **Good**
- **Equity Capital:** Stable, face value ₹10. → **Good**
- **Dividend Policy:** Dividend ₹5.00/share declared for FY26. → **Good**
- **Asset Building:** Investments in **hydraulic technology upgrades and plant expansion**. → **Good**
- **Sales:** Strong demand from **machine tools and construction equipment**. → **Good**
- **Expense:** Raw material cost pressures (steel, alloys) remain. → **Neutral/Good**
- **EPS:** FY26 EPS ₹35.25 vs ₹30.20 last year (+16.7%). → **Good**
---
### Institutional Interest & Ownership Trends (Jun 2026)
- **Promoter Holding:** ~73.2% (no pledges)
- **FII Holding:** ~2.4%
- **DII Holding:** ~3.8%
- **Retail & Others:** ~20.6%
---
### Strategic Moves & Innovations
- Expansion in **hydraulic pumps and valves for industrial automation**.
- Focus on **construction and infrastructure equipment demand**.
- Partnerships with **Japanese parent for technology transfer**.
- Diversification into **hydraulic power units for renewable energy projects**.
---
### Cash Flow & Balance Sheet Strength
- Market cap ~₹3,200 Cr.
- Debt‑to‑equity ratio ~0.28 (low leverage).
- Book value per share ₹182.00; P/B ~5.9.
- EPS (TTM) ₹35.25; P/E ~30.3.
---
### Risk Factors
- High **P/E ratio ~30.3**, valuations expensive.
- Dependence on **industrial demand cycles and infra spending**.
- Exposure to **commodity price volatility (steel, alloys)**.
- Competition from Eaton India, Bosch Rexroth, and Hydac India.
---
### Investor Takeaway
Yuken India has delivered **steady FY26 performance**, supported by demand in machine tools, construction equipment, and hydraulic technology upgrades. With strong promoter backing (Yuken Kogyo, 73.2% stake), dividend payouts, and leadership in hydraulic systems, Yuken remains a **mid‑cap engineering and automation play**. At CMP ₹1,067.00, valuations are **expensive (P/E ~30.3, P/B ~5.9)**, reflecting growth expectations but also sectoral risks.  Long
Long
 Long
Long
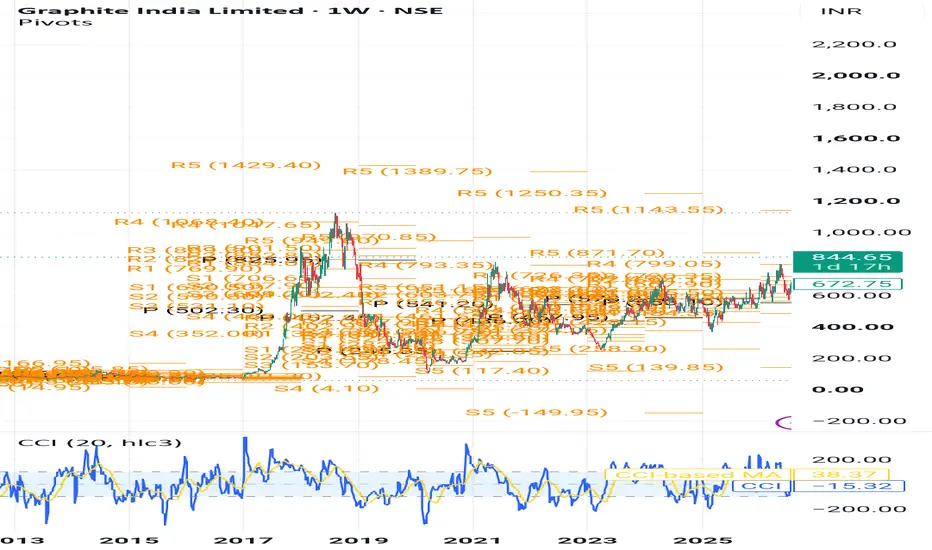
Graphite India 🎯 STOCK TO WATCH
WEEKLY R4 MOMENTUM BREAKOUT SETUP
₹820–840 → ₹1,143 → ₹1,429
A graphite-electrode cycle + strong balance sheet + capacity expansion + momentum setup appearing on my Weekly R4 Momentum Breakout Scanner.
⚫ GRAPHITE INDIA LTD
NSE: GRAPHITE
📌 TRADE LEVELS
🟢 Buy Zone: ₹820–840
🟠 Breakout Zone: ₹799
🔴 Stop Loss: ₹667
🎯 Target 1: ₹1,143
🚀 Target 2: ₹1,429
🔥 WHY GRAPHITE INDIA?
• Strong Q1 FY27: Consolidated revenue reached ₹842 Cr, up 26.6% YoY, while PAT rose 28.4% to ₹172 Cr.
• Returned to profitability sequentially: Q4 FY26 had reported a consolidated loss, while Q1 FY27 delivered ₹172 Cr PAT.
• Robust balance sheet: FY26 ended with approximately ₹3,767 Cr of net cash.
• Capacity expansion: The company is implementing a 25,000 TPA graphite-electrode expansion, with the first 13,000 TPA phase expected by Q4 FY27.
• Structural EAF opportunity: Graphite electrodes are essential consumables for electric-arc-furnace steelmaking, and the global shift toward EAF production could support long-term demand.
• Synthetic graphite opportunity: The company is progressing with its Synthetic Graphite Anode Materials (SGAM) project, adding a potential diversification avenue.
👀 WHY IT CAUGHT MY ATTENTION
📈 ₹799 is the key breakout reference on my scanner.
📈 Q1 revenue and PAT both delivered double-digit YoY growth.
📈 Balance sheet provides substantial financial strength.
📈 Capacity expansion can add future volume potential.
📈 EAF penetration creates a structural demand theme.
📈 SGAM provides an additional long-term optionality.
📈 The setup combines cyclical recovery + asset strength + technical momentum.
⚠️ IMPORTANT
This is not a straightforward earnings-growth story. Graphite electrodes remain a cyclical business, and pricing, steel production, Chinese supply, energy costs and export conditions can materially affect margins.
There is also an important Q1 earnings-quality point: consolidated results include investment/other-income effects, so core graphite-electrode profitability and realizations need to be tracked separately.
Risk Defined. Reward Visible.
⚠️ This content is for educational purposes only and not investment advice. Please do your own due diligence before making any investment decisions.
© 20K Microcap Investing | R4 Momentum Desk
#GraphiteIndia #GRAPHITE #GraphiteElectrodes #SteelStocks #SpecialtyMaterials #MomentumStocks #BreakoutStocks #IndianStocks #R4Momentum #StockToWatch  Long
Long
RELIANCE: The Stairstep Down
RELIANCE rallied roughly 4% from a 1278 low to a 1333 high over about three sessions on the 75-minute chart — a clean, orderly advance.
Since that high, price has printed six consecutive lower-high/lower-low legs, each one a similar 10-18 point step rather than one sharp drop.
The trendline connecting the post-peak swing highs is still fully intact — every attempted bounce has been sold into it, most recently right where the line sits now.
Current price (1285.5) sits in the lower third of the 200-bar range and is pressing toward 1277.2, the most recent intraday low and the closest thing to a defended floor on this chart.
Volume on the down-legs has been inconsistent rather than expanding, which usually points to steady distribution rather than a panic flush.
Net effect: an orderly, low-drama unwind that hasn't broken down hard, but also hasn't found a level buyers are stepping up to defend yet.
Two ways this goes from here. A close back above the declining trendline (~1299-1300) would be the first real sign the stairstep is done and buyers are back in control. A clean break of 1277.2 instead would open the next shelf lower, with nothing obvious defending price until the low-1260s.
No call being made either way, this is what the last 55 bars show, not a forecast. If the floor holds here, does the character of this decline actually change, or does it just pause? Artemis Medicare 🎯 STOCK TO WATCH
WEEKLY R4 MOMENTUM BREAKOUT SETUP
₹347–350 → ₹548 → ₹779
A hospital expansion + strong profit growth + momentum setup appearing on my Weekly R4 Momentum Breakout Scanner.
🏥 ARTEMIS MEDICARE SERVICES LTD
NSE: ARTEMISMED
📌 TRADE LEVELS
🟢 Buy Zone: ₹347–350
🟠 Breakout Zone: ₹347
🔴 Stop Loss: ₹258
🎯 Target 1: ₹548
🚀 Target 2: ₹779
🔥 WHY ARTEMIS MEDICARE?
• Strong Q1 FY27 performance: Consolidated revenue from operations reached ₹287.32 Cr, up 12.69% YoY.
• PAT acceleration: Q1 FY27 PAT jumped 48.33% YoY to ₹31.44 Cr, with EPS rising 46.67% YoY.
• Margin improvement: Q1 FY27 EBITDA margin was around 21.5%, showing improvement in operating profitability.
• Large expansion runway: Artemis has approved Tower IV with 200+ additional beds, focused on quaternary paediatric care and advanced gynaecology/women's health.
• Established healthcare platform: Artemis operates a 400+ bed multispecialty hospital in Gurgaon and is JCI/NABH accredited.
• FY26 was already a strong base: Consolidated FY26 revenue from operations was ₹1,081 Cr, with PAT of ₹103.72 Cr, versus ₹82.18 Cr in FY25.
👀 WHY IT CAUGHT MY ATTENTION
📈 ₹347 is the key technical trigger on my R4 scanner.
📈 Q1 revenue continues to grow double-digit YoY.
📈 PAT growth is substantially faster than revenue growth.
📈 Operating margins have improved.
📈 200+ new beds provide a potential next phase of capacity-led growth.
📈 The company's healthcare platform is already established rather than being a purely speculative expansion story.
⚠️ IMPORTANT
This is still a high-risk momentum setup.
The planned Tower IV expansion requires approximately ₹160–180 Cr of investment, with internal accruals and debt financing, so execution and balance-sheet discipline need monitoring.
Also, Q1FY27 capacity utilisation was around 65.7%, meaning the success of the additional capacity will depend on successfully ramping specialised services.
Risk Defined. Reward Visible.
⚠️ This content is for educational purposes only and not investment advice. Please do your own due diligence before making any investment decisions.
© 20K Microcap Investing | R4 Momentum Desk
#ArtemisMedicare #ARTEMISMED #HospitalStocks #HealthcareStocks #MomentumStocks #BreakoutStocks #IndianStocks #R4Momentum #StockToWatch  Long
Long
Pktea🎯 STOCK TO WATCH
WEEKLY R4 MOMENTUM BREAKOUT SETUP
₹1,136 → ₹1,582 → ₹2,098
A tea plantation + improving earnings + momentum setup appearing on my Weekly R4 Momentum Breakout Scanner.
🍃 THE PERIA KARAMALAI TEA & PRODUCE CO. LTD
NSE: PKTEA
📌 TRADE LEVELS
🟢 Buy Zone: ₹1,136
🟠 Breakout Zone: ₹1,136
🔴 Stop Loss: ₹820
🎯 Target 1: ₹1,582
🚀 Target 2: ₹2,098
🔥 WHY PERIA KARAMALAI?
• Strong Q1 FY27: Sales reached ₹20.56 Cr, up 23.4% YoY.
• Profit growth: Q1 FY27 PAT was ₹9.90 Cr, up 26.1% YoY.
• High operating margin: Q1 operating margin was around 57.9%, with operating profit of ₹11.17 Cr.
• Large plantation asset: The company has around 1,518 hectares across four estates in the Anamallais/Valparai region.
• Premium tea capability: Its Karamalai factory has capacity for 3.5 million kg of CTC tea and 0.6 million kg of Orthodox tea annually.
• Beyond tea: The company also cultivates coffee, black pepper, spices and fruits, including an organically certified spice farm.
👀 WHY IT CAUGHT MY ATTENTION
📈 ₹1,136 is the key technical trigger on my R4 scanner.
📈 Q1 FY27 delivered double-digit sales and profit growth.
📈 Operating profitability remains unusually strong for a plantation business.
📈 Large estate holdings provide an additional asset dimension.
📈 Premium Orthodox + CTC tea gives the company product diversification.
📈 Coffee, spices, fruits and renewable energy add optionality beyond the core tea business.
⚠️ IMPORTANT
This is a high-risk small-cap/low-liquidity momentum setup. The biggest caution is earnings cyclicality: FY26 ended with a ₹6.67 Cr annual loss, despite sales rising 35% to ₹68.30 Cr, before the sharp Q1 FY27 recovery.
Tea prices, weather, plantation yields, labour costs and commodity cycles can materially affect profitability. Therefore, Q2–Q4 execution is important before treating the Q1 improvement as a durable earnings trend.
Risk Defined. Reward Visible.
⚠️ This content is for educational purposes only and not investment advice. Please do your own due diligence before making any investment decisions.
© 20K Microcap Investing | R4 Momentum Desk
#PeriaKaramalai #PKTEA #TeaStocks #PlantationStocks #SmallCapStocks #MomentumStocks #BreakoutStocks #IndianStocks #R4Momentum #StockToWatch  Long
Long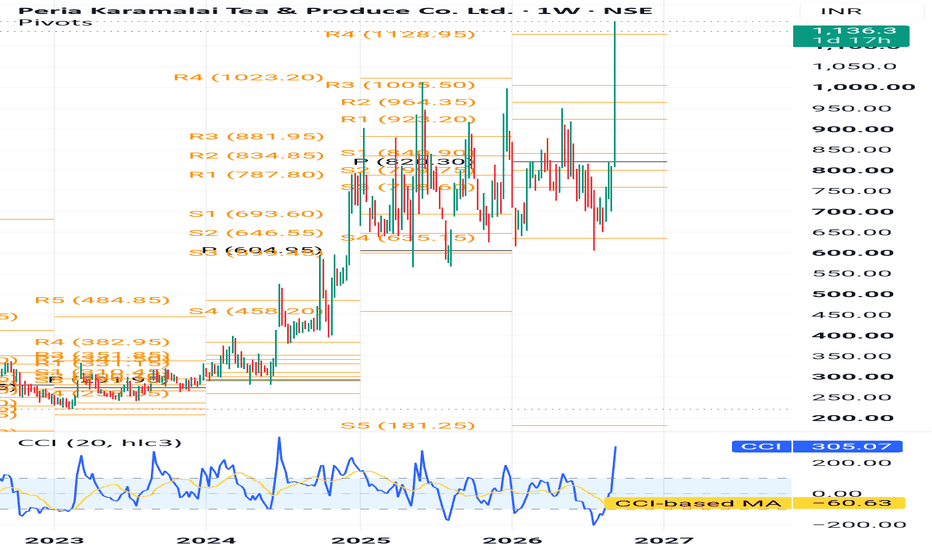
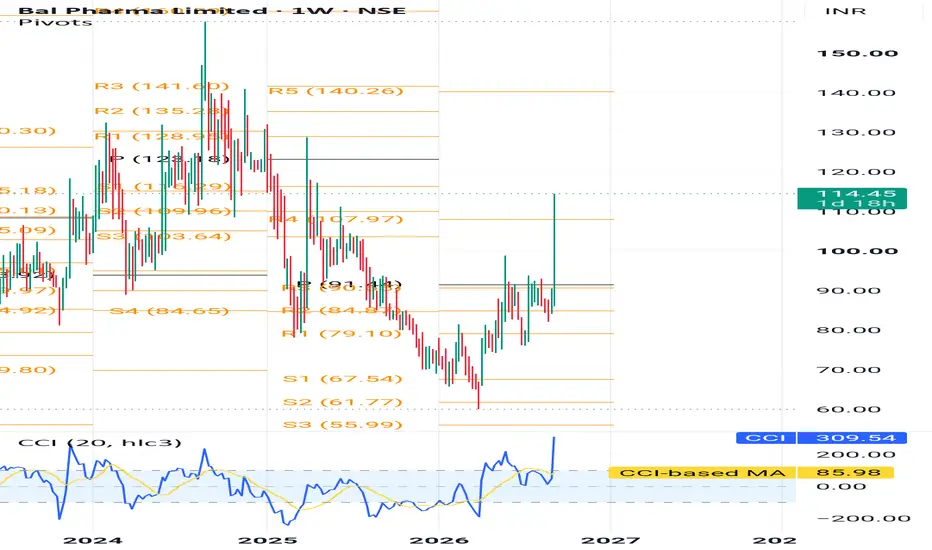
Bal Pharma 🎯 STOCK TO WATCH
WEEKLY R4 MOMENTUM BREAKOUT SETUP
₹110–114 → ₹160 → ₹294 → ₹362
A small-cap pharma + API + export-oriented momentum setup appearing on my Weekly R4 Momentum Breakout Scanner.
💊 BAL PHARMA LTD
NSE: BALPHARMA
📌 TRADE LEVELS
🟢 Buy Zone: ₹110–114
🟠 Breakout Zone: ₹107
🔴 Stop Loss: ₹82
🎯 Target 1: ₹160
🚀 Target 2: ₹294
🔥 Target 3: ₹362
🔥 WHY BAL PHARMA?
• Revenue momentum: Q1 FY27 consolidated revenue was about ₹89 Cr, up ~34% YoY.
• API + formulations business: Bal Pharma operates across bulk actives, prescription/generic medicines, OTC products, IV infusions and formulations.
• Export-oriented platform: Its APIs and formulations are supplied across Europe, Australia, Japan, Far East, Latin America, Africa and Middle East markets.
• Integrated manufacturing: The company has manufacturing facilities across Bengaluru, Pune, Rudrapur, Sangli and Udaipur.
• Niche product portfolio: Its API portfolio spans areas including anti-diabetic, anti-histamine, anti-inflammatory, cardiovascular and other therapeutic segments.
• Fresh promoter capital: On 7 September 2026, Bal Pharma allotted 10 lakh convertible warrants to promoter Shailesh Siroya at ₹84 per warrant, aggregating ₹8.40 Cr.
👀 WHY IT CAUGHT MY ATTENTION
📈 ₹107 is the key breakout reference on my scanner.
📈 Buy zone sits at ₹110–114.
📈 Revenue growth has accelerated YoY.
📈 Export/API exposure provides multiple geographical markets.
📈 Small-cap pharma can produce sharp momentum when earnings and technical structure align.
📈 Promoter warrant allotment at ₹84 is worth tracking as a recent corporate-development signal.
⚠️ IMPORTANT — THIS ONE NEEDS DISCIPLINE
The Q1 headline growth is stronger than the sequential earnings picture. Operating profit was ₹7.95 Cr, down 24.8% QoQ, while net profit was ₹1.12 Cr, down 68.8% QoQ.
So I would not treat this as a pure fundamental compounder yet. The technical setup needs confirmation through sustained revenue growth, margins and cash generation.
Also, the recent ₹84 preferential warrant issue to the promoter should be factored into any detailed dilution/shareholding analysis.
Risk Defined. Reward Visible.
⚠️ This content is for educational purposes only and not investment advice. Please do your own due diligence before making any investment decisions.
© 20K Microcap Investing | R4 Momentum Desk
#BalPharma #BALPHARMA #PharmaStocks #APIStocks #SmallCapStocks #MomentumStocks #BreakoutStocks #IndianStocks #R4Momentum #StockToWatch  Long
Long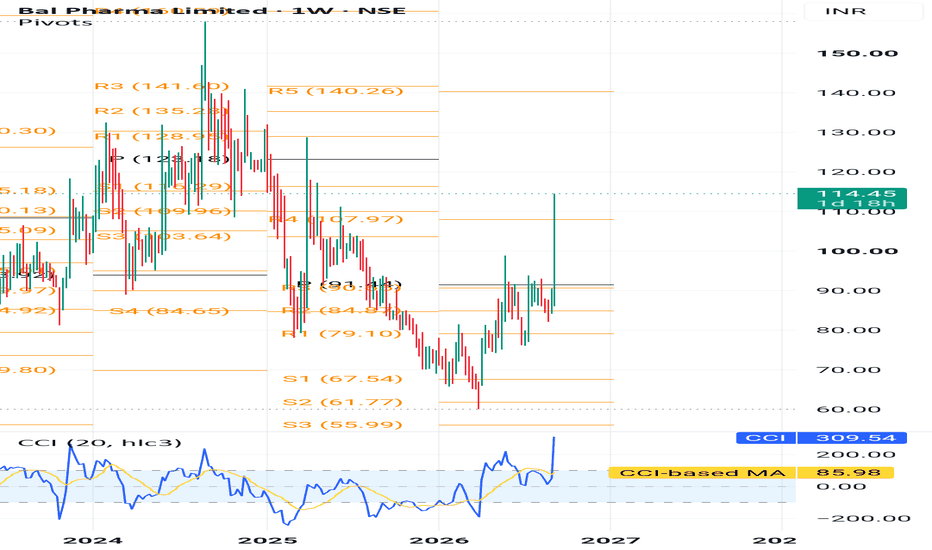
Bhartiya International Limited 🎯 STOCK TO WATCH
WEEKLY R4 MOMENTUM BREAKOUT SETUP
₹1,030–1,050 → ₹1,596 → ₹2,629
A fashion-export turnaround + earnings acceleration + momentum setup appearing on my Weekly R4 Momentum Breakout Scanner.
👕 BHARTIYA INTERNATIONAL LTD
NSE: BIL
📌 TRADE LEVELS
🟢 Buy Zone: ₹1,030–1,050
🟠 Breakout Zone: ₹1,017
🔴 Stop Loss: ₹716
🎯 Target 1: ₹1,596
🚀 Target 2: ₹2,629
🔥 WHY BHARTIYA INTERNATIONAL?
• Strong Q1 FY27 growth: Revenue from operations reached ₹372.80 Cr, up 33.16% YoY and 19.22% QoQ.
• Sharp profit turnaround: Q1 PAT was ₹17.76 Cr, versus a ₹5.42 Cr loss in Q1 FY26.
• Operating leverage: Operating profit increased 53.76% YoY to ₹31.73 Cr in Q1 FY27.
• Global fashion platform: Bhartiya operates in leather apparel, accessories and textile apparel, serving international brands across major markets.
• Vertical integration: Its capabilities span design, sourcing, production, quality control and logistics, giving it a relatively integrated fashion-manufacturing model.
• Recent corporate development: The company has entered into an agreement to sell its Bengaluru Gottigere property for ₹31 Cr, with plans to relocate manufacturing operations.
👀 WHY IT CAUGHT MY ATTENTION
📈 ₹1,017 is the key breakout reference on my scanner.
📈 Revenue acceleration is now accompanied by a meaningful earnings turnaround.
📈 Operating profit growth is stronger than revenue growth.
📈 The company has a global customer and manufacturing footprint.
📈 The recent property transaction and relocation could alter the operating structure.
📈 If the technical breakout sustains, the setup offers substantial asymmetric upside.
⚠️ IMPORTANT
This is not a low-risk compounder setup. Fashion/export businesses remain sensitive to global demand, raw-material costs, currency movements and customer concentration.
Also, Q1's sharp YoY improvement comes against a weak Q1 FY26 base, so the next few quarters are important to establish whether the turnaround is sustainable.
Risk Defined. Reward Visible.
⚠️ This content is for educational purposes only and not investment advice. Please do your own due diligence before making any investment decisions.
© 20K Microcap Investing | R4 Momentum Desk
#BhartiyaInternational #BIL #FashionStocks #ExportStocks #SmallCapStocks #MomentumStocks #BreakoutStocks #IndianStocks #R4Momentum #StockToWatch  Long
Long
Long 
 Long
Long