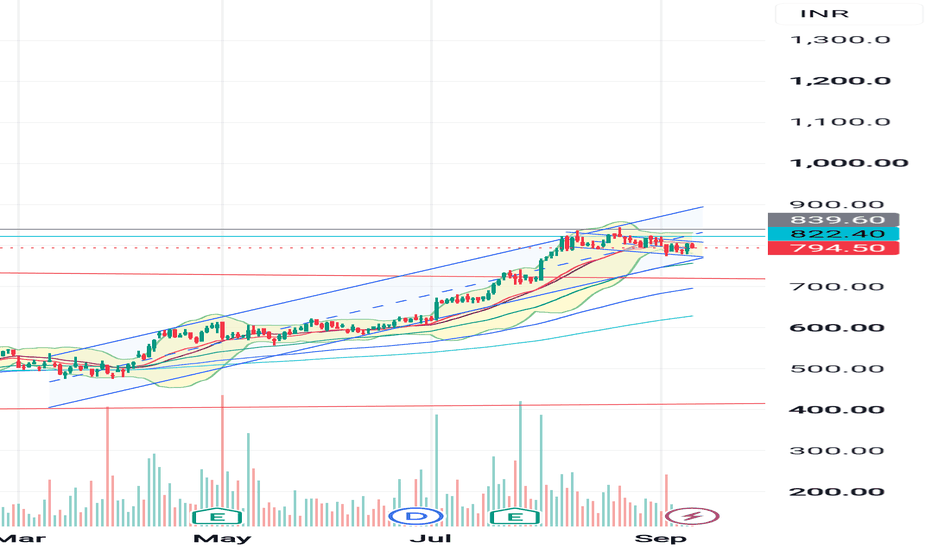
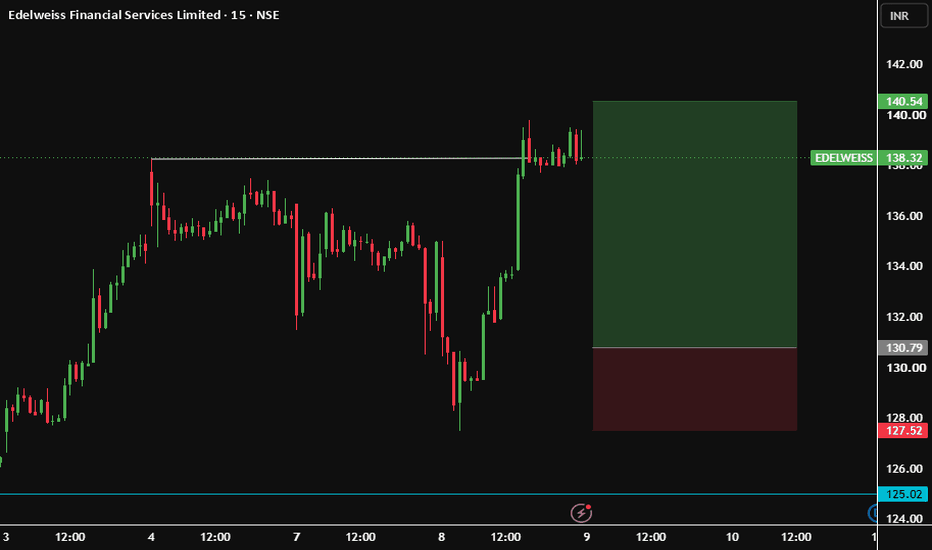
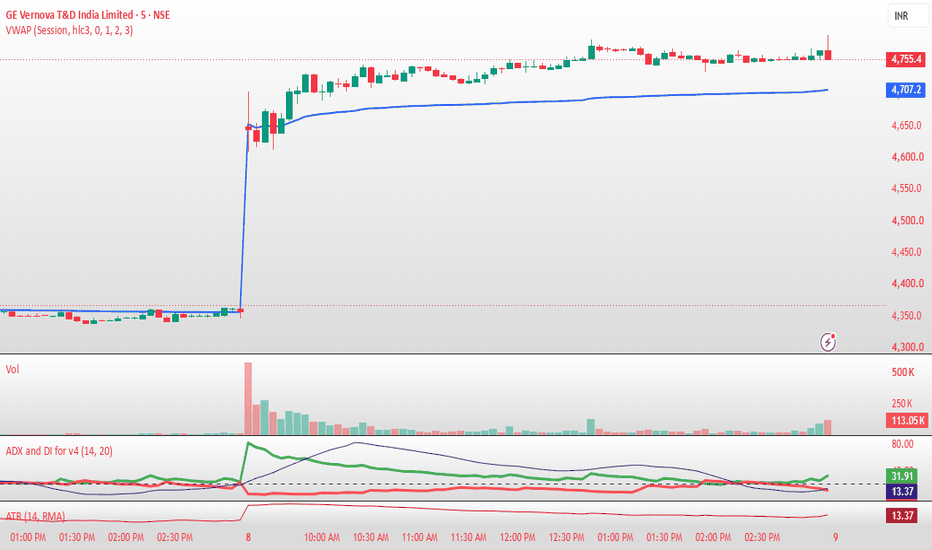
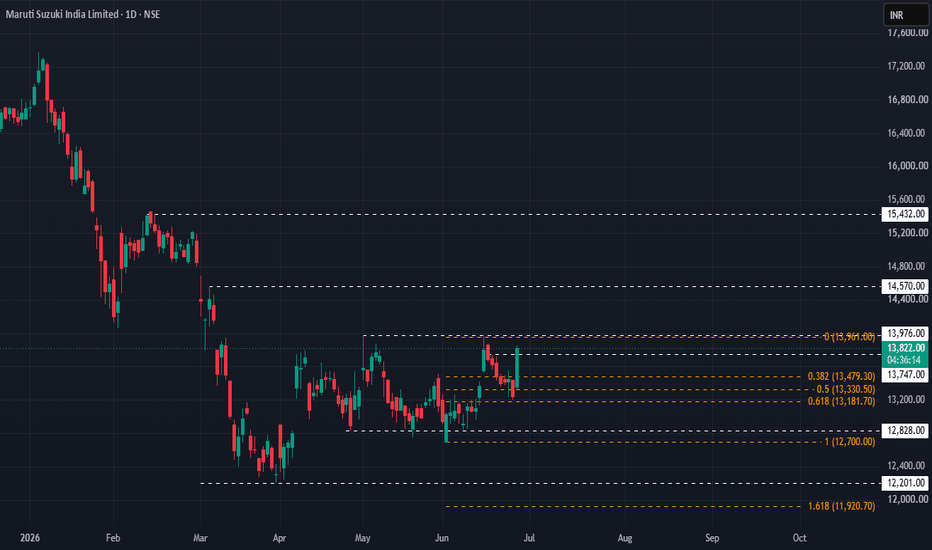
TITAN (D) CHARTTechnical Note: Let the market come to your zones and show its hand. Trade safe and manage your risk! Always wait for your own confirmations before entering the market.
Risk Disclaimer: This analysis is for educational purposes only and does not constitute financial advice. Always practice proper risk and position sizing. Stop Loss Must if you want to be a profitable Trader.
TVS Motors cmp 3608.40 Daily ChartTVS Motors cmp 3608.40 Daily Chart
- Support Zone 3425 to 3570 Price Band
- Resistance Zone 3650 to 3800 Price Band
- Support Zone seems to be tested retested
- Rounding Bottom near Resistance Zone neckline
- Resistance Zone & Trendline Breakout attempted
- Volumes needed for fresh price momentum uptrend
DIVISLAB (D) CHARTTechnical Note: Let the market come to your zones and show its hand. Trade safe and manage your risk! Always wait for your own confirmations before entering the market.
Risk Disclaimer: This analysis is for educational purposes only and does not constitute financial advice. Always practice proper risk and position sizing. Stop Loss Must if you want to be a profitable Trader.
GRASIM (D) CHARTTechnical Note: Let the market come to your zones and show its hand. Trade safe and manage your risk! Always wait for your own confirmations before entering the market.
Risk Disclaimer: This analysis is for educational purposes only and does not constitute financial advice. Always practice proper risk and position sizing. Stop Loss Must if you want to be a profitable Trader.
TEDS Swing Trading Analysis | TCS 1H | 13 July 26
Strong rallies often tempt traders to chase the price. A disciplined framework teaches us to wait until the market provides a structured opportunity.
In this chart, the TEDS (Trend Exhaustion Detection System) follows a process-driven approach rather than reacting to emotions.
Chart Observation
🔹 After a strong bullish move, the framework first placed the market into a Short Queue, indicating that the trend required observation instead of immediate action.
🔹 Once the required confirmation conditions aligned, TEDS generated a Sell Signal and established a predefined Entry Zone.
🔹 Before considering any trade, the framework also defined the Stop Loss Area and Target Levels, ensuring that risk and reward were planned in advance.
A trading framework is not designed to predict every market move.
Its purpose is to help traders answer four important questions:
• Has the setup been confirmed?
• Is the entry based on predefined rules?
• Is the risk clearly defined before execution?
• Am I following my framework or my emotions?
The market will always offer another opportunity. Discipline comes from waiting for the right opportunity.
Trade with a Framework. Not with Emotions.
Disclaimer: This chart is shared for educational purposes only to explain a structured trading framework and market behaviour. It is not investment advice or a recommendation to buy or sell any security. Please conduct your own analysis and apply appropriate risk management before making any trading decisions.
Coming out of ConsolidationNo. of shareholder declining indicating accummulation
IPO so no comparison of prev. results but overall YoY basis rising
Coming out of long consolidation
Higher lows with recent swing in 6.5% range
690 next hurdle (20% from entry)
Dried up volumes during contraction
Good performance during weak market
Kalyan Jwellers Ab Yahan Atak Jayega 555
## Company Overview
Kalyan Jewellers India Limited is one of India's leading organized jewellery retailers. The company primarily sells **gold, diamond, platinum, silver, and precious stone jewellery** through a large network of showrooms across India and international markets.
Its business model is built around **Trust, Brand Value, Customer Experience, and an Asset-Light Expansion Strategy**.
---
# Business Segments
### 1. Gold Jewellery
Gold jewellery contributes the largest share of revenue.
Products include:
* Bridal Jewellery
* Traditional Jewellery
* Daily Wear Collections
* Temple Jewellery
* Lightweight Jewellery
---
### 2. Diamond & Precious Jewellery
The company offers:
* Diamond Jewellery
* Solitaire Jewellery
* Precious Stone Jewellery
* Platinum Jewellery
* Luxury Collections
These products generally carry **higher profit margins** than plain gold jewellery.
---
### 3. Silver Jewellery
The company also sells:
* Silver Articles
* Silver Coins
* Gift Items
* Religious Products
This segment continues to grow, especially during festive seasons.
---
### 4. Digital Business – Candere
Kalyan owns **Candere**, its online-first jewellery brand.
Candere targets:
* Young professionals
* Urban consumers
* Online jewellery buyers
* Lightweight and fashion jewellery customers
This strengthens Kalyan's omnichannel presence.
---
# Revenue Sources
The company earns revenue from:
* Gold Jewellery Sales
* Diamond Jewellery Sales
* Wedding Jewellery
* Festival Demand
* Gold Exchange Programs
* Advance Purchase Schemes
* Franchise (FOCO) Operations
* Online Jewellery Sales (Candere)
---
# FOCO Expansion Strategy
Kalyan is rapidly expanding through the **FOCO (Franchisee Owned, Company Operated)** model.
Under this model:
* Franchise partner invests in the showroom.
* Kalyan manages branding and operations.
* Lower capital investment for the company.
* Faster store expansion.
* Better Return on Capital Employed (ROCE).
---
# Competitive Advantages
* Strong and trusted brand
* Large showroom network
* Leadership in wedding jewellery
* Asset-light expansion model
* Strong customer trust
* Omnichannel retail presence
* Certified and hallmarked jewellery
* Wide product portfolio
---
# Growth Drivers
* Rising organized jewellery market in India
* Increasing disposable income
* Growing wedding industry
* Expansion into Tier-2 and Tier-3 cities
* International expansion
* Growth of online jewellery business
* Increasing demand for diamond jewellery
---
# Business Risks
* Volatility in gold prices
* Weak consumer spending
* Competition from organized jewellery retailers
* Changes in import duties and government regulations
* Inventory and working capital requirements
---
# Why Customers Prefer Kalyan Jewellers
* Transparent pricing
* Trusted brand reputation
* BIS Hallmarked Gold
* Certified Diamonds
* Extensive product range
* Attractive exchange and purchase schemes
* Strong after-sales service
---
# Simple Business Model
**Procure Gold & Diamonds → Design Jewellery → Manufacture/Source Products → Sell Through Showrooms & Online Platform → Earn Revenue from Jewellery Sales → Expand Through FOCO Model → Reinvest for Growth**
---
## One-Line Summary
**Kalyan Jewellers is a leading jewellery retailer that generates revenue by selling gold, diamond, platinum, and silver jewellery through an extensive showroom network and digital platforms, while driving long-term growth through its trusted brand, omnichannel strategy, and capital-efficient FOCO expansion model.**
WIPRO Bullish Setup | Breakout Watch WIPRO UPDATE | Channel Breakout Setup
Key Breakout Level: 181
A sustained breakout above 181 can confirm fresh bullish momentum.
Upside Targets:
183 (Initial Retest Zone)
187
190 (Channel Pattern Target)
Major Support Zone: 170 – 172
Market View: The bullish structure remains intact as long as the stock holds above the 170–172 support zone. A decisive breakout above 181 can accelerate the move towards the next resistance levels.
Advance is bullish i am telling you in advanceADVANCE — Rounded Base Breakout, Approaching Overhead Supply
Advance Agrolife Ltd. topped out near ₹150 in November 2025, then declined into a broad rounded/saucer-shaped base through February–May 2026, bottoming around ₹95–100. Since then, price has been recovering steadily, forming a higher-low structure and reclaiming ground within a horizontal consolidation range.
Key observations:
Current price: ₹113.67, up 2.88% today, trading near the top of its recent consolidation range.
Support/base zone: ₹106–113 (shaded red), the recent range low and demand area from the last few weeks.
Immediate resistance: a horizontal zone around ₹117–120 (light teal box), followed by a larger supply zone at ₹120–146 (shaded green) tied to the November 2025 – January 2026 distribution range.
Price is pressing against short-term resistance after a multi-week grind higher off the base.
Bias:
A confirmed close above ₹120 would signal a breakout from the base and open room toward the ₹140–146 zone, where heavier historical supply sits. Until then, price remains range-bound between ₹106 support and ₹120 resistance. A break below ₹106 would put the recovery structure at risk and suggest a retest of lower levels.
Not investment advice — for educational/analysis purposes only. Please do your own research before trading.
Mbel Breakout
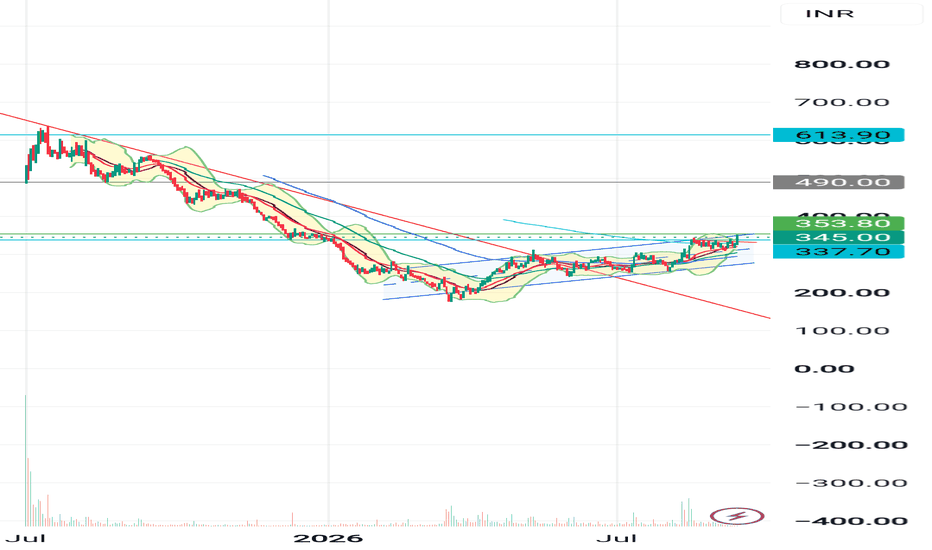
MBEL — Breaking Out of Falling Wedge After Base Formation
M & B Engineering Limited declined from a peak near ₹520 in November 2025 down to lows around ₹280–300 by March 2026, before carving out a falling wedge pattern — a bullish reversal/continuation structure marked by converging trendlines with lower highs and lower lows, but at a decelerating pace.
Key observations:
Current price: ₹337.70, up 5.66% today, breaking above the wedge's upper trendline with strong momentum.
Support/base zone: ₹304–337 (shaded red), representing the recent consolidation range and wedge lower boundary.
Target/resistance zone: ₹337–480 (shaded green), the next major area of interest if the breakout sustains, with the prior swing high near ₹480 acting as a longer-term reference point.
Today's move breaks decisively above the descending trendline that had capped price since November, on a notable volume pickup.
Bias:
The breakout above the falling wedge, backed by strong volume and a 5%+ move, favors bullish continuation. A sustained hold above ₹337–340 keeps the path open toward ₹400+ and eventually the ₹480 zone. A failure to hold above ₹320 (former resistance turned support) would weaken the setup and suggest a false breakout.
Not investment advice — for educational/analysis purposes only. Please do your own research before trading.
Digitide Will Join the bull race "Digitide Solutions recently listed on NSE and is currently in a price discovery phase with limited trading history. Watching the ₹106–110 zone for near-term direction, with ₹300+ marked as a longer-term area of interest. Not enough data yet for a reliable technical structure — worth revisiting once more price history builds up."
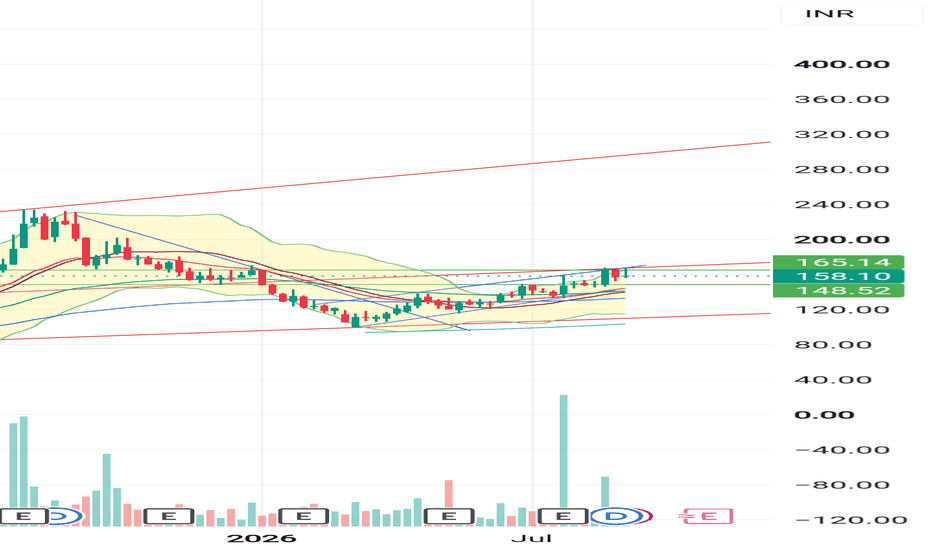
Utkarshbnk Going to BreakUTKARSHBNK — Higher Low Base Building, Eyeing Breakout from Key Resistance
Utkarsh Small Finance Bank has carved out a solid higher-low structure since bottoming near ₹9.85 in April 2026, with a rising trendline connecting successive higher lows through May–July. Price has since rallied into a horizontal resistance zone that has capped multiple attempts since June.
Key observations:
Current price: ₹15.20, up 3.83% on the day, pushing directly into resistance.
Resistance/supply zone: ₹14.60–16.00 (shaded red), a level where price has repeatedly stalled since the June rally began.
Target/breakout zone: ₹16.00–19.90 (shaded green), representing the next major move if this resistance is cleared, with round-number resistance near ₹19.94 and ₹22.03 further above.
The rising trendline support (from the April low) continues to hold, keeping the broader structure constructive.
Bias:
A sustained close above ₹16.00 with strong volume would confirm the breakout and open the path toward ₹19.90+. As long as price holds above the rising trendline (~₹13.50–14.00 currently), the higher-low structure remains intact and dips can be viewed as opportunities within the uptrend. A break below the trendline would weaken this setup.
Not investment advice — for educational/analysis purposes only. Please do your own research before trading.
Ajmera Breakout AJMERA — Bull Flag Retest After Sharp Recovery Rally
Ajmera Realty & Infra India bottomed out near ₹80 in April 2026 and staged a strong recovery rally, rallying past ₹140 by early July. Since that peak, price has pulled back into a descending channel/bear flag — a short-term corrective structure within the larger uptrend — with lower highs and lower lows contained by two parallel trendlines.
Key observations:
Current price: ₹136.74, trading near the flag's upper trendline.
Immediate support/demand zone: ₹123–140 (shaded red), aligning with the flag's lower boundary and a prior horizontal consolidation base.
Key resistance/supply zone overhead: ₹140–180 (shaded green), representing the next major target zone if the flag resolves higher.
The flag pattern, occurring after a sharp impulsive move up, is typically a continuation pattern — a breakout above the upper trendline (~₹140) would favor resumption of the uptrend toward the ₹150–180 zone.
Bias:
Bullish continuation is favored above ₹140 on a confirmed close with volume support. A breakdown below ₹123 would invalidate the flag and risk a retest of lower support levels.
Not investment advice — for educational/analysis purposes only. Please do your own research before trading.
Dabur BullishDABUR — Coiling Inside a Contracting Triangle, Testing Apex Resistance
Dabur India (NSE) has been in a broader downtrend since late 2025, falling from highs near ₹560 to a low around ₹414 by April 2026. Since then, price has been consolidating in a contracting/symmetrical triangle — lower highs capped by a descending trendline, and higher lows supported by an ascending trendline — a classic volatility-squeeze pattern.
Key observations:
Price is currently trading at ₹438.90, right at the apex of the triangle, testing the descending trendline resistance.
Immediate resistance/pivot zone sits around ₹440–443.
A larger supply zone lies overhead in the ₹500–516 region — the origin of the prior decline.
Support/demand zone below is marked around ₹414–438, coinciding with the recent swing lows and the triangle's lower boundary.
Bias:
A decisive close above the descending trendline (~₹440–443) with volume expansion could open room toward the ₹460–480 zone, with the ₹500–516 supply area as the next major hurdle. Conversely, failure to hold the rising trendline/support zone (~₹414–420) would suggest continuation of the downtrend.
Triangle breakouts can be false, so waiting for a confirmed close (not just an intraday poke) beyond either boundary, ideally with above-average volume, is prudent.
Not investment advice — for educational/analysis purposes only. Please do your own research before trading.
NIVA BUPANiva Bupa Health Insurance Ltd. (CMP ₹88.09, NSE: NIVABUPA)
The SmartWay Research Desk | 14 July 2026
A Gurugram‑based health insurance company, incorporated in 2008 (formerly Max Bupa Health Insurance, rebranded as Niva Bupa in 2021). Niva Bupa is among India’s leading standalone health insurers, offering retail and group health insurance products, critical illness covers, and wellness solutions.
Promoter Holding (Mar 2026): Bupa UK & True North — 54.00% stake (no pledges)
FY22–FY26 Snapshot
Revenue Growth: FY26 revenue ₹4,212 Cr vs ₹3,742 Cr in FY25 (+12.6% YoY). → Good
Net Profit: FY26 PAT ₹312 Cr vs ₹268 Cr in FY25 (+16.4% YoY). → Good
Operating Margin: FY26 EBITDA ₹612 Cr, margin 14.5% vs 13.6% last year (+90 bps). → Good
Equity Capital: Stable, face value ₹10. → Good
Dividend Policy: Dividend ₹2.00/share declared for FY26. → Good
Asset Building: Investments in digital health platforms and distribution expansion. → Good
Sales: Strong demand from retail health insurance and group policies. → Good
Expense: Claims ratio ~78%, manageable. → Neutral/Good
EPS: FY26 EPS ₹4.25 vs ₹3.65 last year (+16.4%). → Good
Institutional Interest & Ownership Trends (Mar 2026)
Promoter Holding: 54.00% (no pledges)
FII Holding: 12.12%
DII Holding: 18.34%
Retail & Others: 15.54%
Strategic Moves & Innovations
Expansion in digital distribution and bancassurance partnerships.
Focus on wellness programs and preventive health covers.
Partnerships with hospitals and healthcare providers for cashless networks.
Diversification into critical illness and OPD insurance products.
Cash Flow & Balance Sheet Strength
Market cap ~₹8,800 Cr.
Debt‑to‑equity ratio ~0.22 (low leverage).
Book value per share ₹42.10; P/B ~2.1.
EPS (TTM) ₹4.25; P/E ~20.7.
Risk Factors
Dependence on healthcare inflation and medical cost cycles.
Exposure to regulatory changes in IRDAI norms.
Competition from Star Health, HDFC ERGO, and ICICI Lombard.
Margin pressure if claims ratio rises.
Investor Takeaway
Niva Bupa has delivered steady FY26 performance, supported by retail health insurance demand, digital expansion, and wellness offerings. With strong promoter backing, dividend payouts, and growing institutional interest, Niva Bupa remains a mid‑cap health insurance play. At CMP ₹88.09, valuations are reasonable (P/E ~20.7, P/B ~2.1), making it attractive for investors seeking exposure to India’s health insurance growth story.