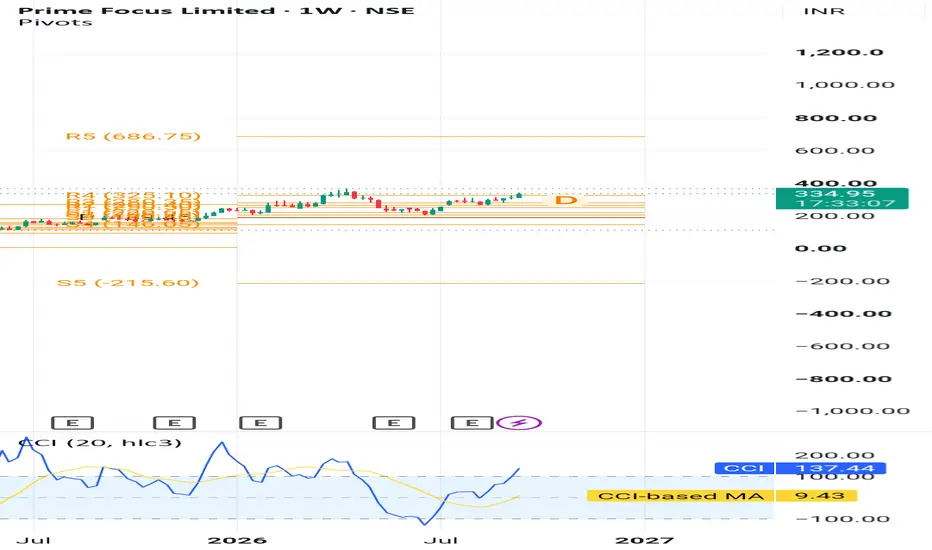
#CYIENTDLMCyient DLM is a leading electronics system design and manufacturing player, which provides system design, integration, testing, and manufacturing of electronic components and subsystems for original equipment manufacturers (OEMs) in the aerospace and defense sectors and other high-tech engineering segments. It has customers in India, Europe, North America, China and Japan.
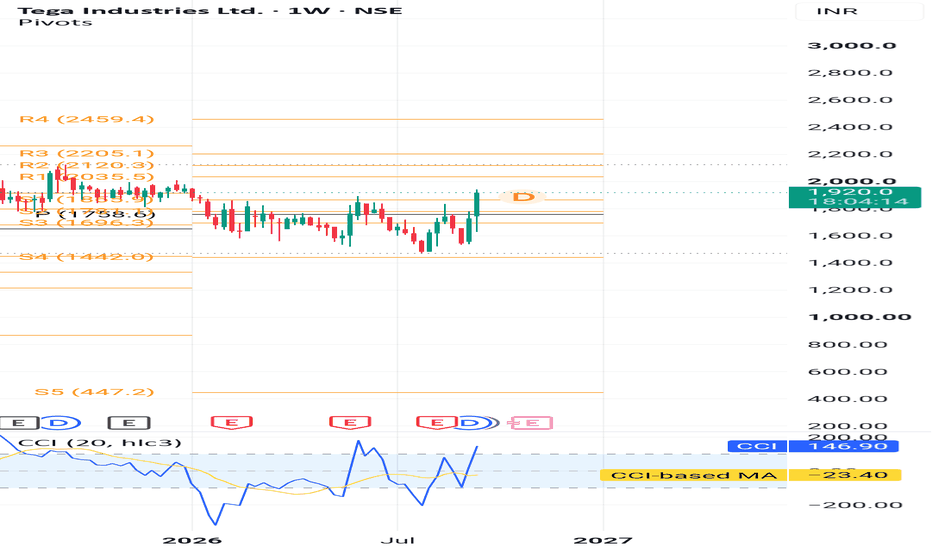
TEJASNET 4HR
Bullish Bat
Strong Potential Reversal Zone as price initially when touched Point D it given good reaction and hit target1 now price again came in the zone now its reversal
Price need to follow Accelerted TREND LINE i.e green line and hit targets else if price breaks PRIMARY TREN D LINE i.e exit trade with small loss before SL
POTENTIAL BUY
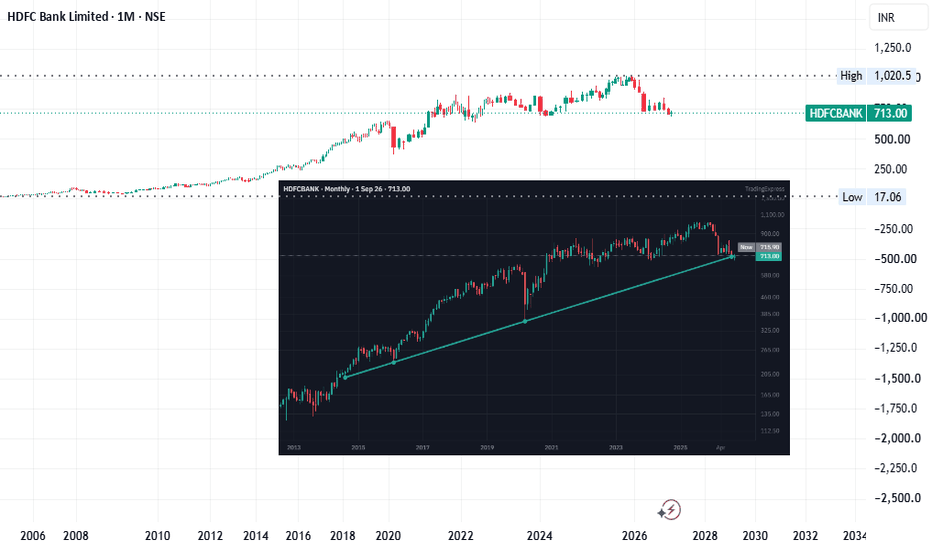
HDFC Bank: Adam found Eve... Is ₹900 the honeymoon?🏦💍📈
### 🏦 HDFC Bank – Adam & Eve Bottom Pattern
After months of frustrating sideways action, HDFC Bank appears to be completing a classic Adam & Eve bottom, one of the more reliable reversal structures when confirmed with a breakout.
The neckline around ₹806 has already been reclaimed, and price is now consolidating above prior resistance—a constructive sign if buyers continue defending this zone.
Technical roadmap
- ✅ Adam & Eve bottom completed
- ✅ Neckline successfully reclaimed
- ✅ Healthy consolidation after breakout
- 🎯 Initial measured move projects towards ₹899
- 🚀 Extended logarithmic projection targets approximately ₹911
- ❌ Losing ₹806 on a closing basis would weaken the bullish thesis.
📊 Fundamental Snapshot
Fundamentally, sentiment towards HDFC Bank has been improving following management's continued focus on deposit growth, margin stabilisation and integrating the HDFC merger. Investors are also watching for improving loan growth as liquidity conditions ease.
Looking ahead, market participants will focus on:
- Stronger deposit mobilisation
- Net Interest Margin (NIM) stability
- Continued improvement in credit growth
- Asset quality remaining healthy
If execution continues improving over the coming quarters, sentiment could gradually shift back in favour of India's largest private lender.
📚 Educational Corner
The Adam & Eve Bottom combines two different types of lows:
🔹 Adam = a sharp panic reversal (V-shaped bottom)
🔹 Eve = a slower, rounded accumulation phase
When price breaks above the neckline with volume, it often signals that buyers have regained long-term control. As always, confirmation matters more than prediction.
💬 Question for the community
Will HDFC Bank finally reclaim ₹900... or is this another false dawn?
Drop your target below 👇
Bullish? 🟢
Bearish? 🔴
### #Hashtags
#HDFCBank #NSE #India #IndianStocks #BankNifty #Nifty50 #SwingTrading #TechnicalAnalysis #ChartPattern #AdamAndEve #Investing #PriceAction #TradingView #StockMarket #Breakout #LongTermInvesting
Disclaimer: I am not a registered Financial Advisor (FA) or Chartered Market Technician (CMT). This post is for educational purposes only and is not investment advice.
Tejas Networks –Recovery & Breakout Continuation Setup Near ₹470The price has shown a strong recovery after a prolonged correction and is currently trading around the ₹460–₹470 zone. The recent consolidation near resistance indicates accumulation, suggesting a potential breakout if momentum sustains.
The key demand/support zone lies near ₹383 – ₹463, which can act as a strong base on pullbacks.
Trade Plan
Entry Zone:
₹460 – ₹475 (on consolidation or breakout above ₹475)
Stop Loss:
₹383.00 (below key demand zone / invalidation level)
Primary Targets:
₹594.45 (near-term resistance level)
₹721.95 (major resistance level)
₹851.05 (final target if momentum continues)
Chart Observations
• Price has recovered strongly from lower levels and is now consolidating near ₹470.
• The ₹383 – ₹463 zone is acting as a strong demand area.
• Current price action suggests accumulation before a possible breakout.
• ₹594 is the immediate resistance where price may face selling pressure.
• A breakout above ₹594 can push the price toward ₹721 and higher levels.
• Structure indicates bullish continuation if price sustains above current levels.
Notes
• This is a recovery + breakout continuation setup.
• Buying on dips near support can offer a favorable risk-reward setup.
• Traders may consider partial profit booking near ₹594 and trail positions for higher targets.
Disclaimer
This idea is for educational purposes only and not financial or investment advice. Markets are volatile and conditions can change quickly. Always do your own analysis and apply proper risk management before taking any trades.
JSW Infrastructure – Bullish Continuation Setup Near ₹275 ZoneThe price has shown a strong recovery after a consolidation phase and is currently trading around the ₹270–₹275 zone. The recent bullish momentum indicates strength, suggesting a potential continuation of the uptrend if the price sustains above the breakout area.
The key demand/support zone lies near ₹237 – ₹265, which can act as a strong base on pullbacks.
Trade Plan
Entry Zone:
₹268 – ₹275 (on consolidation or minor pullback near breakout zone)
Stop Loss:
₹237.10 (below key demand zone / invalidation level)
Primary Targets:
₹302.60 (near-term resistance level)
₹339.75 (major resistance level)
₹376.45 (final target if momentum continues)
Chart Observations
• Price has formed a higher low structure, indicating bullish recovery.
• The ₹237 – ₹265 zone is acting as a strong demand area.
• Current price action near ₹275 suggests breakout continuation strength.
• ₹302 is the immediate resistance where price may face selling pressure.
• A breakout above ₹302 can push the price toward ₹339 and higher levels.
• Structure supports bullish continuation after accumulation.
Notes
• This is a bullish continuation setup — buying on dips is favorable.
• The stop loss at ₹237.10 helps manage downside risk effectively.
• Traders may consider partial profit booking near ₹302 and trail positions for higher targets.
Disclaimer
This idea is for educational purposes only and not financial or investment advice. Markets are volatile and conditions can change quickly. Always do your own analysis and apply proper risk management before taking any trades.
Info Edge – Consolidation Breakout Setup Near ₹1,000 ZoneThe price has been consolidating after a recovery from lower levels and is currently trading around the ₹980–₹1,010 zone. The stock is attempting to sustain near a key breakout area, and a successful move above resistance could trigger a fresh bullish leg.
The key demand/support zone lies near ₹926 – ₹960, which can act as a strong base on pullbacks.
Trade Plan
Entry Zone:
₹980 – ₹1,010 (on consolidation or breakout above ₹1,007)
Stop Loss:
₹926.00 (below key demand zone / invalidation level)
Primary Targets:
₹1,166.00 (near-term resistance level)
₹1,326.55 (major resistance level)
₹1,488.50 – ₹1,493.15 (extended target if momentum continues)
Chart Observations
• Price has formed a base after a correction and is attempting to resume its uptrend.
• The ₹926 – ₹960 zone is acting as a strong demand area and support base.
• Current price action near ₹1,000 suggests accumulation before a potential breakout.
• ₹1,166 is the immediate resistance where price may face initial selling pressure.
• A breakout above ₹1,166 can push the price toward ₹1,326 and higher levels.
• The risk-reward setup remains favorable as long as price holds above ₹926.
Notes
• This is a consolidation-to-breakout setup — confirmation above ₹1,007 is important.
• The stop loss at ₹926 helps manage downside risk effectively.
• Traders may consider partial profit booking near ₹1,166 and trail positions for higher targets.
Disclaimer
This idea is for educational purposes only and not financial or investment advice. Markets are volatile and conditions can change quickly. Always do your own analysis and apply proper risk management before taking any trades.
Titan Company – Strong Bullish Reversal & Breakout SetupThe price has shown a strong bullish reversal from the ₹4,060 support zone and is currently trading around the ₹4,280–₹4,300 zone. The recent breakout candle indicates renewed buying interest, suggesting a potential continuation of the uptrend if the price sustains above the breakout level.
The key demand/support zone lies near ₹4,063 – ₹4,160, which can act as a strong base on pullbacks.
Trade Plan
Entry Zone:
₹4,250 – ₹4,300 (on consolidation or minor pullback near current levels)
Stop Loss:
₹4,063.60 (below key demand zone / invalidation level)
Primary Targets:
₹4,576.05 (near-term resistance level)
₹4,861.20 (major resistance level)
₹5,149.55 (extended target)
₹5,153.20 (final target if momentum continues)
Chart Observations
• Price has formed a strong bullish reversal from the ₹4,060 support zone.
• The ₹4,063 – ₹4,160 zone is acting as a strong demand area and recent base.
• Current price action near ₹4,283 confirms breakout strength.
• ₹4,576 is the immediate resistance where price may face initial selling pressure.
• A breakout above ₹4,576 can push the price toward ₹4,861 and higher levels.
• The risk-reward setup is attractive with limited downside and substantial upside potential.
Notes
• This is a bullish reversal + continuation setup.
• The stop loss at ₹4,063.60 helps manage downside risk effectively.
• Traders may consider partial profit booking near ₹4,576 and trail positions for higher targets.
• Sustaining above ₹4,283 will strengthen the bullish outlook further.
Disclaimer
This idea is for educational purposes only and not financial or investment advice. Markets are volatile and conditions can change quickly. Always do your own analysis and apply proper risk management before taking any trades.
HDFC Bank – Bullish Continuation Setup Near ₹805 ZoneThe price has shown a steady recovery from recent lows and is currently trading around the ₹800–₹805 zone. After reclaiming key support levels, the stock is consolidating just below resistance, indicating accumulation and the potential for a bullish continuation if buying momentum persists.
The key demand/support zone lies near ₹772 – ₹790, which can act as a strong base on pullbacks.
Trade Plan
Entry Zone:
₹795 – ₹805 (on consolidation or a sustained breakout above ₹805)
Stop Loss:
₹772.65 (below key demand zone / invalidation level)
Primary Targets:
₹831.70 (near-term resistance level)
₹879.35 (major resistance level)
₹925.70 – ₹926.85 (extended target if momentum continues)
Chart Observations
• Price has recovered from the recent correction and is forming higher highs and higher lows.
• The ₹772 – ₹790 zone is acting as a strong demand area and recent support.
• Current price action around ₹800–₹805 indicates consolidation before a potential breakout.
• ₹831.70 is the immediate resistance where price may witness initial profit booking.
• A breakout above ₹831.70 can open the path toward ₹879.35 and eventually ₹925.70–₹926.85.
• The overall trend remains bullish as long as price holds above the support zone.
Notes
• This is a bullish continuation setup with a favorable risk-reward profile.
• The stop loss at ₹772.65 helps manage downside risk effectively.
• Traders may consider partial profit booking near ₹831.70 and trail the remaining position toward higher targets.
• A sustained close above ₹805 would further strengthen the bullish outlook.
Disclaimer
This idea is for educational purposes only and not financial or investment advice. Markets are volatile and conditions can change quickly. Always do your own analysis and apply proper risk management before taking any trades.
Mahindra & Mahindra Financial Services – Bullish ContinuationThe price has shown a strong recovery after a recent correction and is currently trading around the ₹330–₹332 zone. The stock has broken above its short-term consolidation range and is now holding above the breakout level, indicating bullish momentum. Sustaining above this zone could lead to a continuation of the uptrend.
The key demand/support zone lies near ₹303 – ₹331, which can act as a strong base on pullbacks.
Trade Plan
Entry Zone:
₹330 – ₹335 (on consolidation or a sustained move above ₹335)
Stop Loss:
₹303.15 (below key demand zone / invalidation level)
Primary Targets:
₹357.45 (near-term resistance level)
₹387.25 (major resistance level)
₹416.30 – ₹416.70 (extended target if momentum continues)
Chart Observations
• Price has given a strong breakout from a short-term consolidation, indicating renewed buying interest.
• The ₹303 – ₹331 zone is acting as a strong demand area and recent support.
• Current price action around ₹331 suggests bullish continuation after the breakout.
• ₹357.45 is the immediate resistance where price may face initial profit booking.
• A breakout above ₹357.45 can push the price toward ₹387.25 and eventually ₹416.30–₹416.70.
• The overall trend has turned positive with higher highs and higher lows forming on the daily chart.
Notes
• This is a bullish continuation setup with a favorable risk-reward profile.
• The stop loss at ₹303.15 helps manage downside risk effectively.
• Traders may consider partial profit booking near ₹357.45 and trail the remaining position toward higher targets.
• A sustained close above ₹335 with improving volume would further strengthen the bullish outlook.
Disclaimer
This idea is for educational purposes only and not financial or investment advice. Markets are volatile and conditions can change quickly. Always do your own analysis and apply proper risk management before taking any trades.
Jubilant Ingrevia – Bullish Continuation SetupThe price has shown a strong recovery after a recent correction and is currently trading around the ₹675–₹680 zone. The stock has broken above a short-term consolidation range and is holding near the breakout level, indicating improving bullish momentum. Sustaining above this zone could lead to a continuation of the uptrend.
The key demand/support zone lies near ₹614 – ₹670, which can act as a strong base on pullbacks.
Trade Plan
Entry Zone:
₹670 – ₹685 (on consolidation or a sustained breakout above ₹680)
Stop Loss:
₹613.95 (below key demand zone / invalidation level)
Primary Targets:
₹757.00 (near-term resistance level)
₹837.70 (major resistance level)
₹921.85 – ₹923.10 (extended target if momentum continues)
Chart Observations
• Price has recovered strongly from recent lows and is now holding above the breakout zone.
• The ₹614 – ₹670 zone is acting as a strong demand area and recent support.
• Current price action around ₹680 suggests bullish continuation after consolidation.
• ₹757.00 is the immediate resistance where price may face initial profit booking.
• A breakout above ₹757.00 can push the price toward ₹837.70 and eventually ₹921.85–₹923.10.
• The overall structure has shifted from corrective to bullish with higher highs and higher lows.
Notes
• This is a bullish continuation setup with a favorable risk-reward profile.
• The stop loss at ₹613.95 helps manage downside risk effectively.
• Traders may consider partial profit booking near ₹757.00 and trail the remaining position toward higher targets.
• A sustained close above ₹680 with improving volume would further strengthen the bullish outlook.
Disclaimer
This idea is for educational purposes only and not financial or investment advice. Markets are volatile and conditions can change quickly. Always do your own analysis and apply proper risk management before taking any trades.
Exide Industries – Strong BreakoutThe price has shown a strong bullish breakout after a period of consolidation and is currently holding around the ₹420–₹425 zone. The breakout is supported by strong momentum, indicating buyers are in control. As long as the stock sustains above the breakout zone, the probability of further upside remains favorable.
The key demand/support zone lies near ₹403.45 – ₹425.25, which can act as a strong base on pullbacks.
Trade Plan
Entry Zone:
₹418 – ₹425 (on consolidation or a minor pullback near the breakout zone)
Stop Loss:
₹403.45 (below key demand zone / invalidation level)
Primary Targets:
₹453.35 (near-term resistance level)
₹484.80 (major resistance level)
₹517.15 – ₹518.00 (extended target if momentum continues)
Chart Observations
• Price has given a decisive bullish breakout after consolidating for several sessions.
• The ₹403.45 – ₹425.25 zone is acting as a strong demand area and breakout support.
• Current price action around ₹421–₹425 suggests healthy consolidation after the breakout.
• ₹453.35 is the immediate resistance where price may witness initial profit booking.
• A breakout above ₹453.35 can push the stock toward ₹484.80 and eventually ₹517–₹518.
• The formation of higher highs and higher lows confirms strengthening bullish momentum.
• Sustained trading above ₹420 with healthy volume would further validate the bullish trend.
Notes
• This is a breakout continuation setup with a favorable risk-reward profile.
• The stop loss at ₹403.45 helps manage downside risk effectively.
• Traders may consider partial profit booking near ₹453.35 and trail the remaining position toward higher targets.
• Fresh buying is preferable on consolidation near the breakout zone or on a decisive close above recent highs.
Disclaimer
This idea is for educational purposes only and not financial or investment advice. Markets are volatile and conditions can change quickly. Always do your own analysis and apply proper risk management before taking any trades
Dabur India – Pullback Opportunity Before the Next Bullish MoveThe price has witnessed a sharp rejection after testing the ₹450–₹453 resistance zone and is currently trading around ₹436–₹437. Despite the recent pullback, the broader structure remains constructive as long as the stock holds above the key demand zone. A sustained move back above ₹452.80 could revive bullish momentum.
The key demand/support zone lies near ₹420.60 – ₹452.80, which could act as a strong base on pullbacks.
Trade Plan
Entry Zone:
₹435 – ₹445 (on consolidation or a bullish reversal near current levels)
Stop Loss:
₹420.60 (below key demand zone / invalidation level)
Primary Targets:
₹481.60 (near-term resistance level)
₹516.60 (major resistance level)
₹549.50 – ₹550.00 (extended target if momentum continues)
Chart Observations
• Price recently attempted a breakout but faced profit booking near the ₹450–₹453 resistance zone.
• The ₹420.60 – ₹452.80 zone is acting as a strong demand area and recent support.
• Current price action around ₹436 suggests a healthy pullback rather than a trend reversal.
• ₹481.60 is the immediate resistance where price may encounter initial selling pressure.
• A breakout above ₹481.60 can push the stock toward ₹516.60 and eventually ₹549.50–₹550.00.
• The broader trend remains positive, but buyers need to reclaim ₹452.80 to confirm bullish continuation.
Notes
• This is a pullback continuation setup within an emerging uptrend.
• The stop loss at ₹420.60 helps manage downside risk effectively.
• Traders may consider partial profit booking near ₹481.60 and trail the remaining position toward higher targets.
• A strong bullish candle with increased volume above ₹452.80 would significantly strengthen the bullish outlook.
Disclaimer
This idea is for educational purposes only and not financial or investment advice. Markets are volatile and conditions can change quickly. Always do your own analysis and apply proper risk management before taking any trades.
Westlife Foodworld – Bullish Breakout SetupThe price has shown a strong recovery from lower levels and is currently consolidating around the ₹502–₹509 zone after a bullish breakout. The stock is holding above its recent support, indicating accumulation by buyers. If the price sustains above the breakout area, it could pave the way for the next leg of the uptrend.
The key demand/support zone lies near ₹470 – ₹503, which can act as a strong base on pullbacks.
Trade Plan
Entry Zone:
₹500 – ₹510 (on consolidation or a sustained close above ₹510)
Stop Loss:
₹469.95 (below key demand zone / invalidation level)
Primary Targets:
₹581.00 (near-term resistance level)
₹662.54 (major resistance level)
₹741.25 (extended target if momentum continues)
Chart Observations
• Price has broken out from a consolidation range and is currently holding above the breakout level.
• The ₹470 – ₹503 zone is acting as a strong demand area and recent support.
• Current price action around ₹503–₹509 suggests healthy consolidation before the next move.
• ₹581.00 is the immediate resistance where price may witness initial profit booking.
• A breakout above ₹581.00 can push the stock toward ₹662.54 and eventually ₹741.25.
• The higher highs and higher lows indicate improving bullish momentum.
• Sustained buying interest near the breakout zone suggests institutional accumulation.
Notes
• This is a breakout continuation setup with an attractive risk-to-reward ratio.
• The stop loss at ₹469.95 helps manage downside risk effectively.
• Traders may consider partial profit booking near ₹581.00 and trail the remaining position toward higher targets.
• A decisive close above ₹510 with strong volume would further strengthen the bullish outlook.
Disclaimer
This idea is for educational purposes only and not financial or investment advice. Markets are volatile and conditions can change quickly. Always do your own analysis and apply proper risk management before taking any trades.
DLF: 1H High-Level Consolidation Holding Key 📊 DLF Limited (DLF) - 1-Hour (1H) Chart Analysis
This post is shared for EDUCATIONAL PURPOSES ONLY to observe structural price action consolidation, moving average alignment, and trend continuation behaviors. It is not financial or investment advice.
🎯 Educational Swing Setup:
• Entry Zone: 655.00 – 667.80 (Sizing into position blocks inside this structural consolidation base, or trailing entries near the dynamic hourly EMA cluster).
• Target 1: 700.00 (Immediate key psychological milestone and structural barrier)
• Target 2: 740.00+ (Extended macro swing continuation target zone)
• Invalidation / Stop-Loss: 630.00 (A definitive hourly close back below the pink long-term moving average baseline completely invalidates this bullish momentum thesis).
• Expected Duration: 5 to 12 Trading Days (Short-to-medium hourly swing view)
⚠️ Risk Management:
Since the price is trading within a corrective consolidation envelope, look for a fresh expansion spike in volume to confirm institutional continuation backing. Maintain disciplined position sizing at all times!
ANANTRAJ: 1H Local Range Breakout with Bullish EMA 📊 Anant Raj Limited (ANANTRAJ) - 1-Hour (1H) Chart Analysis
This post is shared for EDUCATIONAL PURPOSES ONLY to analyze short-term structural breakouts, volume expansions, and moving average fanning structures. It is not financial or investment advice.
🎯 Educational Swing Setup:
• Entry Zone: 575.00 – 592.10 (Accumulating safely within this fresh breakout extension, or maximizing risk-to-reward by tracking minor 1H pullbacks toward the 9-EMA support band).
• Target 1: 625.00 (Near-term structural resistance target zone)
• Target 2: 650.00 (Major psychological milestone target)
• Invalidation / Stop-Loss: 540.00 (A definitive hourly close below the pink long-term moving average baseline completely invalidates this breakout acceleration setup).
• Expected Duration: 4 to 10 Trading Days (Short-term hourly swing view)
⚠️ Risk Management:
Since the price has just put on a sharp vertical breakout drive, look for volume continuation to validate institutional backing over the subsequent sessions. Maintain highly disciplined position sizing!
BAJFINANCE: 1H Impulsive Expansion & Moving Average 📊 Bajaj Finance Limited (BAJFINANCE) - 1-Hour (1H) Chart Analysis
This post is shared for EDUCATIONAL PURPOSES ONLY to analyze short-term trend continuations, moving average ribbon fanning, and structural breakouts. It is not financial or investment advice.
🎯 Educational Swing Setup:
• Entry Zone: 1,025.00 – 1,056.30 (Sizing into position blocks near current levels, or maximizing risk-to-reward by accumulating on minor 1H pullbacks toward the 9-EMA or 15-EMA support bands).
• Target 1: 1,120.00 (Immediate key psychological and structural supply resistance overhead)
• Target 2: 1,180.00 (Extended momentum expansion target zone)
• Invalidation / Stop-Loss: 980.00 (A definitive hourly close back below the pink long-term moving average baseline completely invalidates this short-term bullish continuation structure).
• Expected Duration: 5 to 12 Trading Days (Short-to-medium hourly swing view)
⚠️ Risk Management:
Given the velocity of the recent vertical expansion on the hourly chart, a minor low-volume cool-down or a retest of the 1,040 zone is standard technical behavior. Keep your overall position sizing disciplined!