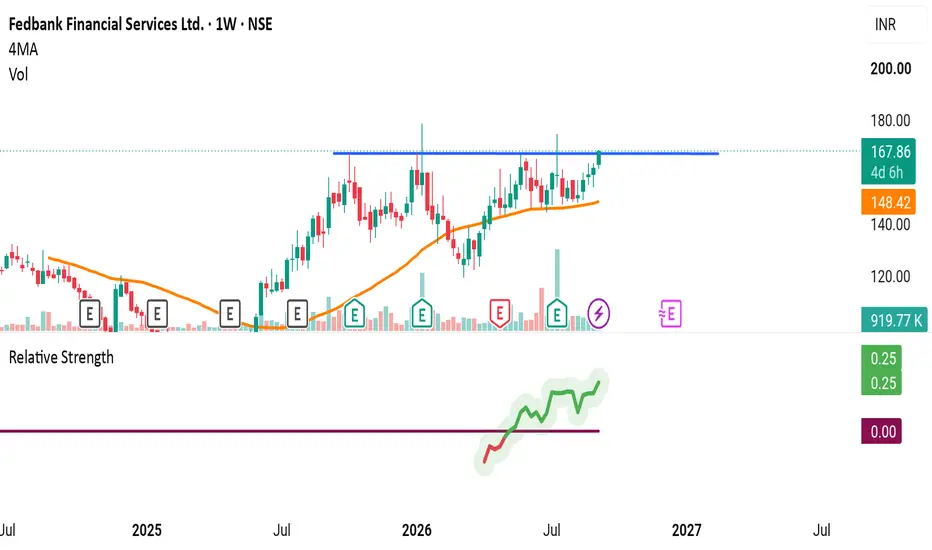
Long
Long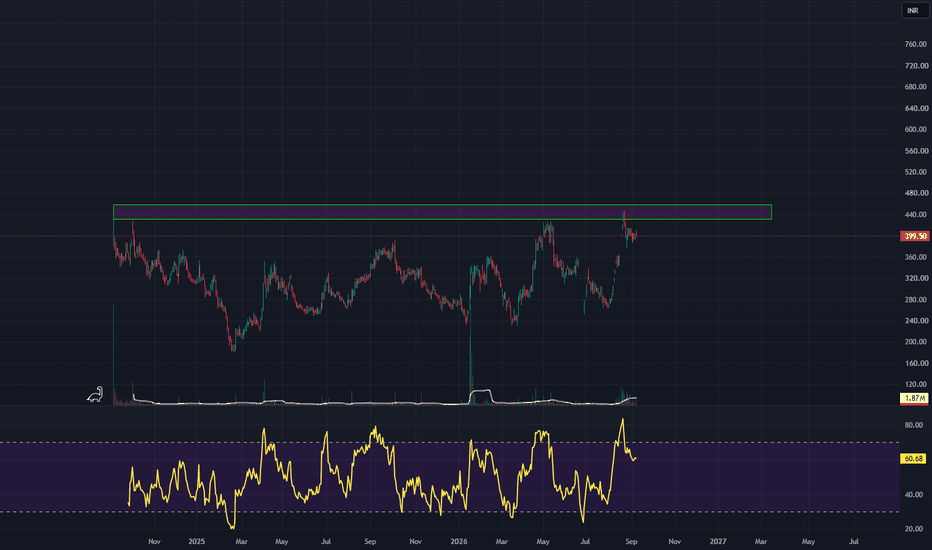
Mold Tek Technology 🛠️ STOCK TO WATCH 🛠️
₹210–215 → ₹299 → ₹416 → ₹769 👀
A structural engineering + US expansion + earnings turnaround + momentum setup appearing on my Weekly R4 Momentum Breakout Scanner.
Mold-Tek Technologies Ltd.
📌 Buy Zone: ₹210–215
📌 Breakout Zone: ₹210
🛑 Stop Loss: ₹146
🎯 Target 1: ₹299
🎯 Target 2: ₹416
🎯 Target 3: ₹769
Why Mold-Tek Technologies?
🏗️ Structural engineering specialist: Mold-Tek Technologies operates in structural engineering and design services, with exposure to the US engineering market.
🇺🇸 US expansion gaining traction: The integration of its US subsidiary Beryl Project Engineering has progressed, while Beryl received a US$1 million Master Purchase Order from Hillsburg County.
📈 Exceptional Q1 FY27 growth: Consolidated revenue reached ₹59.54 Cr, up 78.9% YoY, while PAT surged to ₹9 Cr, up more than 1,200% YoY.
💰 Margin inflection: Consolidated EBITDA margin expanded to approximately 23%, compared with 7% a year earlier, reflecting improved execution, utilisation and productivity.
📋 Strong revenue visibility: Work-on-hand in the Civil & Structural division increased to approximately US$4.5 million, providing visibility for future revenues.
🔥 Weekly R4 Momentum Breakout: ₹210 is the key technical level on my scanner. Sustained strength above this zone could open the path towards ₹299, ₹416 and potentially the higher ₹769 scenario.
Why It Caught My Attention
✅ 78.9% Q1 revenue growth
✅ Q1 PAT of ₹9 Cr — highest-ever quarterly profit
✅ Dramatic operating-margin improvement
✅ US subsidiary integration progressing
✅ US$4.5M civil & structural work-on-hand
✅ Potential operating leverage
🔥 Weekly R4 Momentum Breakout
⚠️ IMPORTANT
This is a high-risk small/mid-cap momentum setup.
The latest quarter was exceptionally strong, but the sustainability of these margins and growth is the key question. Management's ability to convert the US work-on-hand into recurring revenue, integrate the acquired business and maintain productivity will be important.
The ₹769 target is a high-end technical/momentum scenario, not a fundamental price forecast.
Risk Defined. Reward Visible.
📢 Disclaimer: This content is for educational purposes only and not investment advice. Please do your own due diligence before making any investment decisions.
© 20K Microcap Investing | R4 Momentum Desk
#MoldTekTechnology #MOLDTECH #StructuralEngineering #USStocks #EngineeringStocks #SmallCapStocks #TurnaroundStocks #MomentumStocks #BreakoutStocks #StockMarketIndia #IndianStocks #StocksToWatch #R4Breakout #MomentumInvesting #20KMicrocap  Long
Long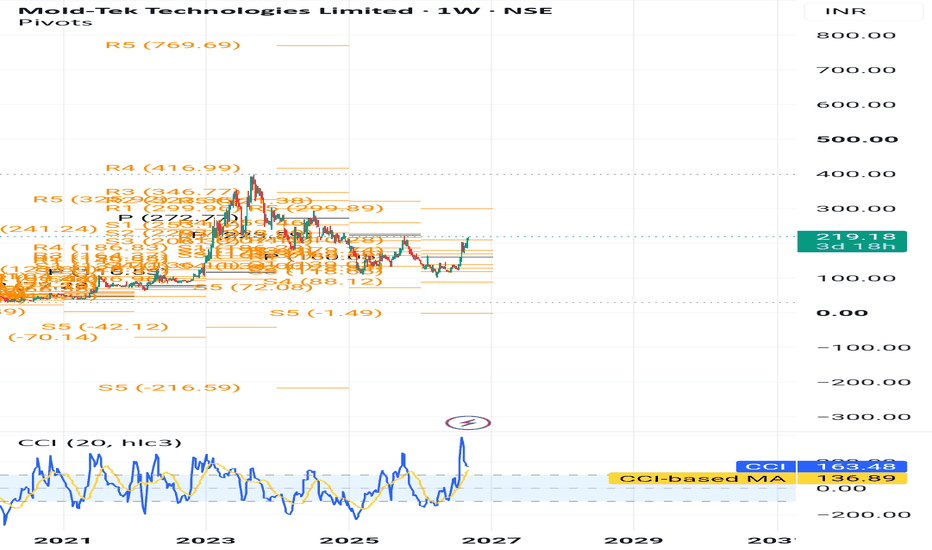
Dolphin offshore 🌊 STOCK TO WATCH 🌊
₹700–710 → ₹1,024 → ₹1,409 → ₹4,167 👀
A deep-value offshore services + earnings growth + momentum setup appearing on my Weekly R4 Momentum Breakout Scanner.
Dolphin Offshore Enterprises (India) Ltd.
📌 Buy Zone: ₹700–710
📌 Breakout Zone: ₹693
🛑 Stop Loss: ₹514
🎯 Target 1: ₹1,024
🎯 Target 2: ₹1,409
🎯 Target 3: ₹4,167
Why Dolphin Offshore?
🌊 Offshore oil & gas exposure: Dolphin Offshore operates in offshore oil & gas support services, with activities including marine operations, diving and underwater services. NSE classifies the company under a single segment — Oil & Gas Offshore Support Services.
📈 Strong Q1 FY27 revenue growth: Q1 FY27 revenue from operations reached ₹42.85 Cr, up 160.6% YoY from ₹16.44 Cr.
💰 Profit growth: Q1 FY27 PAT came in at ₹14.81 Cr, up 30.7% YoY, while PBT increased 52.5% YoY to ₹16.49 Cr.
🏗️ FY26 earnings scale-up: Consolidated FY26 revenue from operations was approximately ₹116.42 Cr, compared with ₹74.02 Cr in FY25, while consolidated profit for the year increased to ₹68.54 Cr from ₹46.48 Cr.
🛢️ Sector leverage: Offshore support businesses can benefit from increased activity around oil & gas exploration, maintenance and offshore infrastructure — making the operating environment an important trigger to watch.
🔥 Weekly R4 Momentum Breakout: ₹693 is the key technical level on my scanner. The ₹700–710 zone becomes the execution area for this setup.
Why It Caught My Attention
✅ Offshore oil & gas services exposure
✅ 160%+ YoY Q1 revenue growth
✅ 30%+ YoY Q1 PAT growth
✅ Strong FY26 consolidated profitability
✅ Marine/diving/underwater services
✅ Significant momentum already visible
🔥 Weekly R4 Momentum Breakout
⚠️ IMPORTANT
This is a high-risk small-cap setup after a significant price run.
The company itself clarified in August 2026 that the recent share-price movement was market-driven and that it had no undisclosed material information. The exchange had also sought clarification following the significant price movement.
Q1 FY27 was strong YoY, but PAT declined 47.7% QoQ from ₹28.33 Cr to ₹14.81 Cr. So, sequential earnings momentum needs to be monitored.
The ₹4,167 target is an extreme high-end technical/momentum scenario, not a fundamental price forecast.
Risk Defined. Reward Visible.
📢 Disclaimer: This content is for educational purposes only and not investment advice. Please do your own due diligence before making any investment decisions.
© 20K Microcap Investing | R4 Momentum Desk
#DolphinOffshore #DOLPHIN #OffshoreStocks #OilAndGasStocks #EnergyStocks #SmallCapStocks #MomentumStocks #BreakoutStocks #SpecialSituation #StockMarketIndia #IndianStocks #StocksToWatch #R4Breakout #MomentumInvesting #20KMicrocap  Long
Long
 Long
Long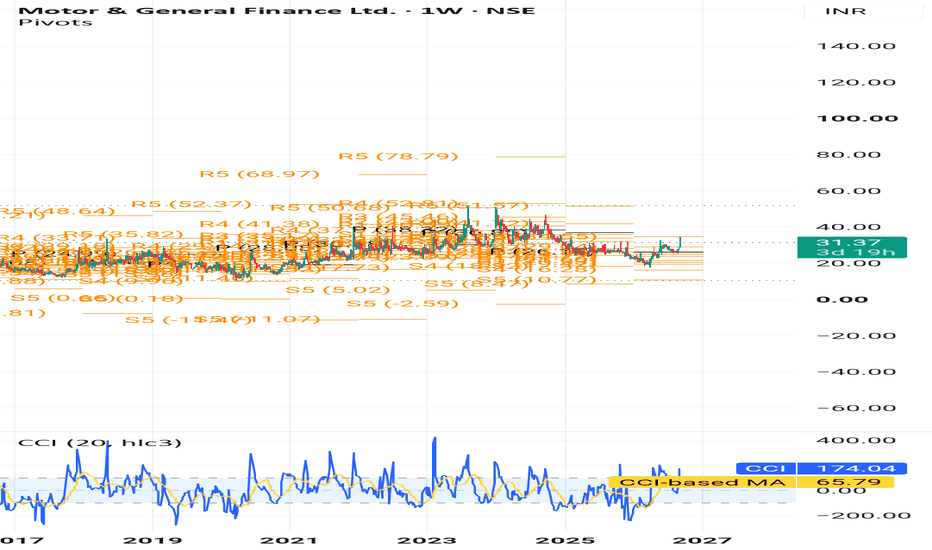
BTR Pro | Swing Trading Study | Tata Motors Passenger Vehicles1-Day Chart Analysis
This chart is a good example of why swing trading requires patience, structure and the ability to stay with a setup over multiple sessions.
On the daily chart, the recent BTR Sell Signal appeared around the ₹340–₹350 zone after price had recovered toward that area. Since then, the stock has continued to move lower, bringing price close to the first reference target.
🔻 Current Swing Setup
BTR Sell Signal: ~₹350
BTR SL / Invalidation: ₹351.55
T1: ₹302.35
T2: ₹277.75
T3: ₹253.15
The current price shown on the chart is around ₹307, which means price has already moved substantially from the signal zone and is now close to T1 at ₹302.35.
🧠 What the Daily Chart Teaches
The interesting part isn't just the downward move.
Look at the sequence:
Signal → Waiting → Price movement → Target zones
On a 1-day timeframe, a swing setup doesn't need constant monitoring every few minutes. The idea is to allow the broader price structure to develop.
This is where patience becomes part of the strategy.
A trader may feel tempted to exit too early after a small pullback, or chase the move after price has already fallen significantly. Both reactions can come from focusing too much on individual candles rather than the overall setup.
The chart provides a simple framework:
🔴 Signal zone — where the setup develops
🛑 Invalidation — where the setup thesis is no longer valid
🎯 Target zones — predefined areas to observe price behaviour
And most importantly:
A signal is not the trade.
The complete process is the trade.
The BTR indicator is only a technical tool for helping structure the chart and identify potential areas of interest. It does not guarantee that a target will be reached or that a setup will work.
For swing trading, I believe the bigger edge comes from combining technical structure + patience + risk management + discipline.
📌 This chart is shared for educational and technical-study purposes only. It is not a buy/sell recommendation, investment advice, or assurance of returns. Market conditions can change and trading/investing involves risk.  Short
Short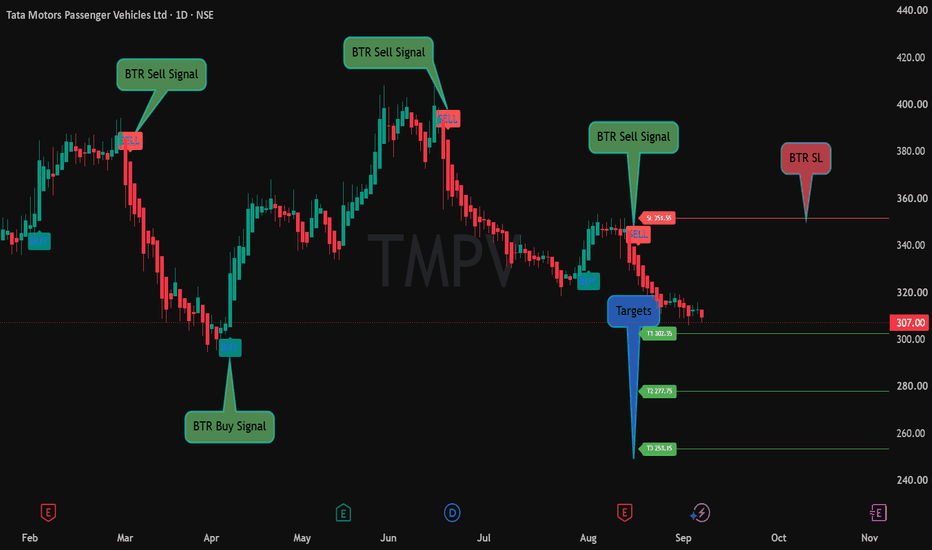
 Long
Long
 Long
Long
SYRMA SGS TECH LTD S/R
Support and Resistance Levels:
Support Levels: These are price points (green line/shade) where a downward trend may be halted due to a concentration of buying interest. Imagine them as a safety net where buyers step in, preventing further decline.
Resistance Levels: Conversely, resistance levels (red line/shade) are where upward trends might stall due to increased selling interest. They act like a ceiling where sellers come in to push prices down.
Breakouts:
Bullish Breakout: When the price moves above resistance, it often indicates strong buying interest and the potential for a continued uptrend. Traders may view this as a signal to buy or hold.
Bearish Breakout: When the price falls below support, it can signal strong selling interest and the potential for a continued downtrend. Traders might see this as a cue to sell or avoid buying.
MA Ribbon (EMA 20, EMA 50, EMA 100, EMA 200) :
Above EMA: If the stock price is above the EMA, it suggests a potential uptrend or bullish momentum.
Below EMA: If the stock price is below the EMA, it indicates a potential downtrend or bearish momentum.
Trendline: A trendline is a straight line drawn on a chart to represent the general direction of a data point set.
Uptrend Line: Drawn by connecting the lows in an upward trend. Indicates that the price is moving higher over time. Acts as a support level, where prices tend to bounce upward.
Downtrend Line: Drawn by connecting the highs in a downward trend. Indicates that the price is moving lower over time. It acts as a resistance level, where prices tend to drop.
Disclaimer:
I am not SEBI registered. The information provided here is for learning purposes only and should not be interpreted as financial advice. Consider the broader market context and consult with a qualified financial advisor before making investment decisions. ZYDUS WELLNESS LTD S/R
Support and Resistance Levels:
Support Levels: These are price points (green line/shade) where a downward trend may be halted due to a concentration of buying interest. Imagine them as a safety net where buyers step in, preventing further decline.
Resistance Levels: Conversely, resistance levels (red line/shade) are where upward trends might stall due to increased selling interest. They act like a ceiling where sellers come in to push prices down.
Breakouts:
Bullish Breakout: When the price moves above resistance, it often indicates strong buying interest and the potential for a continued uptrend. Traders may view this as a signal to buy or hold.
Bearish Breakout: When the price falls below support, it can signal strong selling interest and the potential for a continued downtrend. Traders might see this as a cue to sell or avoid buying.
MA Ribbon (EMA 20, EMA 50, EMA 100, EMA 200) :
Above EMA: If the stock price is above the EMA, it suggests a potential uptrend or bullish momentum.
Below EMA: If the stock price is below the EMA, it indicates a potential downtrend or bearish momentum.
Trendline: A trendline is a straight line drawn on a chart to represent the general direction of a data point set.
Uptrend Line: Drawn by connecting the lows in an upward trend. Indicates that the price is moving higher over time. Acts as a support level, where prices tend to bounce upward.
Downtrend Line: Drawn by connecting the highs in a downward trend. Indicates that the price is moving lower over time. It acts as a resistance level, where prices tend to drop.
Disclaimer:
I am not SEBI registered. The information provided here is for learning purposes only and should not be interpreted as financial advice. Consider the broader market context and consult with a qualified financial advisor before making investment decisions. SBCL: Third base breaking out, stock has nearly tripledStock spent the start of the year in Stage 4. Slow drift lower under falling averages, one failed pop in February, then a final flush down into the April low. Nothing to do through any of that.
April is where it turned. Price came off the low, reclaimed both averages, and then gapped hard through the long term average in late April on the first big volume bar of the move. That was the Stage 4 to Stage 2 handover.
Since then it has built three bases, and each one broke out on a gap.
Base 1 in May, tight range for about three weeks while the short term average caught up. Broke out late May.
Base 2 through June and July, a long one, roughly two months of sideways chop while the rising average worked up through the range and held every pullback. Broke out in early August with a big gap and the largest volume bar on the chart.
Base 3 through August, tighter and shorter, sitting right on top of that gap. Now it is clearing the top of it. Today closed at 1124 after touching 1138.
Three bases, three resolutions, and the stock has gone from roughly 380 to 1120 in five months. Never vertical, always pausing to let the averages catch up.
That is the point of this approach. You do not need to predict anything. Wait for the trend to turn, then take each base as it resolves and let the structure decide when you are wrong.
Valid while the base low holds. Close back inside the August range and I step aside.
Not a recommendation, just sharing what I am watching.  Long
Long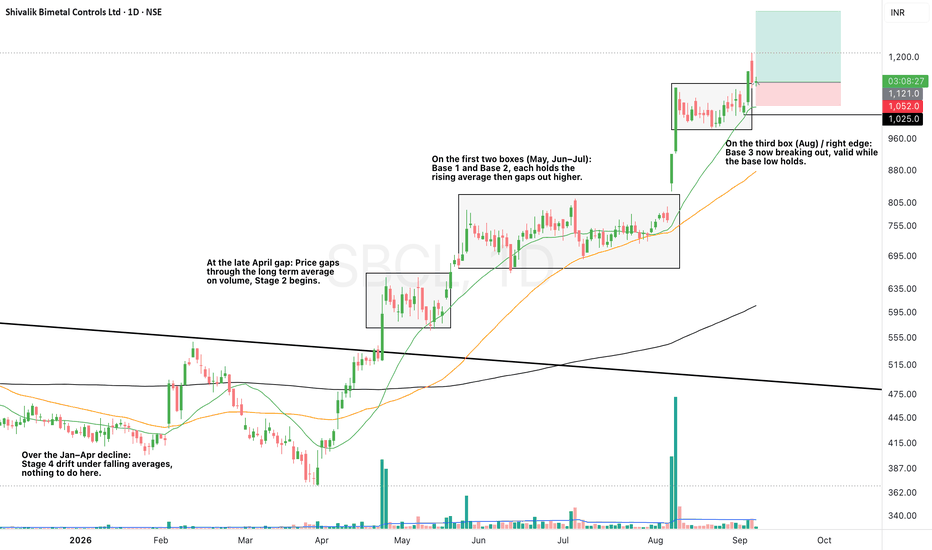
KDDL: Three bases, three breakouts, textbook stair stepStock was in a Stage 4 decline from November through May. Falling averages, a downtrend line off the November high capping everything, price grinding down to the April low. Nothing to do for six months.
Late May is where it changed. Price gapped up through the trendline and both averages on the biggest volume bar on the chart. That gap was the Stage 4 to Stage 2 handover, and it happened in a single session.
After that it has been the same pattern three times.
Base 1 in June, tight range while the short term average caught up from below. Broke out at the end of June.
Base 2 through July, wider, price chopping sideways above the previous breakout level. The average worked up through the range and held every dip. Broke out in early August on volume.
Base 3 through August and into September, again above the previous breakout, one shakeout mid month that got bought back the same day, and now the range is tightening. Today up 1.90%, closed at 3985 near the high of 4025.
Three bases stacked one above the other, none of them broken, and the stock has gone from 2100 to 4000 in four months without ever going vertical.
That is what makes it tradeable. It pauses, it lets the averages catch up, then it goes again.
Watching this third base now. Valid while the base low holds. Close back inside the range and I stand aside.
Not a recommendation, just sharing what I am watching.  Long
Long
RPTECH: Third base setting up after a huge Stage 2 runStock bottomed in September 2025 and started building from there.
First it worked its way up under a falling long term trendline. That line finally broke around December and price moved into the first base, a wide sideways range through January, February and March. Four months of nothing while the moving averages caught up and flattened out. This is the part where most people move on to something else.
Base 1 broke in April. Price ran hard, cleared everything above it, and Stage 2 was confirmed.
Second base came in May and June, short and tight, holding the rising short term average. Broke out in late June with the biggest volume bar on the chart. That was the move that took it from 570 to 800 in a matter of weeks.
Since July it has been building the third base. Wide range, one sharp shakeout in late August that dropped it back to the base low before it recovered, and now price is pushing back toward the top of the range. Today up 3.84%, closed at 855, near the high.
Three bases, each one resolving higher, and the stock has close to tripled from the September low.
The shakeout in August is worth noting. That kind of flush inside a base is normal, it clears out weak hands before the move. What matters is that price recovered and the base low held.
Watching the third base resolution now. Valid while that base low holds. Close back below it and I stand aside.
Not a recommendation, just sharing what I am watching.  Long
Long
RISHABH: Base 2 breaks out, +7.78% on volumePosted this one earlier while it was still sitting in the base. Today it went.
Quick recap of the structure. Stock was in a Stage 4 decline under a falling trendline into August 2025. Broke out of that on a huge volume bar, then went into a base that lasted eight months, roughly August through April. Wide, choppy, plenty of shakeouts in both directions. That is where most people lose interest.
The breakout came in April and May. Price cleared the top of that eight month range and ran without giving much back. Every pullback held the rising short term average.
From July it built the second base, tight and controlled at the highs, right on top of the previous move.
Today it broke out of that base. Up 7.78%, closed at 795.90, near the day's high, and volume expanded on the move. Clean resolution.
Eight months of nothing, then two breakouts in five months. That is how these work. The long base is not wasted time, it is the setup being built. You just have to be there when it resolves and let the structure tell you when.
Now it stays valid while it holds above the base it just left. If price closes back inside the July to September range, the breakout has failed and I am out.
Not a recommendation, just sharing what I am watching.  Long
Long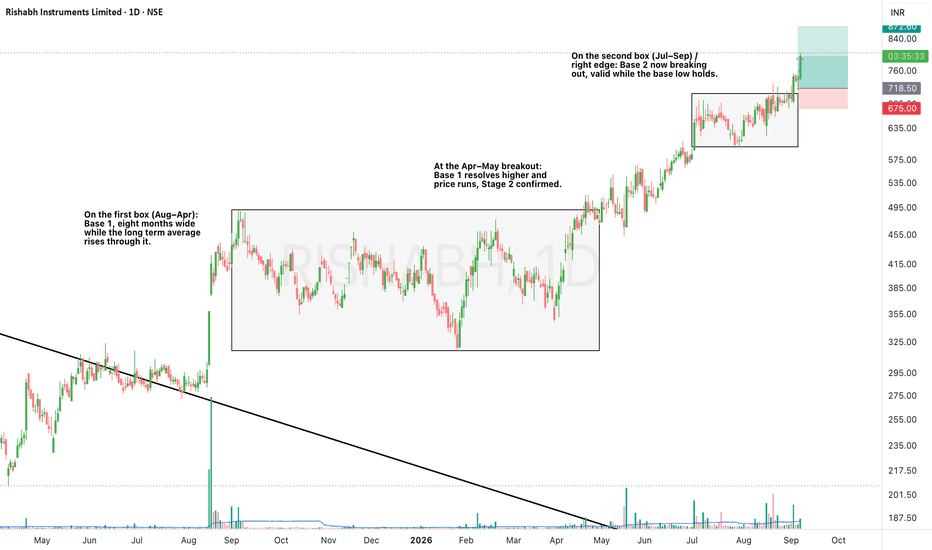
 Long
Long
 Long
Long
 Long
Long
 Long
Long
 Long
Long