Long
Long
 Long
Long
 Short
Short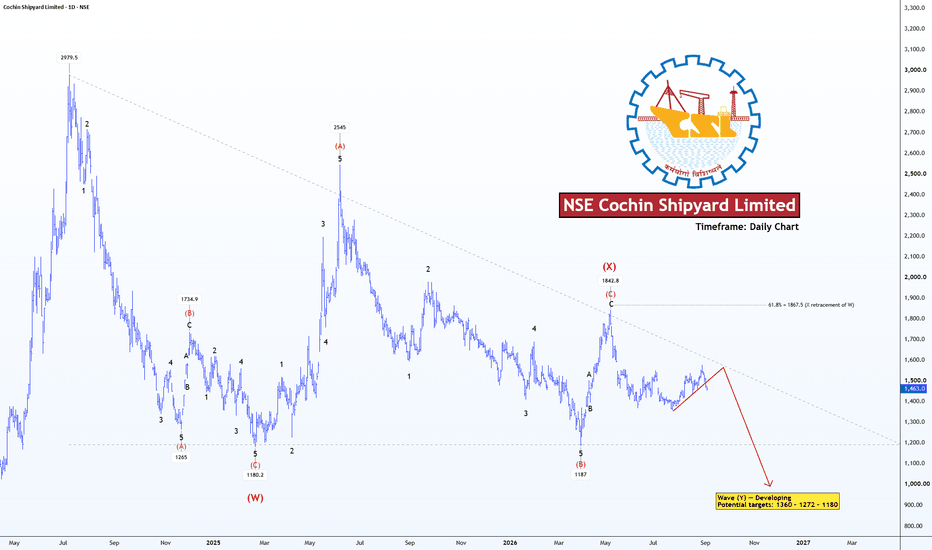
 Long
Long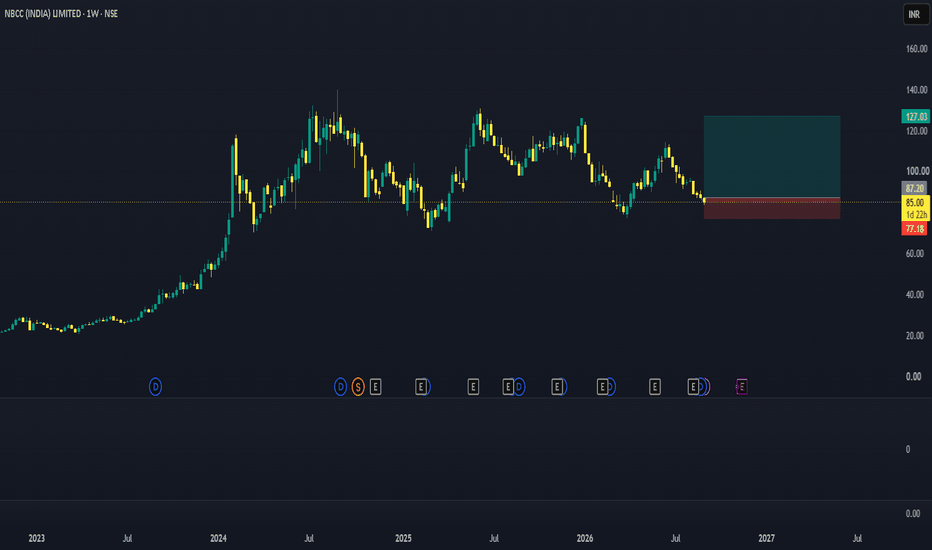
 Long
Long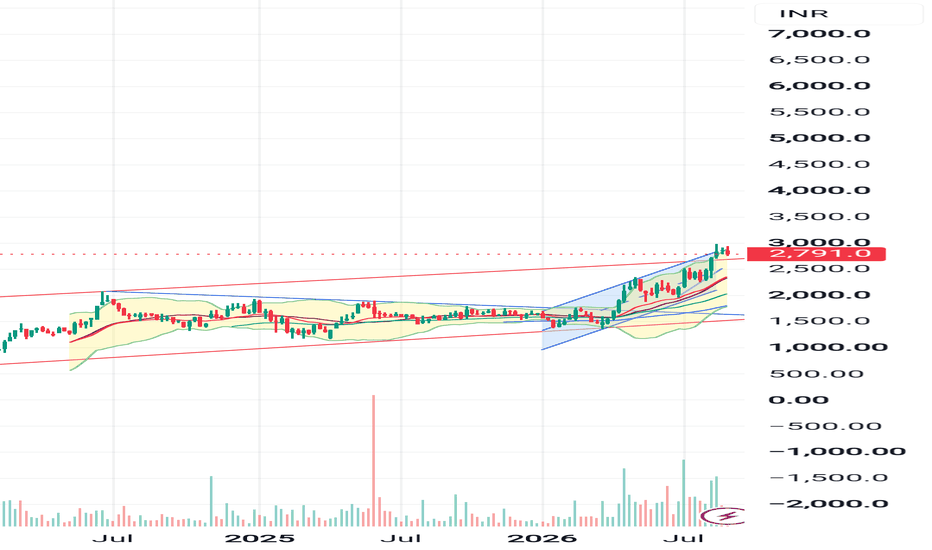
 Long
Long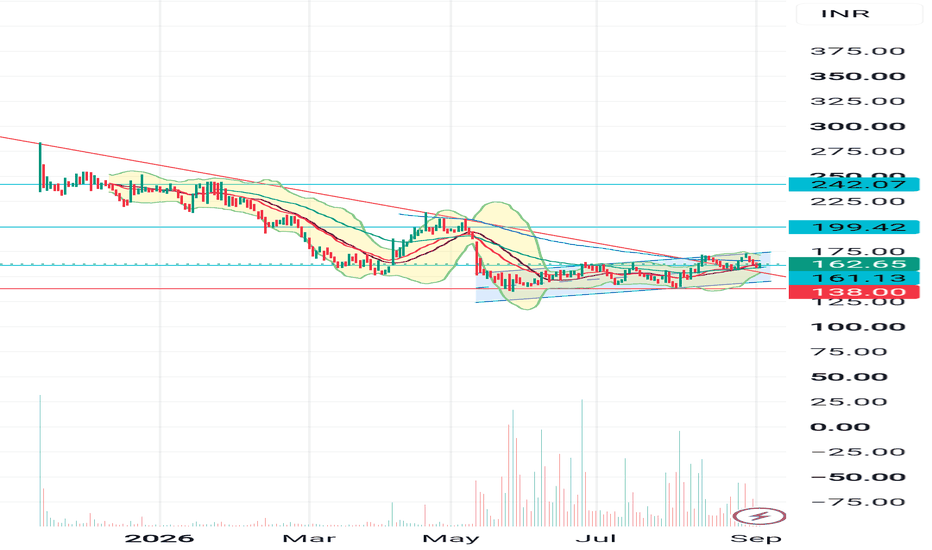
 Long
Long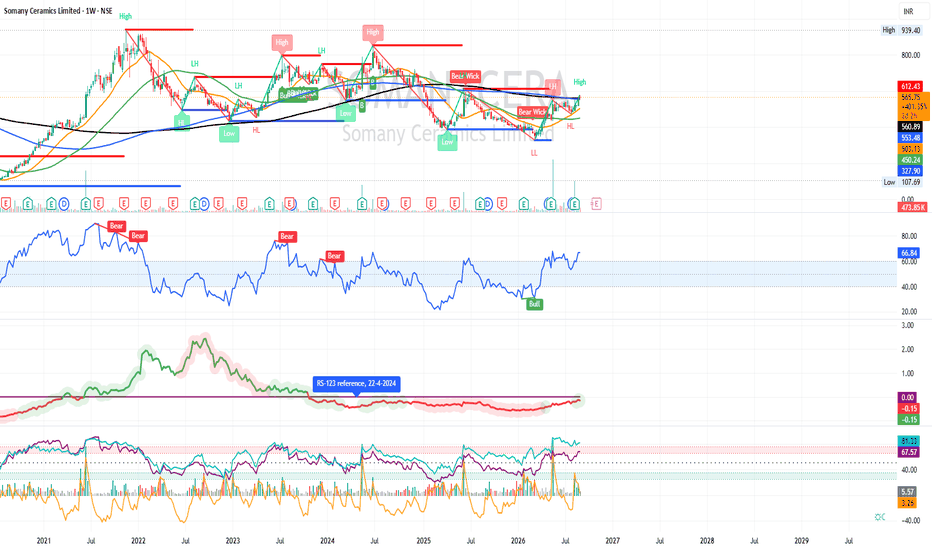
 Long
Long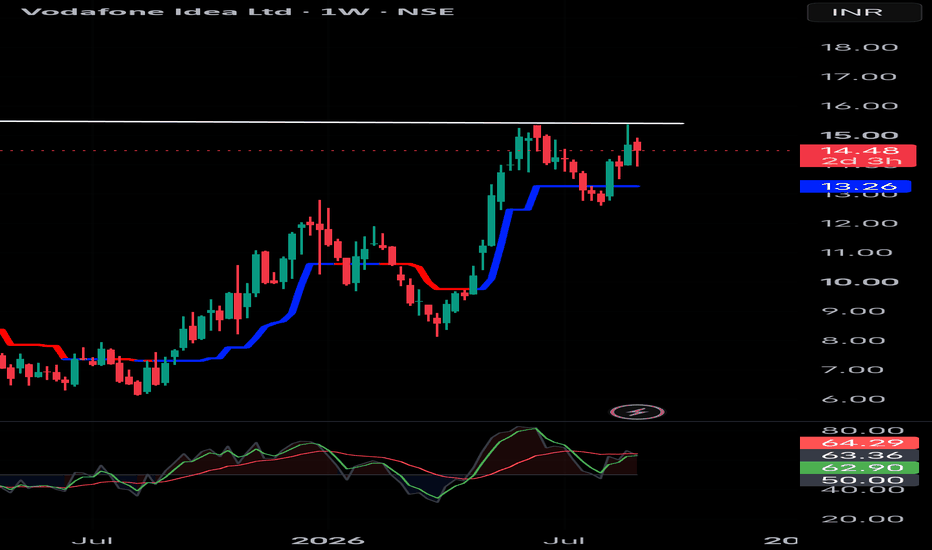
 Long
Long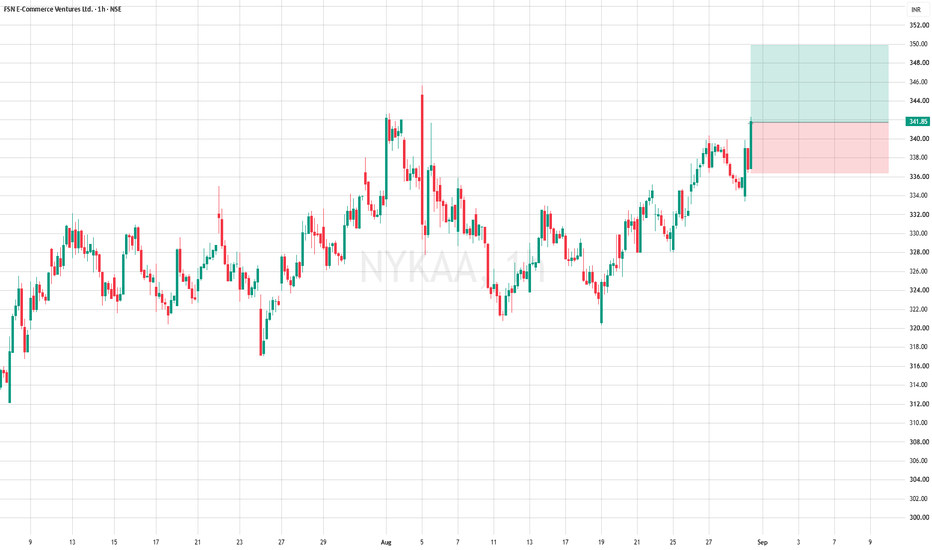
 Short
Short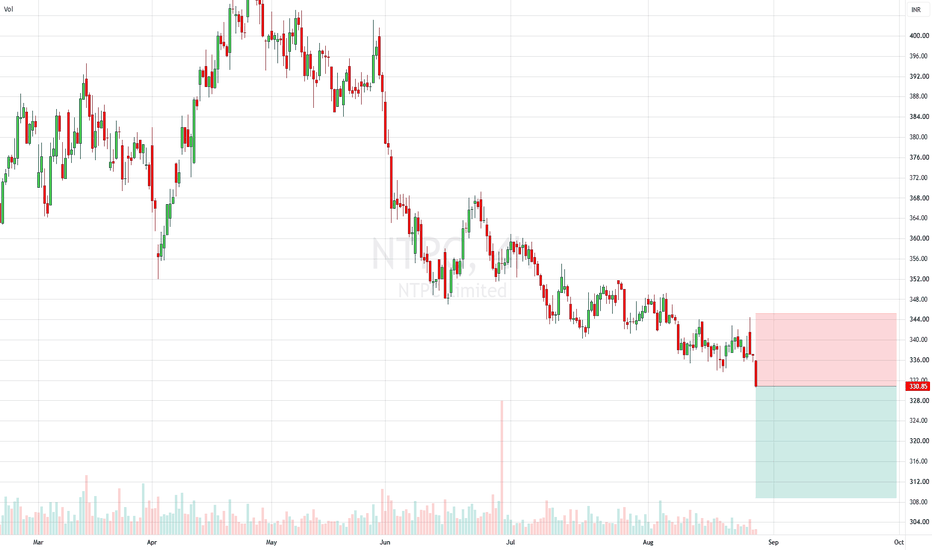
 Long
Long
 Long
Long
ELGI RUBBER## Elgi Rubber Company Ltd. (CMP ₹60.66, NSE: ELGIRUBCO)
**The SmartWay Research Desk | 2 September 2026**
A Coimbatore‑based industrial company, incorporated in 2006. Elgi Rubber manufactures and supplies **retreading materials, rubber products, bonding gum, cushion gum, and allied equipment** for the tire retreading industry. The company operates through subsidiaries in India and overseas, serving both domestic and export markets.
**Promoter Holding (Jun 2026):** **L.G. Balakrishnan & Family — ~74.2% stake (no pledges)**
---
### FY22–FY26 Snapshot
- **Revenue Growth:** FY26 revenue ₹642 Cr vs ₹562 Cr in FY25 (+14.2% YoY). → **Good**
- **Net Profit:** FY26 PAT ₹52 Cr vs ₹44 Cr in FY25 (+18.2% YoY). → **Good**
- **Operating Margin:** FY26 EBITDA ₹112 Cr, margin 17.4% vs 16.6% last year (+80 bps). → **Good**
- **Equity Capital:** Stable, face value ₹1. → **Good**
- **Dividend Policy:** Dividend ₹1.00/share declared for FY26. → **Good**
- **Asset Building:** Investments in **retreading plants, rubber compounding, and export expansion**. → **Good**
- **Sales:** Strong demand from **tire retreading and automotive aftermarket**. → **Good**
- **Expense:** Raw material cost pressures (natural rubber, carbon black) remain. → **Neutral/Good**
- **EPS:** FY26 EPS ₹2.25 vs ₹1.90 last year (+18.4%). → **Good**
---
### Institutional Interest & Ownership Trends (Jun 2026)
- **Promoter Holding:** ~74.2% (no pledges)
- **FII Holding:** ~2.1%
- **DII Holding:** ~3.8%
- **Retail & Others:** ~19.9%
---
### Strategic Moves & Innovations
- Expansion in **retreading materials and equipment exports**.
- Focus on **eco‑friendly rubber recycling and sustainability**.
- Partnerships with **global distributors for aftermarket supplies**.
- Diversification into **industrial rubber products and adhesives**.
---
### Cash Flow & Balance Sheet Strength
- Market cap ~₹420 Cr.
- Debt‑to‑equity ratio ~0.44 (moderate leverage).
- Book value per share ₹32.00; P/B ~1.9.
- EPS (TTM) ₹2.25; P/E ~26.9.
---
### Risk Factors
- Moderate‑high **P/E ratio ~26.9**, valuations slightly expensive.
- Dependence on **automotive aftermarket demand cycles**.
- Exposure to **commodity price volatility (rubber, carbon black)**.
- Competition from Indag Rubber, Midas Rubber, and Elgi Equipments.
---
### Investor Takeaway
Elgi Rubber has delivered **steady FY26 performance**, supported by demand in tire retreading, aftermarket supplies, and export expansion. With strong promoter backing (Balakrishnan Family, 74.2% stake), dividend payouts, and leadership in retreading materials, Elgi Rubber remains a **small‑cap industrial play**. At CMP ₹60.66, valuations are **moderately expensive (P/E ~26.9, P/B ~1.9)**, reflecting growth expectations with manageable risks.  Long
Long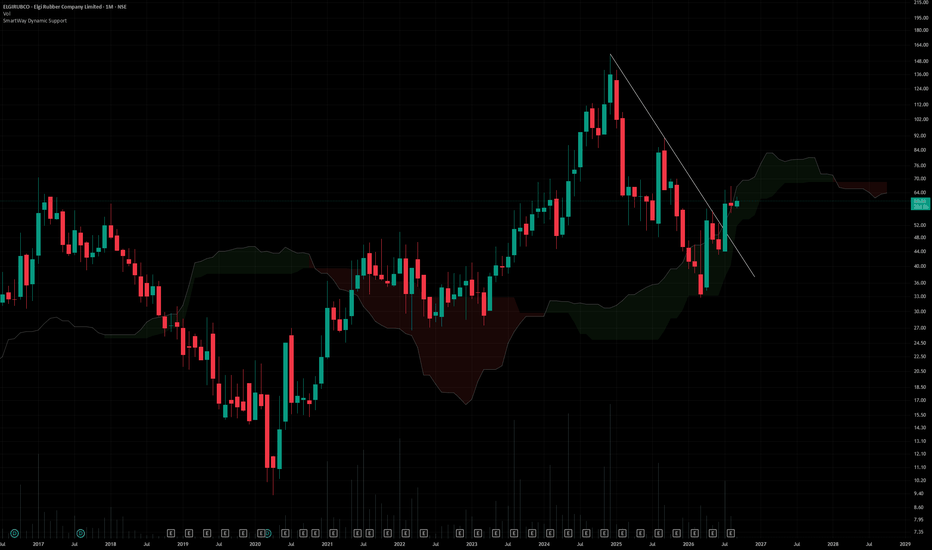
TITAN | Momentum Fades At The Highs — The Discount Is BelowBy analyzing the #TITAN (Titan Company) chart on the 1D timeframe, we can see a market that has done everything right and is now running out of fuel at the wrong place. The uptrend is intact and unbroken, but the last leg arrived at resting liquidity with visibly less force than the legs before it. That combination — structure holding, momentum fading, liquidity overhead — is where patience usually pays better than participation.
1D Timeframe
The trend has been bullish throughout and the sequence is clean. Price swept the sell-side liquidity marked LS $$ in the low ₹3,800s, turned from there, and has printed a series of bullish BOS on the way up — three of them, each one confirming buyers were still setting the terms.
That advance built two distinct regions on the way, and both matter now.
The lower one is the Flip zone at ₹4,224.1 – ₹4,440.1 , created when price broke out of the range in early July. The upper one is the Flip zone at ₹4,527.7 – ₹4,674.9 , formed on the final BOS above ₹4,527.7 in mid-July. Both were resistance on the way up and neither has been retested since.
Beneath them both sits the Order Block at ₹3,961.1 – ₹4,077.0 — the origin of the whole advance — with the Protected Low at ₹3,944.3 directly under it.
Price is currently trading around ₹5,050.0 , sitting just beneath the buy-side liquidity at ₹5,185.0 — the equal highs that have capped this move.
The detail worth noticing: measured across the full leg from ₹3,961.1 to ₹5,185.0, the 0.5 equilibrium sits at roughly ₹4,573 — inside the upper Flip zone. Premium and discount are separated by a level that lands directly on structure, which is not always the case and makes that zone more meaningful than it would be alone.
Since arriving under ₹5,185.0, price has stalled. The candles have compressed, the range has narrowed, and the push that carried it here has not produced a break. Momentum is fading into liquidity rather than through it.
The Bias
The trend is bullish and I am not fighting it. The question is where to participate, and the honest answer is: not here.
Scenario A — the base case.
Price is trading in premium, directly beneath resting liquidity, with declining momentum. My expectation is a retracement before continuation, and the two zones beneath are where that retracement becomes interesting.
The first candidate is the Flip zone at ₹4,527.7 – ₹4,674.9 , which carries the added weight of holding the 0.5 equilibrium at ₹4,573. A reaction there puts price back in discount with structure supporting it.
If the move extends deeper, the second candidate is the Flip zone at ₹4,224.1 – ₹4,440.1 — untested since the breakout and further into discount.
From a reaction at either, the objective is the buy-side liquidity at ₹5,185.0 and the expansion beyond it. That pool is the draw, and it does not disappear because price pulled back to reach it properly.
The reasoning is simple. Buying beneath resting liquidity in premium means paying the highest price available for the same idea. Buying from a flip zone in discount, with the Protected Low defining risk, is the same trade with a fraction of the exposure.
Scenario B — no retracement.
Price may simply break ₹5,185.0 and continue without offering either zone. If that happens, a decisive daily close above it turns those equal highs from resistance into support, and the correct response is to wait for the retest of that level rather than chase the breakout. The trade is still there — it just relocates.
Invalidation. A decisive close beneath the Protected Low at ₹3,944.3 ends the bullish structure. That level sits under the Order Block that started this advance, and below it the sequence of higher lows is broken rather than stretched.
And the rule that governs all of it: a break is a candle close, not a wick. ₹5,185.0 is exactly the kind of level that gets spiked and reclaimed in the same session, and both flip zones are exactly where price wicks in and turns before anyone has time to plan.
Fundamental Backdrop
The business is performing, and the chart reflects a stock that has already priced a lot of it.
Q1 FY27 (June 2026) delivered revenue of ₹20,787 crore with net profit of ₹1,777 crore — up 62.88% year on year and 50.72% on the previous quarter. That follows a March 2026 quarter that was itself up 35.36%. Three consecutive quarters of accelerating profit growth is not a company in trouble, and it explains why the stock has held near its 52-week high at ₹5,168 rather than rolling over.
The counterweight is valuation and input costs. Titan screens as expensive on most quality-and-value frameworks, with technicals rated neutral rather than strong. The jewellery segment — the bulk of revenue through Tanishq and CaratLane — remains directly exposed to gold prices and hedging outcomes, and same-store sales growth is the metric the market watches most closely. Elevated gold prices support ticket value but pressure volumes and margins simultaneously.
Put together: a genuinely strong operator trading at a full valuation, arriving at resting liquidity with slowing momentum. That is not a reason to be bearish. It is a reason to want a better price, which is exactly what the structure beneath is offering.
This analysis will be updated as the market evolves.
Best Regards, BigBeluga 🐳 Jayaswal Neco - Bullish at CMP after 18 yrs breakout!Stock has successfully given breakout above 83 level, after 18 years.
It has also retested in a textbook style and is on the way to going up. Once it crosses the previous high, stock can be in a multi-year uptrend for the next 6-7 years. Target will be 3200-3400 in the next 7 years.
About Fundamentals of the company:
Promoter integrity: mixed and permanently marked. They never sold a share through six loss years and an NCLT filing, accepted 31% equity dilution to ACRE rather than exit, signed personal guarantees, and are subscribing Rs 200 crore of warrants at Rs 89.13.
Against that: MD Ramesh Jayaswal convicted 9 Dec 2024, three-year sentence suspended by the Delhi High Court on 1 Aug 2025 with the appeal live; Rs 307.58 crore of company property under ED attachment with the ED's appeal pending in the Supreme Court; 99.9% of promoter holding pledged to Vistra ITCL.
Balance Sheet: Healthy, and that is the strongest fact in the whole file. Six years ago this company was a solvency case; today secured debt to EBITDA is 1.55 times, the interest bill has halved, an investment grade rating is in place, and the operating cash flow test that most turnaround stories fail is passed convincingly. Rs 1,367 crore of CFO against Rs 463 crore of reported PAT is the signature of real earnings, not manufactured ones. A genuinely repaired balance sheet attached to a promoter file that will never fully clear. A deleveraging trade graduating into a re-rating, not a compounder. Buy it small; the size is the discipline.
Basant Lall Shaw started with a small iron foundry in Nagpur in 1976, shifting the family casting business out of Kolkata. The bet was unglamorous and correct: make the castings India needed, then walk backwards up the supply chain until you own the ore. He got there. A blast furnace at Siltara in 1996, a steel melt shop by 2004, a pellet plant and heavy bar mill by 2014, and by 2023 one hundred percent of iron ore drawn from two captive Chhattisgarh mines leased under the old regime, under 300 km from the plant. That ore is the moat, and it is real.
The trouble was what funded it. The build was financed against captive coal blocks the Supreme Court cancelled in September 2014 and against ore mines that insurgency kept shut for years. Revenue arrived late; interest did not. Reserves fell from Rs 1,579 crore in FY15 to minus Rs 2,001 crore in FY21, and SBI filed at the NCLT in 2018. Eleven banks sold the debt to ACRE, the Bank of America backed reconstruction firm, which restructured Rs 5,661 crore in September 2021 and took roughly 31 percent of the equity for it, diluting shareholders from 63.9 crore shares to 97.1 crore. That is the promoter integrity record in one line: they did not run, they did not sell a share, they signed personal guarantees, and they handed a third of the company to a creditor to keep the gates open.
 Long
Long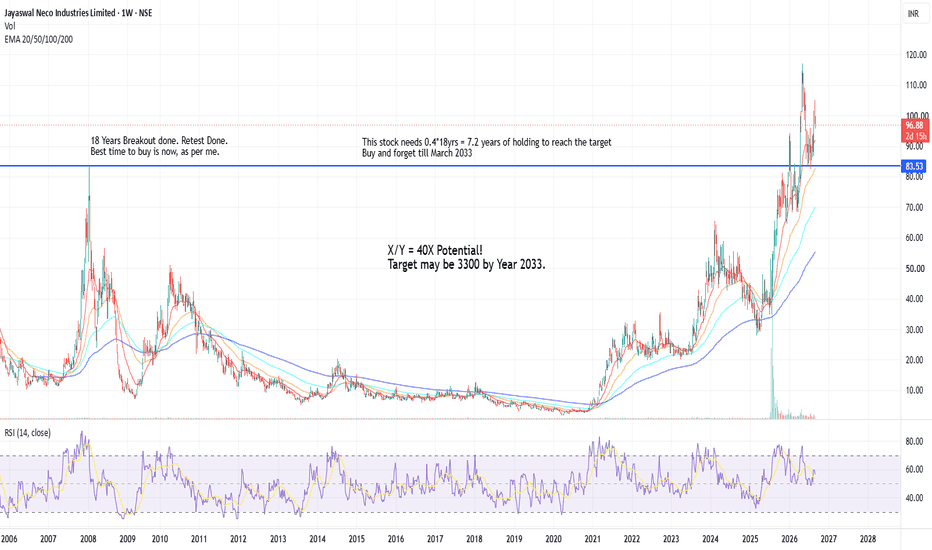
 Long
Long
Syncom Formulations💊 STOCK TO WATCH 💊
₹20 → ₹58 👀
A small-cap pharma name appearing on my Weekly R4 Momentum Breakout Scanner.
Syncom Formulations (India) Ltd.
📌 Buy Zone: ₹20
📌 Breakout Zone: ₹20
🛑 Stop Loss: ₹12
🎯 Target: ₹58
Why Syncom Formulations?
💊 Pharma formulations business: Syncom manufactures and markets 500+ pharmaceutical products across tablets, capsules, injections, liquids, ophthalmics, creams, gels and other dosage forms.
🌍 Export-oriented platform: The company has an international presence across around 25 countries, with more than 400 products registered overseas.
🏭 WHO-GMP manufacturing: Its Pithampur facility is WHO-GMP and ISO 9001-2015 certified, supporting its domestic and international formulation business.
📈 Q1 FY27 operating momentum: Revenue was ₹125.53 Cr, up 7.38% YoY, while operating profit increased 65.78% YoY to ₹26.21 Cr. PBT grew 58.99% YoY.
Why It Caught My Attention
✅ 65%+ YoY operating-profit growth
✅ 59%+ YoY PBT growth
✅ 500+ product portfolio
✅ WHO-GMP manufacturing facility
✅ Presence across ~25 countries
✅ Domestic + export business
🔥 Weekly R4 Momentum Breakout
⚠️ HIGH RISK – HIGH REWARD SETUP. The ₹12 level is the defined stop-loss. With a very large target relative to the entry, disciplined position sizing is critical.
Risk Defined. Reward Visible.
📢 Disclaimer: This content is for educational purposes only and not investment advice. Please do your own due diligence before making any investment decisions.
© 20K Microcap Investing | R4 Momentum Desk
#SyncomFormulations #SYNCOMF #PharmaStocks #PharmaceuticalStocks #SmallCapStocks #HealthcareStocks #PharmaIndia #StockMarketIndia #IndianStocks #StocksToWatch #R4Breakout #MomentumInvesting #20KMicrocap  Long
Long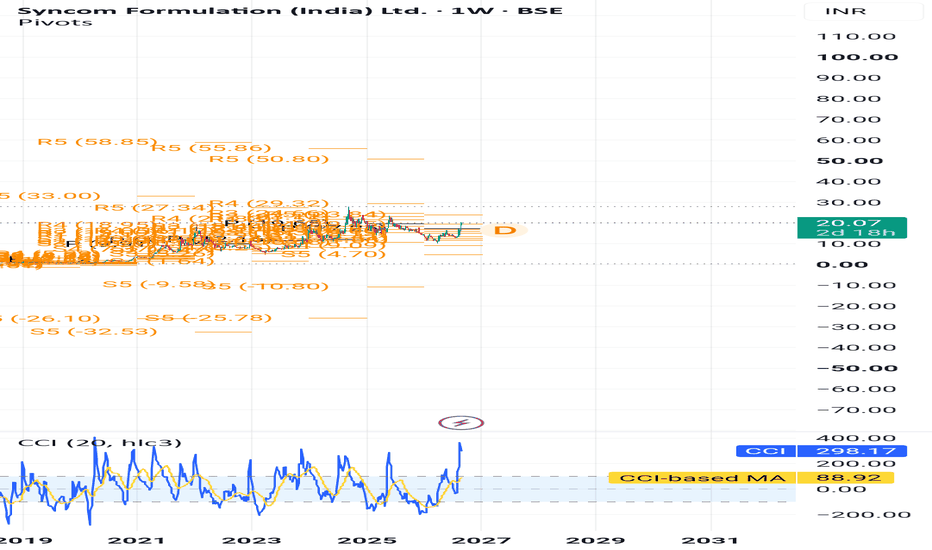
 Long
Long
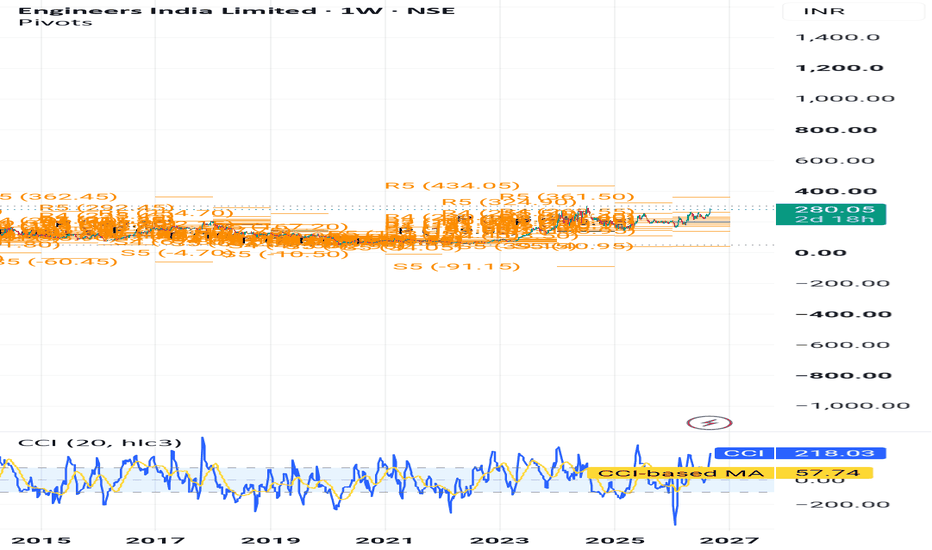
Engineers India🏗️ STOCK TO WATCH 🏗️
₹265–275 → ₹434 👀
A strong engineering & infrastructure play appearing on my Weekly R4 Momentum Breakout Scanner.
Engineers India Ltd.
📌 Buy Zone: ₹265–275
📌 Breakout Zone: ₹265
🛑 Stop Loss: ₹199
🎯 Target: ₹434
Why Engineers India?
🏗️ Engineering & consultancy specialist: EIL provides engineering, consultancy and project-management services across energy and infrastructure sectors.
📈 Strong Q1 FY27 profitability: Standalone PAT rose 55% YoY to ₹109 Cr, while PBT also increased 55% to ₹145 Cr.
🔥 Margin expansion: EBITDA reached ₹155.44 Cr, with EBITDA margin improving to 18.55% from 11.72% YoY; operating margin was around 14%.
📚 Huge order book: EIL's order book stood at ₹14,424 Cr as of June 30, 2026, comprising ₹10,498 Cr consultancy and ₹3,926 Cr turnkey projects.
⚛️ New growth opportunities: Management is targeting opportunities across traditional energy, energy transition, nuclear, infrastructure and emerging technologies, while aiming for ₹8,000 Cr of order inflows in FY27.
Why It Caught My Attention
✅ 55% YoY PAT growth
✅ 55% YoY PBT growth
✅ EBITDA margin expanded sharply
✅ ₹14,424 Cr order book
✅ Strong consultancy business
✅ Energy + infrastructure exposure
✅ Nuclear & energy-transition opportunity
🔥 Weekly R4 Momentum Breakout
⚠️ Key point: Q1 revenue declined 6.6% YoY to ₹800.9 Cr, mainly because turnkey revenue fell, although higher-margin consultancy revenue increased strongly. The sustainability of order execution and consultancy-led margin expansion will be important to watch.
Risk Defined. Reward Visible.
📢 Disclaimer: This content is for educational purposes only and not investment advice. Please do your own due diligence before making any investment decisions.
© 20K Microcap Investing | R4 Momentum Desk
#EngineersIndia #ENGINERSIN #EIL #EngineeringStocks #InfrastructureStocks #PSUStocks #EnergyStocks #NuclearStocks #StockMarketIndia #IndianStocks #StocksToWatch #R4Breakout #MomentumInvesting #20KMicrocap  Long
Long