Long
Long
 Long
Long
 Long
Long
 Long
Long
 Long
Long
Long 
 Long
Long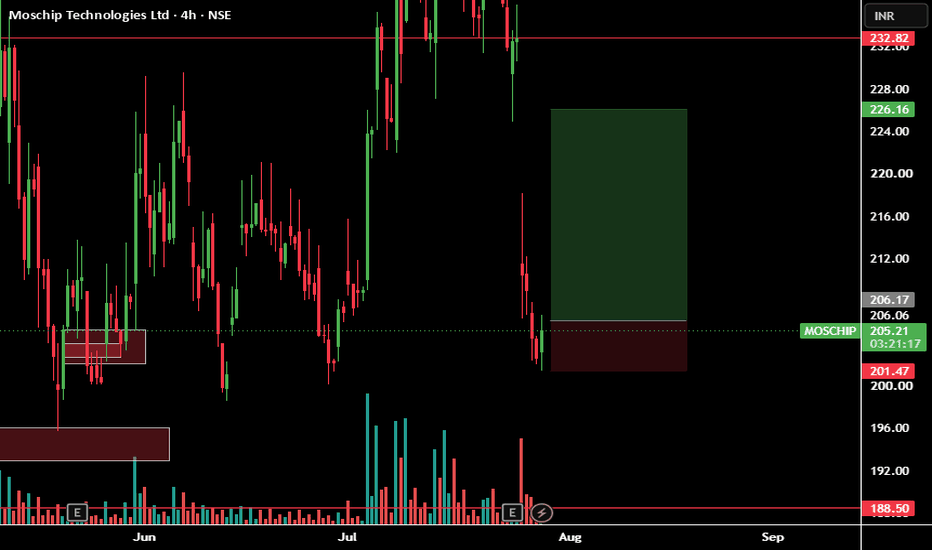
 Long
Long
DATA PATTERNS INDIA LTD S/R
Support and Resistance Levels:
Support Levels: These are price points (green line/shade) where a downward trend may be halted due to a concentration of buying interest. Imagine them as a safety net where buyers step in, preventing further decline.
Resistance Levels: Conversely, resistance levels (red line/shade) are where upward trends might stall due to increased selling interest. They act like a ceiling where sellers come in to push prices down.
Breakouts:
Bullish Breakout: When the price moves above resistance, it often indicates strong buying interest and the potential for a continued uptrend. Traders may view this as a signal to buy or hold.
Bearish Breakout: When the price falls below support, it can signal strong selling interest and the potential for a continued downtrend. Traders might see this as a cue to sell or avoid buying.
MA Ribbon (EMA 20, EMA 50, EMA 100, EMA 200) :
Above EMA: If the stock price is above the EMA, it suggests a potential uptrend or bullish momentum.
Below EMA: If the stock price is below the EMA, it indicates a potential downtrend or bearish momentum.
Trendline: A trendline is a straight line drawn on a chart to represent the general direction of a data point set.
Uptrend Line: Drawn by connecting the lows in an upward trend. Indicates that the price is moving higher over time. Acts as a support level, where prices tend to bounce upward.
Downtrend Line: Drawn by connecting the highs in a downward trend. Indicates that the price is moving lower over time. It acts as a resistance level, where prices tend to drop.
Disclaimer:
I am not SEBI registered. The information provided here is for learning purposes only and should not be interpreted as financial advice. Consider the broader market context and consult with a qualified financial advisor before making investment decisions.  Long
Long
 Long
Long
 Long
Long
NMDC STEEL LTD S/R
Support and Resistance Levels:
Support Levels: These are price points (green line/shade) where a downward trend may be halted due to a concentration of buying interest. Imagine them as a safety net where buyers step in, preventing further decline.
Resistance Levels: Conversely, resistance levels (red line/shade) are where upward trends might stall due to increased selling interest. They act like a ceiling where sellers come in to push prices down.
Breakouts:
Bullish Breakout: When the price moves above resistance, it often indicates strong buying interest and the potential for a continued uptrend. Traders may view this as a signal to buy or hold.
Bearish Breakout: When the price falls below support, it can signal strong selling interest and the potential for a continued downtrend. Traders might see this as a cue to sell or avoid buying.
MA Ribbon (EMA 20, EMA 50, EMA 100, EMA 200) :
Above EMA: If the stock price is above the EMA, it suggests a potential uptrend or bullish momentum.
Below EMA: If the stock price is below the EMA, it indicates a potential downtrend or bearish momentum.
Trendline: A trendline is a straight line drawn on a chart to represent the general direction of a data point set.
Uptrend Line: Drawn by connecting the lows in an upward trend. Indicates that the price is moving higher over time. Acts as a support level, where prices tend to bounce upward.
Downtrend Line: Drawn by connecting the highs in a downward trend. Indicates that the price is moving lower over time. It acts as a resistance level, where prices tend to drop.
Disclaimer:
I am not SEBI registered. The information provided here is for learning purposes only and should not be interpreted as financial advice. Consider the broader market context and consult with a qualified financial advisor before making investment decisions. KIRLOSKAR OIL ENGINES LTD S/R
Support and Resistance Levels:
Support Levels: These are price points (green line/shade) where a downward trend may be halted due to a concentration of buying interest. Imagine them as a safety net where buyers step in, preventing further decline.
Resistance Levels: Conversely, resistance levels (red line/shade) are where upward trends might stall due to increased selling interest. They act like a ceiling where sellers come in to push prices down.
Breakouts:
Bullish Breakout: When the price moves above resistance, it often indicates strong buying interest and the potential for a continued uptrend. Traders may view this as a signal to buy or hold.
Bearish Breakout: When the price falls below support, it can signal strong selling interest and the potential for a continued downtrend. Traders might see this as a cue to sell or avoid buying.
MA Ribbon (EMA 20, EMA 50, EMA 100, EMA 200) :
Above EMA: If the stock price is above the EMA, it suggests a potential uptrend or bullish momentum.
Below EMA: If the stock price is below the EMA, it indicates a potential downtrend or bearish momentum.
Trendline: A trendline is a straight line drawn on a chart to represent the general direction of a data point set.
Uptrend Line: Drawn by connecting the lows in an upward trend. Indicates that the price is moving higher over time. Acts as a support level, where prices tend to bounce upward.
Downtrend Line: Drawn by connecting the highs in a downward trend. Indicates that the price is moving lower over time. It acts as a resistance level, where prices tend to drop.
Disclaimer:
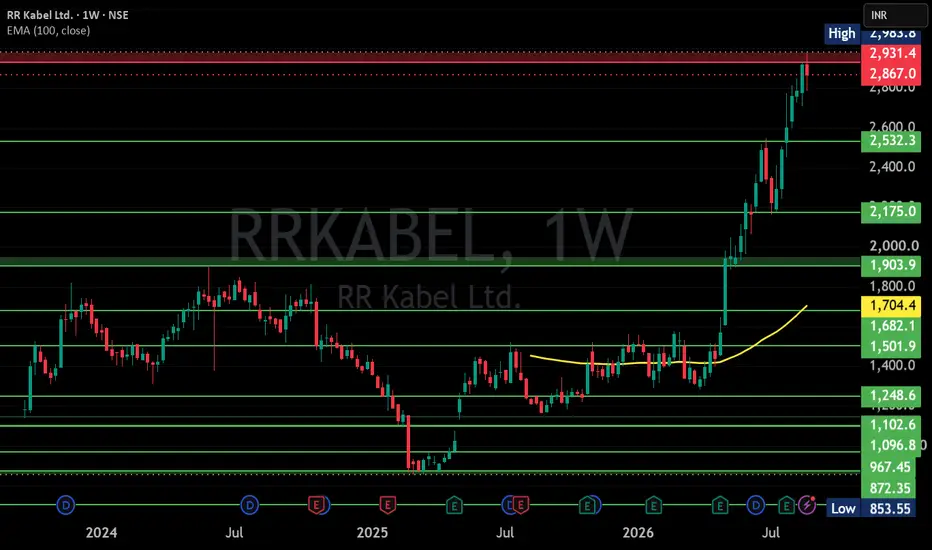
I am not SEBI registered. The information provided here is for learning purposes only and should not be interpreted as financial advice. Consider the broader market context and consult with a qualified financial advisor before making investment decisions. RRKABEL S/R
Support and Resistance Levels:
Support Levels: These are price points (green line/shade) where a downward trend may be halted due to a concentration of buying interest. Imagine them as a safety net where buyers step in, preventing further decline.
Resistance Levels: Conversely, resistance levels (red line/shade) are where upward trends might stall due to increased selling interest. They act like a ceiling where sellers come in to push prices down.
Breakouts:
Bullish Breakout: When the price moves above resistance, it often indicates strong buying interest and the potential for a continued uptrend. Traders may view this as a signal to buy or hold.
Bearish Breakout: When the price falls below support, it can signal strong selling interest and the potential for a continued downtrend. Traders might see this as a cue to sell or avoid buying.
MA Ribbon (EMA 20, EMA 50, EMA 100, EMA 200) :
Above EMA: If the stock price is above the EMA, it suggests a potential uptrend or bullish momentum.
Below EMA: If the stock price is below the EMA, it indicates a potential downtrend or bearish momentum.
Trendline: A trendline is a straight line drawn on a chart to represent the general direction of a data point set.
Uptrend Line: Drawn by connecting the lows in an upward trend. Indicates that the price is moving higher over time. Acts as a support level, where prices tend to bounce upward.
Downtrend Line: Drawn by connecting the highs in a downward trend. Indicates that the price is moving lower over time. It acts as a resistance level, where prices tend to drop.
Disclaimer:
I am not SEBI registered. The information provided here is for learning purposes only and should not be interpreted as financial advice. Consider the broader market context and consult with a qualified financial advisor before making investment decisions. TRAVELFOOD S/R
Support and Resistance Levels:
Support Levels: These are price points (green line/shade) where a downward trend may be halted due to a concentration of buying interest. Imagine them as a safety net where buyers step in, preventing further decline.
Resistance Levels: Conversely, resistance levels (red line/shade) are where upward trends might stall due to increased selling interest. They act like a ceiling where sellers come in to push prices down.
Breakouts:
Bullish Breakout: When the price moves above resistance, it often indicates strong buying interest and the potential for a continued uptrend. Traders may view this as a signal to buy or hold.
Bearish Breakout: When the price falls below support, it can signal strong selling interest and the potential for a continued downtrend. Traders might see this as a cue to sell or avoid buying.
MA Ribbon (EMA 20, EMA 50, EMA 100, EMA 200) :
Above EMA: If the stock price is above the EMA, it suggests a potential uptrend or bullish momentum.
Below EMA: If the stock price is below the EMA, it indicates a potential downtrend or bearish momentum.
Trendline: A trendline is a straight line drawn on a chart to represent the general direction of a data point set.
Uptrend Line: Drawn by connecting the lows in an upward trend. Indicates that the price is moving higher over time. Acts as a support level, where prices tend to bounce upward.
Downtrend Line: Drawn by connecting the highs in a downward trend. Indicates that the price is moving lower over time. It acts as a resistance level, where prices tend to drop.
Disclaimer:
I am not SEBI registered. The information provided here is for learning purposes only and should not be interpreted as financial advice. Consider the broader market context and consult with a qualified financial advisor before making investment decisions.  Long
Long
Laurus Labs: Momentum Meets GrowthLaurus Labs Ltd. is showing a strong combination of improving fundamentals and bullish price structure. The stock is trading around ₹1,887 in the chart shared, with a decisive move toward the ₹1,895 breakout level. A sustained close above this level could strengthen the bullish setup.
Fundamental Strength
Laurus Labs operates across API, formulations, CDMO and biotechnology, with CDMO becoming an increasingly important growth driver. FY26 was a strong turnaround year, with revenue rising 23% and profitability expanding sharply.
Key Financial Ratios
P/E: ~89–92x
P/B: ~17–18x
ROE: ~18%
ROCE: ~18–19%
Debt-to-Equity: ~0.45x
Net Debt/EBITDA: ~1.18x
Current Ratio: ~1.33x
Dividend Yield: ~0.1%
The ROE and ROCE recovery is a major positive, while debt-to-equity has improved significantly from previous years. However, the current valuation is demanding and leaves limited room for earnings disappointments.
Financial Performance
FY26 showed a significant improvement:
Revenue: ₹6,813 Cr — +23% YoY
EBITDA: ₹1,826 Cr — +64% YoY
EBITDA Margin: 26.8%
PAT: ₹889 Cr — +148% YoY
Operating Cash Flow: ₹1,624 Cr
Net Worth: ₹5,300 Cr
The improvement was driven by better business mix, CDMO growth, operating leverage and stronger utilisation of manufacturing assets.
Q1 FY27 Momentum
The latest quarter continued the positive trend:
Revenue: ₹2,026 Cr
EBITDA: ₹644 Cr
EBITDA Margin: 31.8%
This indicates that the margin expansion seen during FY26 has continued into FY27.
Balance Sheet & Financial Stability
Laurus Labs' balance sheet has strengthened considerably.
Net worth increased to ₹5,300 Cr from ₹4,473 Cr.
Debt-equity improved to 0.45x from 0.60x.
ROCE improved to 17.7% from 9.7%.
ROE improved to 17% from 8%.
Operating cash flow of ₹1,624 Cr provides strong internal funding capacity.
The company is also investing heavily in capacity expansion, with FY26 capex of ₹1,070 Cr, supporting future CDMO, peptide, fermentation and other high-value opportunities.
Technical Outlook
The chart shows a strong uptrend followed by a short consolidation. The latest candle is attempting to break above the ₹1,895 level.
Key Levels
📌 Current Price: ₹1,887
📌 Breakout Confirmation: Close above ₹1,895
📌 Resistance R1: ₹1,960
📌 Resistance R2: ₹2,015
📌 Resistance R3: ₹2,110
📌 Reversal Zone: ₹1,790–₹1,811
A sustained close above ₹1,895 could strengthen the breakout and bring ₹1,960 → ₹2,015 → ₹2,110 into focus.
The ₹1,790–₹1,811 reversal zone is the key support area to watch if the stock experiences a pullback.
Techno-Fundamental View
Bullish factors:
Strong FY26 revenue and PAT growth
Significant EBITDA margin expansion
CDMO business growing rapidly
ROE and ROCE recovery
Improving debt-equity ratio
Strong operating cash flow
Continued investment in high-value pharmaceutical capabilities
Positive Q1 FY27 momentum
Key concern:
Valuation is very demanding, with P/E around 90x and P/B around 18x at recent prices.
Fundamental Rating — Out of 5
Business Strength: 4.5/5
Financial Stability: 4.3/5
Profitability: 4.5/5
Growth Potential: 4.7/5
Valuation: 2.5/5
Overall Fundamental Rating: 4.1/5
Final View
Laurus Labs presents a strong techno-fundamental setup, backed by accelerating earnings, improving returns, stronger cash generation and a rapidly expanding CDMO franchise.
From the technical perspective, ₹1,895 is the key breakout trigger. A sustained close above it could open the path toward ₹1,960, ₹2,015 and ₹2,110.
₹1,790–₹1,811 remains the crucial reversal/support zone.
Overall View: Bullish above ₹1,895, but valuation remains the key risk.
ANISHFNK21
Follow
Disclaimer
The information and publications are not meant to be, and do not constitute, financial, investment, trading, or other types of advice or recommendations supplied or endorsed by TradingView. Read more in the Terms
Disclaimer: aliceblueonline.com Piramal Finance: Breakout Mode ON?Piramal Finance Ltd. is showing a strong technical setup after breaking above its recent ₹2,170–₹2,220 consolidation range. The stock is currently around ₹2,221, and the breakout comes against a backdrop of improving profitability, strong AUM growth and stable asset quality.
Fundamental Strength
Piramal Finance has been steadily transforming into a retail-focused NBFC. Its AUM crossed ₹1 lakh crore in FY26, while the growth portfolio accounted for 97% of total AUM. FY26 consolidated PAT increased 210% YoY to ₹1,506 crore, supported by stronger margins and improving operating efficiency.
Key Financial Ratios
P/E: ~29.5x
P/B: ~1.76x
ROE: ~5.5%
ROA: ~1.5%
Debt-to-Equity: ~2.86x
The valuation is no longer deeply discounted, but the improving earnings trajectory and quality of the loan book provide a reasonable growth story.
Latest Business Momentum
Q1 FY27 further strengthened the fundamental picture:
PAT: ₹461 crore, up 67% YoY
AUM: ~₹1.07 lakh crore, up 25% YoY
Retail AUM: ₹91,249 crore, up 32% YoY
Consolidated NIM: 6.5%
GNPA: 2.4%
NNPA: 1.6%
Retail disbursements increased 44% YoY.
The company has also received strong domestic debt ratings, with Crisil, ICRA and Care at AA+, while maintaining substantial liquidity.
Balance Sheet & Financial Stability
The balance sheet has expanded significantly, with shareholders' equity at about ₹28,191 crore in FY26. Total assets stood at roughly ₹1.11 lakh crore.
The key positive is the continued shift away from the legacy book toward the higher-growth retail franchise. However, leverage remains an inherent feature of the NBFC business, so asset quality and funding costs need to be monitored closely.
Technical Outlook
The chart shows a Range Breakout after several Days of consolidation.
Key Levels
📌 Breakout Range: ₹2,170–₹2,220
📌 Breakout Confirmation: Close above ₹2,277
📌 Resistance R1: ₹2,436
📌 Resistance R2: ₹2,574
📌 Reversal Zone: ₹2,035–₹2,080
A sustained close above ₹2,277 could strengthen the breakout and open the way toward ₹2,436 and ₹2,574. The ₹2,035–₹2,080 zone remains the key demand area during any meaningful correction.
Techno-Fundamental View
The setup combines:
Strong AUM growth
67% YoY Q1 FY27 PAT growth
Improving NIM
Stable asset quality
Increasing retail contribution
Stronger credit ratings
Range breakout on the technical chart
The primary risk remains valuation and leverage, particularly if credit costs or funding costs rise.
Fundamental Ratings — Out of 5
Business Strength: 4.3/5
Financial Stability: 4.2/5
Profitability: 4.0/5
Valuation: 3.7/5
Growth Potential: 4.5/5
Overall Fundamental Rating: 4.1/5
Investment View
Bullish above ₹2,277. Sustained price action above this level could bring ₹2,436 and ₹2,574 into focus.
On the downside, ₹2,035–₹2,080 remains the important reversal zone.
Conclusion: Piramal Finance is combining strong retail AUM growth, improving profitability and stable asset quality with a fresh technical breakout. A sustained move above ₹2,277 could signal the beginning of the next leg of the uptrend.
Disclaimer: aliceblueonline.com Kennametal's Rally Has More Fuel?Kennametal India Ltd. has entered a strong bullish phase after a sharp upmove from the ₹2,700–₹2,800 zone. The stock is currently around ₹3,527, and the chart structure continues to show strong momentum. The company’s latest financial performance also supports the bullish view, with FY26 revenue growth and improving profitability providing a solid fundamental backdrop.
Fundamental Strength
Kennametal India manufactures advanced cutting tools, hard-metal products and machine-tool solutions, serving industries including automotive, aerospace, defence, infrastructure and general engineering. It is a 75% subsidiary of Kennametal Inc.
Key Financial Ratios
P/E: ~45.8x
P/B: ~7.9x
ROE: ~13.9%
ROCE: ~19%
Dividend Yield: ~1.4%
EPS: ~₹63
Debt-to-Equity: Effectively zero / debt-free
The valuation is premium, but the company has a strong balance sheet and established industrial franchise.
Financial Performance
Kennametal India generated approximately ₹1,357 crore of TTM revenue and ₹139 crore of TTM net profit, with earnings showing strong improvement.
For FY25, revenue from operations was ₹1,170.3 crore and PBT was ₹140.2 crore. The company's FY26 quarterly numbers subsequently showed continued momentum, including strong March-quarter revenue of approximately ₹403 crore.
Balance Sheet & Stability
Debt-free balance sheet is a major positive.
Net worth remains strong relative to liabilities.
Operating cash flow has improved, with recent annual data showing approximately ₹144.8 crore of operating cash flow.
The company maintains a healthy dividend payout.
Strong parentage from Kennametal Inc. provides technological and global business support.
Technical Outlook
The chart shows a strong higher-high, higher-low structure, with the recent rally taking the stock sharply above its previous consolidation range.
Key Technical Levels
📌 Current Price: ₹3,513
📌 Reversal Zone: ₹3,094–₹3,304
📌 Resistance R1: ₹3,975
📌 Resistance R2: ₹4,597
📌 Resistance R3: ₹5,135
The ₹3,094–₹3,304 reversal zone is the key demand area. A sustained move above this zone keeps the bullish structure intact, while a decisive breakout above ₹3,975 could open the way toward the higher resistance levels.
Techno-Fundamental View
Kennametal India's setup combines:
Strong price momentum
Debt-free balance sheet
Improving earnings
ROCE around 19%
Established industrial and engineering franchise
Exposure to automotive, aerospace, defence and infrastructure
Consistent dividend distribution
The major concern is valuation. At around 45–46x earnings and nearly 8x book value, the stock is not cheap, so continued earnings growth will be important to justify further re-rating.
Fundamental Ratings — Out of 5
Business Strength: 4.5/5
Financial Stability: 4.7/5
Profitability: 4.0/5
Valuation: 3.2/5
Growth Potential: 4.2/5
Overall Fundamental Rating: 4.1/5
Techno-Fundamental View
Bullish above ₹3,304. A sustained move above ₹3,975 could strengthen the momentum and bring ₹4,597 and ₹5,135 into focus. On the downside, ₹3,094–₹3,304 remains the key reversal/accumulation zone.
Conclusion: Kennametal India presents a strong combination of technical momentum, debt-free financials and improving earnings, although its premium valuation warrants monitoring. If the current momentum sustains, the stock could remain on the radar for the next leg toward the projected resistance levels.
Disclaimer: aliceblueonline.com