Angel One: The Ceiling That Became the FloorHello Friends, Welcome to RK_Chaarts
Today we are looking into example chart of Angel One Limited to understand how Resistance Turns Into Support. This post is for Educational purpose only and not any trade idea.
Look at this chart. A falling trendline held price down multiple times - Jan 2024, Dec 2024 and June 2025. Every time price came close to this line, it got rejected.
Then in April 2026, price finally broke above this trendline. And something interesting happened after that. The same line that acted as resistance for two years is now acting as support. Price has come back to test it, and it is holding.
This is not just one signal. A few more things are lining up here.
The Weekly 50 EMA is also sitting right at this same support zone. So we have the old trendline and the moving average both giving support at the same place.
On the Daily chart, RSI is showing bullish divergence. Price made a lower low, but RSI made a higher low. This usually means selling pressure is slowing down, even if price does not show it yet.
So right now we have three things together – old resistance turned support, Weekly 50 EMA, and Daily RSI divergence. All pointing to the same zone.
This is a good example of how a broken resistance level can become support later. Watch how price behaves around this zone in the coming weeks.
This post is for education only. It is not a buy or sell recommendation. Please do your own research or consult a SEBI registered advisor before making any trading decision.
I am not Sebi registered analyst. My studies are for educational purpose only.
Please Consult your financial advisor before trading or investing. I am not responsible for any kinds of your profits and your losses.
Most investors treat trading as a hobby because they have a full-time job doing something else.
However, If you treat trading like a business, it will pay you like a business.
If you treat like a hobby, hobbies don't pay, they cost you...!
Hope this post is helpful to community
Thanks
RK💕
Disclaimer and Risk Warning.
The analysis and discussion provided on in.tradingview.com is intended for educational purposes only and should not be relied upon for trading decisions. RK_Chaarts is not an investment adviser and the information provided here should not be taken as professional investment advice. Before buying or selling any investments, securities, or precious metals, it is recommended that you conduct your own due diligence. RK_Chaarts does not share in your profits and will not take responsibility for any losses you may incur. So Please Consult your financial advisor before trading or investing.
Tata Motors — Sellers Targeting 250 as Downtrend Extends📉 Tata Motors — Sellers Maintaining Control
Tata Motors is currently displaying a clear bearish structure, with price already moving lower and the selling pressure showing signs of further continuation. The recent price action indicates that sellers remain firmly in control, while bullish attempts are struggling to produce a meaningful recovery.
The ongoing decline suggests that the market may continue its downward trajectory, with 250 standing out as the next major projected downside objective. As long as the bearish structure remains intact, further weakness can remain on the table.
The projected path is straightforward:
Current price action → continued selling pressure → deeper downside movement → 250 target zone.
From a technical perspective, the market is respecting the bearish sequence, with lower price levels becoming increasingly vulnerable as selling momentum develops. Rather than treating the current decline as an isolated move, the broader structure points toward a continuation of weakness.
The 250 area is therefore the key downside destination in this setup. A sustained bearish structure would keep the selling bias active as price works toward that level.
The broader fundamental backdrop can also influence Tata Motors through automobile-sector demand, company-specific developments, input costs, interest-rate expectations, and overall Indian equity-market sentiment. These factors may affect the speed and volatility of the move, while the technical structure remains the primary roadmap.
📍 Market Bias: Bearish
📉 Current Direction: Selling
🎯 Projected Target: 250
⚡ Structure: Bearish continuation
The market is already moving in the projected direction — and the chart suggests there may be considerably more downside before the sellers complete this move.  Short
Short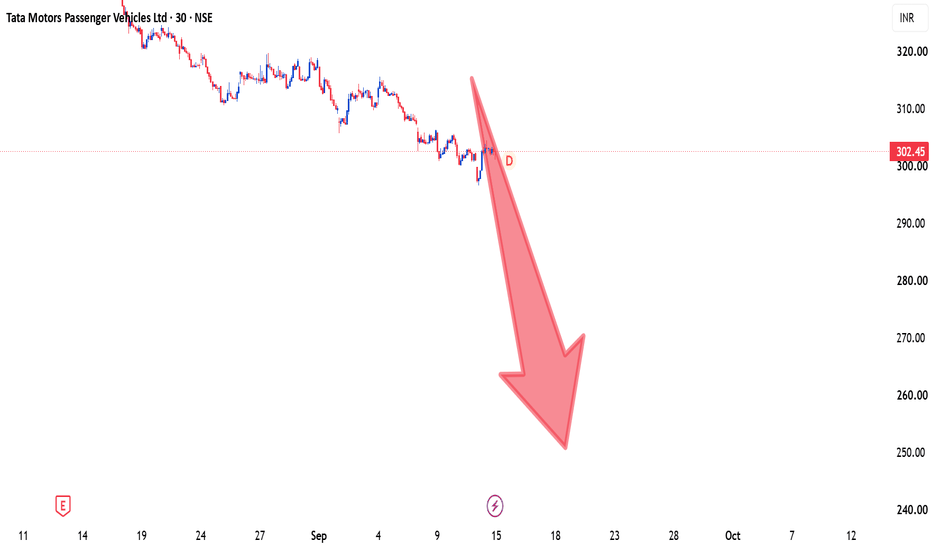
Reliance Industries — Pullback First, Then Upside ContinuationReliance is currently showing a setup where price may first experience a corrective move toward the 1237 area before the broader bullish structure resumes.
From a technical perspective, the current price action suggests that the market may need to retrace lower and revisit the 1237 region before establishing the next meaningful upward leg. This downside move can be viewed as a corrective phase within the larger structure rather than an immediate indication of a sustained bearish trend.
The 1237 level remains the key area to monitor. If price reaches this zone and the broader structure remains intact, the setup could transition back toward the buying side, opening the path for a recovery toward the 1330 target area.
The projected roadmap is therefore straightforward:
Current structure → downside move toward 1237 → bullish transition → upside expansion toward 1330.
The important factor here is not simply the direction of the next candle, but the overall sequence of the move. A temporary decline toward the lower level can create the foundation for the next bullish phase, with 1330 remaining the major upside objective.
From a broader market perspective, Reliance can also remain sensitive to developments across the Indian equity market, sector sentiment, crude-oil dynamics, currency movements, and expectations surrounding corporate earnings and growth. These factors can influence the pace of the projected move, while the technical structure provides the primary roadmap for this setup.
The analysis is built around a defined price path rather than chasing short-term fluctuations. 1237 remains the key downside level, while 1330 represents the projected bullish destination.
📍 Key Downside Level: 1237
🎯 Projected Upside Target: 1330
📊 Bias: Bearish correction → Bullish continuation
📈 Preferred Direction: Buy-side expansion after the projected pullback
A structured setup, clearly defined levels, and a roadmap that keeps the focus on price rather than noise.  Long
Long
 Long
Long
 Long
Long
 Long
Long
 Long
Long
 Long
Long
 Long
Long
MARUTI SUZUKI (NSE: MARUTI)— Chartology & 12-Month Macro outlookChartology & Structural Context
Multi-Year Inverse Head & Shoulders: The long-term weekly chart features a massive Inverse Head & Shoulders base breakout above the ₹9,124 neckline established between 2018–2023.
Measured Macro Targets:
Linear Target: ₹14,500 (already achieved during the recent impulse leg).
Logarithmic Target: 22,000+ (pointing toward significant multi-year upside expansion).
Current Phase (Consolidation): Following a test of the ₹17,197 all-time high, price is currently pulling back into the ₹13,500 – ₹14,500 structural support region.
The stock is building a re-accumulation base, making this an ideal high-level watch for the next structural leg up.
Key Fundamental Drivers (Next 12 Months)
EV Transition (eVX Rollout): Maruti is entering the EV space with its flagship eVX mid-size electric SUV (offering a ~500 km range platform).
Localized battery manufacturing in Gujarat positions them to capture EV market share while maintaining gross margins.
Production Capacity Expansion: The brand recorded an all-time high output of over 23.4 lakh units in FY26. The rollout of the new Kharkhoda, Haryana facility and upcoming Gujarat expansions will add significant annual capacity to serve domestic and export demand.
Export Volume Aggression: With parent Suzuki Motor Corporation utilizing India as its primary global manufacturing hub, Maruti is targeting 400,000+ export units annually, providing a foreign exchange hedge and revenue diversification.
SUV Dominance & Premiumization: Shifts toward higher-margin Utility Vehicles (Fronx, Grand Vitara, Brezza, Victoris) continue to improve average selling prices (ASP) and operating margins relative to entry-level hatchbacks.
This is a structural macro thesis rather than an immediate order trigger.
You could wait for a lower-timeframe consolidation base around the ₹13,500–₹14,000 zone before defining precise risk parameters for the run toward ₹17,200 and ultimate ₹22,000 log targets. On the flip side We could see a strong spurt to ₹15,000 to signal the next bull run.  Long
Long
COFORGE: Why ₹2,000 Is Supply Absorption, Not a Structural TopRetail investors often panic when a stock retests a major round-number resistance like ₹2,000 multiple times, calling it a dangerous "Triple Top" or "Quadruple Top." But institutional money knows the reality: the more times a level is tested without a major breakdown, the weaker that ceiling becomes!
Coforge isn't suffering from distribution—big smart money is systematically absorbing every single share being dumped under ₹2,020 to build massive long positions before the next explosive trend.
Why the ₹2,000 Ceiling Will Break
Classic Supply Absorption: Instead of crashing, Coforge has printed continuous higher lows off its ₹1,005 base, tightly coiling into an ascending handle directly beneath the ₹2,021 all-time high. Dips are being bought up aggressively!
20-Year Sector Dominance: Plotting the COFORGE / CNXIT ratio reveals that Coforge has consistently outpaced the Nifty IT index for two decades. Institutional capital rotates into Coforge because it generates real sector-leading alpha.
Boardroom Headlines are Just Noise: The media panic surrounding recent board transitions caused temporary retail selling, but major institutional brokerages (including CLSA, Nuvama, and Motilal Oswal) confirmed the core business operations and growth fundamentals remain 100% intact.
Clear Fibonacci Target Levels 📈
A clean weekly closing candle above ₹2,021.2 clears out the remaining overhead limit sell orders, unlocking clear air toward these key Fibonacci extensions:
Target 1: ₹2,588.3 (Immediate Expansion Zone)
Target 2: ₹3,569.5 (1.618 Macro Fib Expansion)
Target 3: ₹4,546.7 (2.618 Macro Trend Target)
Unstoppable Fundamental Engine ⚙️
Game-Changing Encora Acquisition: The $2.39 Billion deal—the largest digital engineering transaction in Indian IT history—brought global private equity power Advent International aboard as a 21% anchor shareholder.
Massive Order Book Visibility: Executable 12-month order backlog expanded over 44% to a record $2.23 Billion, providing multi-year earnings safety.
86%+ AI & Digital Mix: High-margin AI engineering, cloud, and data services dominate revenues, completely insulating Coforge from low-margin legacy IT displacement.
Don't let short-term retail fear trap you out of a classic institutional setup. The multi-touch compression under ₹2,000 is coiling energy for an aggressive macro expansion toward those upper Fibonacci targets! 💎🙌  Long
Long
 Long
Long
Thermax - Keep on your watchlist THERMAX — Technical View
CMP: ₹3,682
Trend: 🔴 Bearish
Strong correction from ₹5,278; price remains below both falling trendlines.
RSI: ~40 on weekly / ~31 on daily → weak, though daily is near oversold.
Key levels
🟢 Support: ₹3,550–3,600
Next support: ₹3,200–3,300
🔴 Resistance: ₹3,800–4,000
Major resistance: ₹4,350–4,450
Targets if ₹3,550 breaks: ₹3,300 → ₹3,000
Bullish reversal only above: ₹4,000, preferably with volume.
My view: 🔴 SHORT / AVOID
At ₹3,682, I would not take a fresh long. The risk-reward improves only after a confirmed breakout above ₹4,000.
Technical rating: 6.0/10
Bottom line: SHORT bias below ₹4,000; avoid aggressive shorting near ₹3,550 support. A decisive break of ₹3,550 would make the bearish setup considerably stronger.  Long
Long
 Long
Long
Price Is Back at the Same 3-Factor Zone. Coincidence or Pattern?Hello Friends, Welcome to RK_Chaarts
Today we are looking into chart of BSE Ltd for Educational Purpose only:
Price Is Back at the Same 3-Factor Zone. Coincidence or Pattern?
Look at this chart closely. Three things are lining up together right now on BSE Ltd:
Price is sitting on the lower line of a long rising channel.
Price is close to the Weekly 50 EMA.
RSI has dropped into the 40-45 zone.
This is not the first time. It has happened four times before – July 2024, March 2025, September 2025, and January 2026. Every single time, the same three things came together, and price moved up from there.
Now it is happening again in September 2026.
Is this a coincidence ? Or is this a pattern the market keeps repeating ?
I am not saying "buy" or "sell" here. This post is only to show you how confluence works. One signal alone means very little. But when price structure, a moving average, and momentum all point to the same zone at the same time, it becomes worth watching closely.
A simple rule I follow – one signal can be noise. Three signals together are rarely noise.
I am not Sebi registered analyst. My studies are for educational purpose only.
Please Consult your financial advisor before trading or investing. I am not responsible for any kinds of your profits and your losses.
Most investors treat trading as a hobby because they have a full-time job doing something else.
However, If you treat trading like a business, it will pay you like a business.
If you treat like a hobby, hobbies don't pay, they cost you...!
Hope this post is helpful to community
Thanks
RK💕
Disclaimer and Risk Warning.
The analysis and discussion provided on in.tradingview.com is intended for educational purposes only and should not be relied upon for trading decisions. RK_Chaarts is not an investment adviser and the information provided here should not be taken as professional investment advice. Before buying or selling any investments, securities, or precious metals, it is recommended that you conduct your own due diligence. RK_Chaarts does not share in your profits and will not take responsibility for any losses you may incur. So Please Consult your financial advisor before trading or investing.
Education 
CIPLA | Bearish Reversal Setup — Channel Break Targets The Liqui
By analyzing the 🇮🇳 #CIPLA (Cipla) chart on the 4H timeframe, we can see that the stock is showing early signs of a bearish reversal after a corrective rally into a key supply area. The structure is coiling, and a break of the rising channel would confirm the next move lower.
📊 4H Timeframe
On the 4H, the story starts with an external CHoCH that broke the prior bullish structure and shifted the higher-timeframe character to bearish. From the lows, price then began a corrective rally back up — and along the way it built internal bullish structure (an i CHoCH, followed by i BOS and another i BOS) as it climbed inside a rising channel.
That corrective rally carried price straight into the Flip Zone ( ₹1,475.70 – ₹1,539.45 ) — the former support that now acts as resistance — where it executed a Liquidity Sweep, running the stops above before stalling.
This is the classic setup for a reversal: a corrective rally into a flip zone, a liquidity grab, and now price rolling over. Price is currently trading around ₹1,419.50 . The key structural level to watch is the Internal Protected Low at ₹1,342.75 — as long as it holds, the internal bullish channel is still technically alive, but a decisive break below it (together with a break of the rising channel) confirms the bearish leg and opens the path down toward the sell-side liquidity (SSL) resting at ₹1,167.05 .
🎯 The Bias
My base case leans bearish, but it's conditional on confirmation. Price has rejected from the Flip Zone after a liquidity sweep — a clean bearish signal — but the internal structure won't be broken until price closes below the Internal Protected Low (₹1,342.75) and breaks the rising channel. On that trigger, the draw is toward the SSL at ₹1,167.05. In my view, as long as price stays capped below the Flip Zone (₹1,475.70 – ₹1,539.45), the rejection favours the sellers — but if buyers reclaim that zone with a decisive close, the bearish idea is invalidated and the corrective rally could extend higher within the channel.
📰 Fundamental Backdrop
The technical setup arrives right before a major catalyst. Cipla's board meets on July 23, 2026 to approve its Q1 FY27 results, with an earnings call the same day — flagged across the sector as a key volatility trigger for pharma. The fundamental backdrop is genuinely constructive: Cipla just posted its highest-ever annual revenue of ₹28,000 crore for FY26, with the India business crossing ₹12,500 crore (up 9% YoY) and North America delivering $780 million, and its regulatory picture is improving after the Pithampur Unit 1 received a favorable VAI status from the USFDA — de-risking future US filings. Analysts are broadly positive (consensus "Buy," average target around ₹1,457), and the company is pushing its 'One-India' strategy and complex US generics as growth levers. But there are real risks to respect: US generic pricing pressure persists, margins are expected to hold in a 23–25% range rather than expand, and pharma stocks have historically shown sharp post-earnings swings — Cipla itself has dropped 6%+ on disappointing prints before. Net-net: the fundamentals are solid, but the July 23 result is a binary event that could easily trigger the exact channel break the chart is setting up — making risk management essential into the print.
This analysis will be updated as the market evolves. If this breakdown added value, drop a like 👍 and a comment 💬 to support the work — and share where you see Cipla heading next! Best Regards, BigBeluga 🐳 ADANIPORTS - Bullish Reversal Setup | RSI DivergenceHello traders, let's break down the current market structure for Adani Ports & Special Economic Zone Ltd (ADANIPORTS) on the 125-minute timeframe.
After a sharp corrective decline toward the 1,640 level, the stock is showing clear structural signs of a bullish reversal. Price action has begun consolidating, and buying interest is re-emerging at the lows.
Key Technical Observations :
Bullish RSI Divergence: While price printed lower lows toward the 1,640.4 mark, the 14-period RSI formed clear higher lows, signaling a momentum shift from sellers to buyers.
Volume Contraction on Second Leg Down: Notably, during the second leg of the downward move, there was a clear fall in volume. This drop in volume indicates that selling pressure is drying up and sellers are losing strength, heavily supporting our reversal thesis.
Base Formation & Supply Absorption: Price is attempting to form a bottom and is currently pushing toward the local supply/consolidation ceiling marked by the horizontal dotted lines.
Breakout Trigger: The horizontal dotted lines around 1,715–1,720 mark the key structural pivot. A decisive breakout above this zone will confirm the trend reversal and shift the short-term structure to bullish.
Trade Setup (Long):
Entry: Initiate a long position only on a sustained candle close above the marked dotted line (~1,720).
Stop Loss (SL) : Place a strict SL below the base support / recent swing low at 1,640.
Target 1: 1,800 (Intermediate swing resistance).
Target 2: 1,890 (Retest of previous major highs).
Trade Psychology & Risk Management:
Key Takeaway: Patience is the foundation of high-probability trading. Do not front-run the setup while the price is still consolidating under resistance. Wait for price to convincingly clear the marked dotted line at 1,720 with healthy volume to ensure buyers have taken full command. Always adhere strictly to your predefined stop loss to manage downside risk.
What is your outlook on ADANIPORTS? Are you anticipating a strong bounce towards the previous highs, or do you expect further consolidation? Let’s discuss in the comments!
Disclaimer: This analysis is strictly for educational purposes and does not constitute financial advice. Always perform your own research and manage risk responsibly.  Long
Long
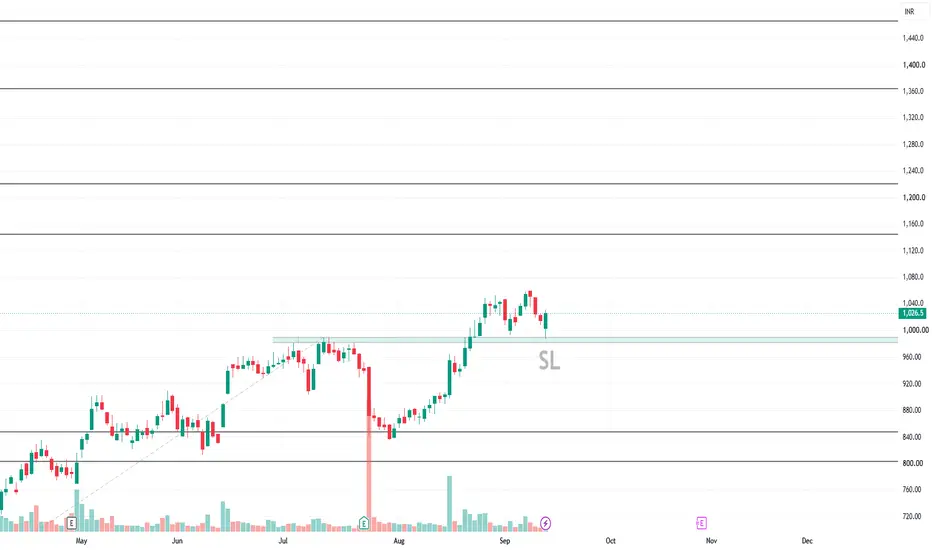
HINDALCO - Long SetupHello traders, let's look at the current technical structure for Hindalco Industries Limited (HINDALCO) on the 125-minute timeframe.
After a strong rally of over 16% driven by solid QoQ and YoY earnings performance, the stock touched a high of 1,088 before entering a swift corrective pullback. The price recently tested a low of 1,021.4 and is now showing signs of stabilizing at key demand confluence.
Key Technical Observations:
Fibonacci Retracement Confluence: Based on backtested parameters focusing on institutional retracement zones (0.618 and 0.79), the stock is reacting directly off the 0.618 Fibonacci level (~1,022).
Role Reversal (Resistance-Turned-Support): The current support zone precisely overlaps with previous structural resistance levels (marked with dashed lines), creating a high-probability demand floor.
Favorable Risk-to-Reward: Following the sharp correction from 1,088, the current consolidation offers an asymmetric entry with minimal downside risk against a substantial upside target.
Trade Plan (Long)
Entry Zone: 1,025 – 1,030 (Accumulation within the Fib support band)
Stop Loss (SL): 1,015 / 1010 (Strict invalidation below the 0.618 Fib support level)
Target: 1,088 – 1,090 (Retest of the recent swing high)
Risk-to-Reward (R:R):~1:4+
Trade Psychology & Risk Management:
When buying corrective pullbacks in an established uptrend, discipline is key. **Avoid chasing the price and let the price come into our planned trading range of 1,025 – 1,030 so that the Risk-to-Reward remains heavily in our favor.** Never enter out of FOMO; execute only where downside risk is clearly defined and protected by major support confluence. Keep your position sizing aligned with your risk tolerance and always respect your hard stop loss at 1,015.
What is your outlook on HINDALCO? Do you expect the rally to resume towards fresh highs, or will it test the lower 0.79 Fib zone first? Let’s hear your thoughts in the comments!
Disclaimer: This analysis is strictly for educational purposes and does not constitute a trade idea or financial advice. Investment in the stock market is subject to market risks.*  Long
Long