• Products
  • Community
  • Markets
  • Brokers
  • More
Get started
  • Markets
  • /India
  • /Stocks
  • /Ideas
ROUNDING BOTTOM IN AKUMS DRUGS--EDUCATIONAL PURPOSEStock corrected from high 1176 (Aug 2024) to low 405 in Apr 2025 (-65%) correction in 9-10 months. After that stock entered consolidation phase and was hovering in the range of 623 to 415. This week stock crossed the previous resistance succesfully and closed at 622.90. Significant increase in volume is also seen in addition to higher high higher low structure which gives strength to this upward movement on weekly chart. Long position can be inititated on correction till 595-600. We expect stock to become 4x in coming 10 years. TARGET : 2718( 351%) (FIBO LEVELS) STOPLOSS : 500 (-17%) ON WEEKLY CLOSING BASIS RR RATIO : 1:20 TIME HORIZON : 10 YEARS ( TILL JUNE 2036) ONLY FOR LONG TERM INVESTMENT VIEW--10 YEARS CAUTION : NOT MUCH DATA IS AVAILABLE ON CHART AS IT LISTED IN AUGUST 2024
NSE:AKUMSLong
by mgvirus1
BULLISH VIEW IN LLOYD METALS -- EDUCATIONAL PURPOSEIn April 2026 breakout above 52 week high is seen and it sustained for about 2 months. Now stock is trying to make higher high higher low structure above the breakout level which is strong upward momentum signal on daily chart. Buy position can be initiated once the stock crosses today high 1775. We expect the rally to continue and extend it till 2736 (Fibo Level) TARGET : 2736 (54%) STOP LOSS : BELOW 1636 (-8%)(ON WEEKLY CLOSING BASIS) RISK REWARD RATIO : 1:7.8 TIME HORIZON : 2 YEARS ( TILL JUNE 2028) ONLY FOR INVESTMENT PURPOSE, NOT FOR SHORT TERM TRADING
NSE:LLOYDSMELong
by mgvirus1
INOX India: Cryogenic King Breaking Out!Bullish Drivers for Stock price gains: Infrastructure Super-Cycle: As a leader in cryogenic equipment, INOX is the primary beneficiary of India’s massive push toward Green Hydrogen and LNG adoption. Massive Breakout: The daily chart shows a clean exit from a long-term Consolidation phase, signalling the start of a new impulsive leg upward. Technical Targets: The setup suggests strong upside momentum with immediate targets at ₹1,264 (T1), ₹1,388 (T2), and an ambitious long-term target of ₹1,788 (T3). Clean Risk/Reward: With a solid support base established around the ₹1,100–₹1,150 zone, the risk-to-reward ratio for this swing trade is exceptionally attractive for medium-to-long-term portfolios.
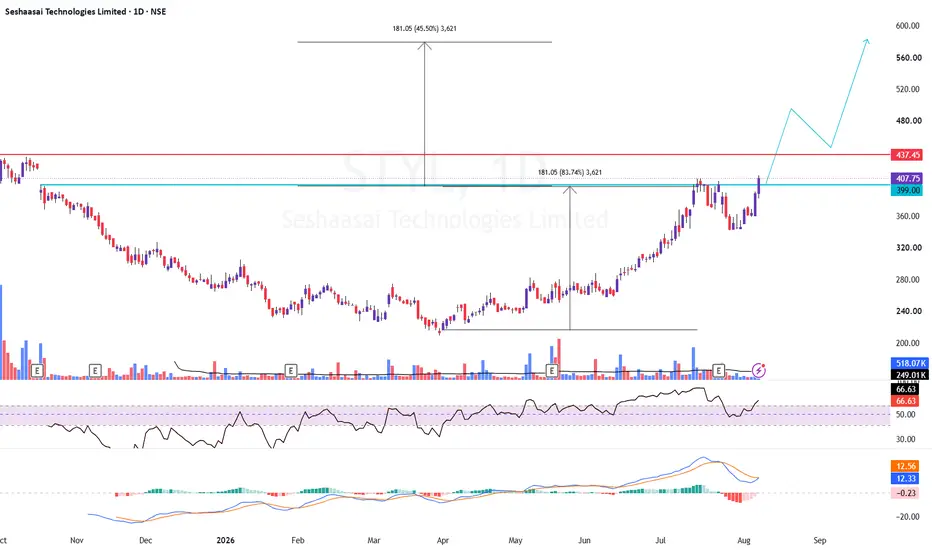
NSE:INOXINDIALong
by BallaJi
Updated
THE SAME STOCK. TWO DIFFERENT STORIES.There is a saying in the markets: "The chart is the same. The story changes with the timeframe." Oil India reminded me of this over the last few weeks. On the monthly chart, I see a company that went through years of consolidation, broke out, and rewarded patient investors with a massive move. From the post-COVID lows, the stock multiplied several times. Discoveries in Rajasthan. Discoveries in the Andaman Sea. Strong cash flows. Attractive dividends. Improving exploration prospects. The long-term story looked intact. Then I zoomed in. The daily chart showed something very different. Supports started breaking. Gap-down candles appeared. The ₹490 zone gave way. The ₹470 support failed. Momentum weakened. Options data turned bearish. Sentiment shifted from optimism to fear within days. Nothing about the company changed overnight. But the market's expectations did. And that's the lesson. Markets don't move in straight lines. A stock can be fundamentally strong and technically weak at the same time. It can have exciting headlines and still fall 15–20%. It can test the conviction of long-term investors while creating opportunities for traders. As someone who has been tracking Oil India closely, this episode reinforced three things for me: 1. Price is the final truth. 2. Timeframe determines perspective. 3. Conviction without risk management is dangerous. Today, the debate isn't whether Oil India is a "good" or "bad" company. The real question is: Are we witnessing a normal correction within a larger cycle, or the early signs of a much deeper reset? Only time will answer that. Until then, I remain a student of the market. Because sometimes the biggest lessons don't come from the winners. They come from the positions that force us to think deeper.
NSE:OILLong
by RoG8
Azad Engineering Analysis1. Broke previous ATH. 2. Retracement to 50EMA. 3. Short term trend line broken. 4. Volume on breakout is high. 5. Making a base post breakout 6. Big moves by buyers.
NSE:AZADLong
by gulamambiashaikh
Updated
Senores Pharmaceuticals Stock gave a base breakout. The base was made post a rally, and then a new base has been formed on top of the previous base. Current Price is above 50, 150 and 200 EMAs. All the 3 EMAs are also aligned properly. Price falls down with low volume, whereas is rising with high volumes. Pharma sector is doing good. Relative strength of the stock is good (stronger than Nifty50 and Nifty Pharma). Sales and Profit growth is visible. Promoter, DIIs and FIIs holding rising.
NSE:SENORESLong
by gulamambiashaikh
Updated
sjvn Rsi divergence as prise was coming down , Rsi has sudden spike , breake old its style and then now retesting it , after that prise have stable itself now chances are it can go to bullish side
NSE:SJVNLong
by talwinfer12
WPIL | Risk-Takers Buy @LTP or Safer Entry if Close above 472 | WPIL | Risk-Takers Buy @LTP or Safer Entry if Close above 472 | Strict SL below 400 | 1st Target 600 ********************************************************************* Disclaimer (Please Read Carefully): This is not investment advice. The stocks shared here are purely for educational and informational purposes. Please do your own research or consult with a financial advisor before making any investment decisions. The stock market involves risk, risk, and only risk. To survive in the market, accepting stop-loss with discipline and without hesitation. There is no other way to protect you capital. Any stock I share is either already part of my existing holding or I take a fresh entry at the same level I mention. I always place the stop-loss in my system at the time of buying, and I give the highest importance to stop-loss more than the target. Once the target is achieved, I usually book profit once and then wait for either a retest or a fresh breakout. I buy only on breakouts, never on supports. I also do not sell at resistance levels. That is simply my trading style.
BSE:WPILLong
by ProfitLossMereSath
Updated
General insurance corp long ,Rsi divergence in thisstock , it have rsi divergence if you look very closely bottom of rsi , in Jan 25 rsi bittom was way to down , if you look closesely prise is same and RSI is up on same prise it is divergence
BSE:GICRELong
by talwinfer12
India Railway Finance corp RSI divergence and on old spot this stock have reached on support and is almost retesting it again ,in february it was on support as well this time it have reached bottom support and prise can reverse from here
NSE:IRFCLong
by talwinfer12
Acc long Most Volume area this stock have reached on most volume area now and now this time it is retesting it again and even Rsi Divergenge in present as well
NSE:ACCLong
by talwinfer12
india mart rsi diversionthis stock does have RSI divergence on daily frame and it is also on a spot after 2021 making high , but on weekly frame Rsi have returned from same Spot as well before
NSE:INDIAMARTLong
by talwinfer12
DIFFNKG | Risk-Takers Buy @LTP or Safer Entry Buy @350DIFFNKG | Risk-Takers Buy @LTP or Safer Entry Buy @350 | Strict SL below 335 on closing basis | 1st Target 460 ********************************************************************* Disclaimer (Please Read Carefully): This is not investment advice. The stocks shared here are purely for educational and informational purposes. Please do your own research or consult with a financial advisor before making any investment decisions. The stock market involves risk, risk, and only risk. To survive in the market, accepting stop-loss with discipline and without hesitation. There is no other way to protect you capital. Any stock I share is either already part of my existing holding or I take a fresh entry at the same level I mention. I always place the stop-loss in my system at the time of buying, and I give the highest importance to stop-loss more than the target. Once the target is achieved, I usually book profit once and then wait for either a retest or a fresh breakout. I buy only on breakouts, never on supports. I also do not sell at resistance levels. That is simply my trading style.
NSE:DIFFNKGLong
by ProfitLossMereSath
Updated
JSW Infrastructure – Reversal on Cards?🚢 JSW Infrastructure – Reversal on Cards? 📊 CMP: ₹286 🛑 SL: ₹254 🎯 Targets: ₹304 | ₹349 | ₹420 JSW Infrastructure is forming a bullish Rounding Bottom pattern, indicating a potential trend reversal. A sustained breakout above ₹292 can confirm the setup and trigger an upside move towards ₹349. If the stock breaches and sustains above ₹349, a larger rounding bottom pattern can get activated, opening the way for ₹420 in the medium term. ✅ Rounding Bottom Formation ✅ Breakout Trigger: ₹292 ✅ Major Resistance: ₹349 ✅ Positional Bullish Setup ⚠️ Markets remain volatile. Maintain strict position sizing, keep your stop loss in the system, and stay patient with the trade. ⚠️ Clarification: This is an independent analysis based purely on technical and market study. No part of Religare is involved in this view or recommendation. 📝 Important: I am not responsible for any loss or profit incurred. I am not taking any fees for these views—just sharing my analysis for educational and informational purposes. 📉 Disclaimer: Not SEBI-registered. Please do your own research or consult a financial advisor before taking any investment decision.
NSE:JSWINFRALong
by satyam15
TamilNadu Mercantile BankPrice Action Analysis: Base breakout, followed by retracement. Then made a base. Now trying to break the base. Price took support of 50SMA Fundamental Analysis: Sector is also showing signs of revival. Increase in FII holdings NPA is lower. SL @ 720 (6%) Tgt @ 900 (17.5%) CMP 766
NSE:TMBLong
by gulamambiashaikh
Inox Green Energy – Inverse H&S Breakout Watch📊 Setup: Daily chart flashing a textbook Inverse Head & Shoulders. 🔑 Current Price Range: ₹90 – ₹290. 🛡️ Support: Strong base at the Head zone. 🚀 Upside Potential: Breakout above neckline could fuel sharp upside momentum. 💡 Why Traders Care: Inverse H&S is one of the most reliable bullish reversal patterns. Volume spike near the Head adds conviction. Buy/Sell signals aligning with breakout zone. ⚡️ My Take: Inox Green Energy is coiling for a reversal — breakout could ignite momentum toward fresh highs.
NSE:INOXGREENLong
by TechnicalAnalystSucrit
Check out the Target.In the bull Run the minimum target for this stock is expected around 18450.
NSE:AMBERLong
by Lesh_trade
TORRENT PHARMATorrent Pharmaceuticals Ltd. (CMP ₹4,572.00, NSE: TORNTPHARM) Prepared by Sucrit Patil | The SmartWay Research Desk | 12 June 2026 An Ahmedabad‑based pharmaceutical major, incorporated in 1972. Torrent Pharma operates across cardiovascular, central nervous system, gastro‑intestinal, anti‑infective, diabetology, and oncology segments, with strong presence in India, Brazil, Germany, and the U.S. Promoter Holding (Mar 2026): Mehta Family — 71.25% stake (no pledges) --- FY22–FY26 Snapshot - Revenue Growth: FY26 revenue ₹11,215 Cr vs ₹9,842 Cr in FY25 (+13.9% YoY). → Good - Net Profit: FY26 PAT ₹1,215 Cr vs ₹1,048 Cr in FY25 (+15.9% YoY). → Good - Operating Margin: FY26 EBITDA ₹2,312 Cr, margin 20.6% vs 19.8% last year (+80 bps). → Good - Equity Capital: Stable, face value ₹5. → Good - Dividend Policy: Dividend ₹20.00/share declared for FY26. → Good - Asset Building: Investments in oncology, biosimilars, and U.S. generics. → Good - Sales: Strong demand from India, Brazil, and Germany markets. → Good - Expense: R&D spend ~8% of revenue; manageable. → Good - EPS: FY26 EPS ₹72.15 vs ₹62.20 last year (+16%). → Good --- Institutional Interest & Ownership Trends (Mar 2026) - Promoter Holding: 71.25% (no pledges) - FII Holding: 8.12% - DII Holding: 12.34% - Retail & Others: 8.29% --- Strategic Moves & Innovations - Expansion in oncology and biosimilars pipeline. - Focus on U.S. generics and EU formulations. - Partnerships with global pharma companies for co‑marketing. - Diversification into specialty therapies and chronic care. --- Cash Flow & Balance Sheet Strength - Market cap ~₹77,800 Cr. - Debt‑to‑equity ratio ~0.22 (moderate leverage). - Book value per share ₹412.00; P/B ~11.1. - EPS (TTM) ₹72.15; P/E ~63.4. --- Risk Factors - High P/E ratio ~63.4, indicating premium valuations. - Dependence on regulatory approvals in U.S./EU markets. - Exposure to pricing pressure in generics. - Competition from Sun Pharma, Cipla, and Dr. Reddy’s. --- Investor Takeaway Torrent Pharma has delivered robust FY26 performance, with revenue and profit growth supported by chronic therapies and international expansion. With strong promoter backing, dividend payouts, and a diversified portfolio, Torrent remains a premium play in Indian pharma. At CMP ₹4,572.00, valuations are expensive (P/E ~63.4, P/B ~11.1), reflecting growth expectations in oncology, biosimilars, and global generics.
NSE:TORNTPHARMLong
by TechnicalAnalystSucrit
Review and plan for 12th June 2026Nifty future and banknifty future analysis and intraday plan. This video is for information/education purpose only. you are 100% responsible for any actions you take by reading/viewing this post. please consult your financial advisor before taking any action. ----Vinaykumar hiremath, CMT
NSE:WOCKPHARMA
08:21
by vinaysh
TECHM expects a Long callTECHM expects a long call for some reasons. Retest at 20 EMA level. Looking uptrend. Entry and exit levels marked.
NSE:TECHMLong
by NSB-GroPro
Updated
ASIANPAINT expects a downtrend.ASIANPAINT expects a downtrend. double top happen then new lower trend started, seems down trend. Exit level was previous major level.
NSE:ASIANPAINTShort
by NSB-GroPro
Updated
COALINDIA expects a downtrend.Seems lower high created, struggle to go above. Sellers volume are increasing. If market goes below 478.9 level, then can enter for short selling with Target of RR 1:2 as previous trend swing high, with SL.
NSE:COALINDIAShort
by NSB-GroPro
Updated
Sun pharma downtrendDouble top formed then downtrend started, expect a new downtrend from 2 major levels. If rejection happened at the key mentioned levels with volume, market goes down. Expects 1:4 and 1:5 Risk reward ratios.
NSE:SUNPHARMAShort
by NSB-GroPro
Updated
11
112233445566778899101011111212131314141515161617171818191920202121222223232424252526262727282829293030313132323333343435353636373738383939404041414242
…999999

Made by humans

Select market data provided by ICE Data Services. Select reference data provided by FactSet. Copyright © 2026 FactSet Research Systems Inc.Copyright © 2026, American Bankers Association. CUSIP Database provided by FactSet Research Systems Inc. All rights reserved. SEC filings and other documents provided by Quartr.© 2026 TradingView, Inc.

More than a product
  • Supercharts
Screeners
  • Stocks
  • ETFs
  • Bonds
  • Crypto coins
  • CEX pairs
  • DEX pairs
  • Pine
Heatmaps
  • Stocks
  • ETFs
  • Crypto coins
Calendars
  • Economic
  • Earnings
  • Dividends
  • IPOs
More products
  • News Flow
  • Portfolios
  • Fundamental Graphs
  • Yield Curves
  • Options
  • Macro Maps
  • Pine Script®
Apps
  • Mobile
  • Desktop
Community
  • Social network
  • Wall of Love
  • Refer a friend
  • House Rules
  • Moderators
Ideas
  • Trading
  • Education
  • Editors' picks
Pine Script
  • Indicators & strategies
  • Wizards
  • Freelancers
  • Paid Spaces
Tools & subscriptions
  • Features
  • Pricing
  • Market data
  • Gift plans
Trading
  • Overview
  • Brokers
  • Brokers comparison
  • The Leap
Special offers
  • CME Group futures
  • Eurex futures
  • US stocks bundle
About company
  • Who we are
  • Space mission
  • Blog
  • Help Center
  • Careers
  • Media kit
Merch
  • TradingView store
  • Tarot cards for traders
  • The C63 TradeTime
Policies & security
  • Terms of Use
  • Disclaimer
  • Privacy Policy
  • Cookies Policy
  • Accessibility Statement
  • Security tips
  • Bug Bounty program
  • Status page
Business solutions
  • Widgets
  • Charting libraries
  • Lightweight Charts™
  • Advanced Charts
  • Trading Platform
Growth opportunities
  • Advertising
  • Brokerage integration
  • Partner program
  • Education program
Community
  • Social network
  • Wall of Love
  • Refer a friend
  • House Rules
  • Moderators
Ideas
  • Trading
  • Education
  • Editors' picks
Pine Script
  • Indicators & strategies
  • Wizards
  • Freelancers
  • Paid Spaces
Business solutions
  • Widgets
  • Charting libraries
  • Lightweight Charts™
  • Advanced Charts
  • Trading Platform
Growth opportunities
  • Advertising
  • Brokerage integration
  • Partner program
  • Education program
Look FirstLook First