Long
Long
 Short
Short
 Long
Long
 Long
Long
 Long
Long
Paytm💳 STOCK TO WATCH 💳
₹1,715 → ₹2,754 → ₹3,490 👀
A high-growth fintech name appearing on my Weekly R4 Breakout Scanner.
One 97 Communications Ltd. (Paytm)
📌 Buy Zone: ₹1,715
📌 Breakout Zone: ₹1,700
🛑 Stop Loss: ₹1,365
🎯 Target 1: ₹2,754
🎯 Target 2: ₹3,490
Why Paytm?
🚀 Strong Q1 FY27 growth: Operating revenue jumped 28% YoY to ₹2,448 Cr, while PAT surged 79% to ₹220 Cr.
💰 Record quarterly EBITDA: EBITDA reached ₹203 Cr, up 182% YoY, with EBITDA margin improving to 8%.
📱 Merchant payments momentum: Merchant GMV increased 31% YoY to ₹7.1 lakh Cr.
📈 UPI market-share momentum: Consumer UPI GTV grew 45% YoY to ₹5.9 lakh Cr, while monthly transacting users reached 8 Cr.
🤖 AI-led operating leverage: Paytm is increasingly deploying AI across engineering, customer support, sales and merchant operations to improve productivity and margins.
Why It Caught My Attention
✅ 28%+ revenue growth
✅ 79%+ PAT growth
✅ 182% EBITDA growth
✅ Record quarterly EBITDA
✅ Strong merchant GMV growth
✅ UPI market-share gains
✅ 8 Cr monthly transacting users
✅ AI-led operating leverage
✅ Weekly R4 Momentum Breakout
📊 Technical Setup
Buy: ₹1,715
Breakout: ₹1,700
SL: ₹1,365
T1: ₹2,754
T2: ₹3,490
⚠️ High Risk – High Reward Setup. Follow strict stop-loss and disciplined position sizing.
📢 Disclaimer: This content is for educational purposes only and not investment advice. Please do your own due diligence before making any investment decisions.
Risk Defined. Reward Visible.
© 20K Microcap Investing | R4 Momentum Desk
#Paytm #One97Communications #Fintech #UPI #DigitalPayments #AIStocks #TechnologyStocks #StockMarketIndia #IndianStocks #StocksToWatch #R4Breakout #MomentumInvesting #20KMicrocap  Long
Long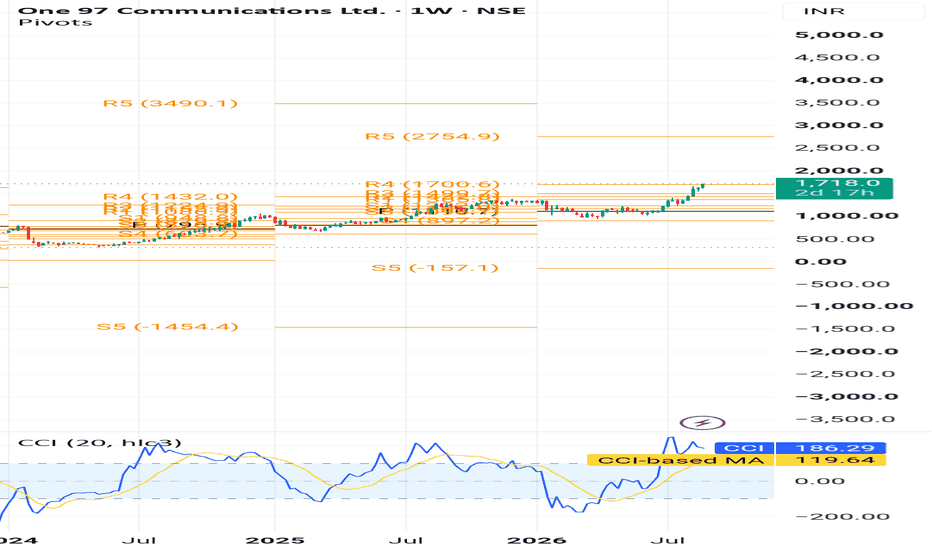
 Long
Long
 Long
Long
 Long
Long
Early stages of a long-term reversal, but it has not yet confirmTechnical
Trend: Long-term correction appears to be stabilizing; stock has formed a base around ₹800–1,000.
Current: ~₹1,236 — approaching an important resistance zone.
Resistance: ₹1,250–1,300; breakout above ₹1,300 would improve the chart significantly.
Next levels: ₹1,450 → ₹1,600.
Support: ₹1,100–1,150; stronger support around ₹800–900.
Setup: Accumulation / early reversal, but major breakout not confirmed yet.
Fundamental
Business: Good — diversified chlor-alkali + downstream chemical platform.
Demand: Strong structural demand in CPVC, ECH and epoxy-related applications.
Expansion: CPVC 75K → 150K TPA and ECH 50K → 100K TPA; commissioning/ramp-up is the key near-term catalyst.
Next major project: 125K TPA epoxy resin/formulations, targeted H2 FY28.
Execution: Previous projects have generally been delivered; current expansion needs confirmation through utilisation.
Financials: Healthy margins and manageable leverage, but chemical-cycle volatility remains.
Valuation: More reasonable after the large correction, but not obviously cheap enough to ignore execution risk.
Management: Promoter ownership/commitment is strong; no major governance concern identified.  Long
Long
 Long
Long
 Long
Long
 Long
Long
 Long
Long
 Long
Long
BSE Short Intraday Setup I 25 Aug 2026A clean intraday setup developing on the 15-minute chart.
The BTR Pro Sell Signal appeared around the 3,300 zone, followed by continued downside movement.
Setup levels shown on the chart:
🔴 Sell Signal: ~3,300
🛑 SL: 3,324.00
🎯 T1: 3,277.30
🎯 T2: 3,253.90
🎯 T3: 3,230.60
At the time of the chart, price is around 3,286, already moving toward the first potential target.
The key here is not to predict every candle. The setup provides a defined structure; the trader's job is to observe price action, manage risk and remain disciplined.
Wait for the setup. Define the risk. Let price do the work.
For educational and technical-analysis study.  Long
Long
FACT S/R
Support and Resistance Levels:
Support Levels: These are price points (green line/shade) where a downward trend may be halted due to a concentration of buying interest. Imagine them as a safety net where buyers step in, preventing further decline.
Resistance Levels: Conversely, resistance levels (red line/shade) are where upward trends might stall due to increased selling interest. They act like a ceiling where sellers come in to push prices down.
Breakouts:
Bullish Breakout: When the price moves above resistance, it often indicates strong buying interest and the potential for a continued uptrend. Traders may view this as a signal to buy or hold.
Bearish Breakout: When the price falls below support, it can signal strong selling interest and the potential for a continued downtrend. Traders might see this as a cue to sell or avoid buying.
MA Ribbon (EMA 20, EMA 50, EMA 100, EMA 200) :
Above EMA: If the stock price is above the EMA, it suggests a potential uptrend or bullish momentum.
Below EMA: If the stock price is below the EMA, it indicates a potential downtrend or bearish momentum.
Trendline: A trendline is a straight line drawn on a chart to represent the general direction of a data point set.
Uptrend Line: Drawn by connecting the lows in an upward trend. Indicates that the price is moving higher over time. Acts as a support level, where prices tend to bounce upward.
Downtrend Line: Drawn by connecting the highs in a downward trend. Indicates that the price is moving lower over time. It acts as a resistance level, where prices tend to drop.
Disclaimer:
I am not SEBI registered. The information provided here is for learning purposes only and should not be interpreted as financial advice. Consider the broader market context and consult with a qualified financial advisor before making investment decisions. KIRI INDUSTRIES LTD S/R
Support and Resistance Levels:
Support Levels: These are price points (green line/shade) where a downward trend may be halted due to a concentration of buying interest. Imagine them as a safety net where buyers step in, preventing further decline.
Resistance Levels: Conversely, resistance levels (red line/shade) are where upward trends might stall due to increased selling interest. They act like a ceiling where sellers come in to push prices down.
Breakouts:
Bullish Breakout: When the price moves above resistance, it often indicates strong buying interest and the potential for a continued uptrend. Traders may view this as a signal to buy or hold.
Bearish Breakout: When the price falls below support, it can signal strong selling interest and the potential for a continued downtrend. Traders might see this as a cue to sell or avoid buying.
MA Ribbon (EMA 20, EMA 50, EMA 100, EMA 200) :
Above EMA: If the stock price is above the EMA, it suggests a potential uptrend or bullish momentum.
Below EMA: If the stock price is below the EMA, it indicates a potential downtrend or bearish momentum.
Trendline: A trendline is a straight line drawn on a chart to represent the general direction of a data point set.
Uptrend Line: Drawn by connecting the lows in an upward trend. Indicates that the price is moving higher over time. Acts as a support level, where prices tend to bounce upward.
Downtrend Line: Drawn by connecting the highs in a downward trend. Indicates that the price is moving lower over time. It acts as a resistance level, where prices tend to drop.
Disclaimer:
I am not SEBI registered. The information provided here is for learning purposes only and should not be interpreted as financial advice. Consider the broader market context and consult with a qualified financial advisor before making investment decisions.  Long
Long
VOLTAS – Long-Term Consolidation: Breakout SetupVOLTAS has been consolidating for an extended period after the major decline from its previous high.
The stock is currently trading inside a broad range, roughly ₹1,200–₹1,520.
🔹 Support: ₹1,200–₹1,220
🔹 Resistance: ₹1,500–₹1,520
Price has repeatedly bounced from the lower end of the range and faced selling pressure near the upper boundary.
A decisive breakout above ₹1,520 with strong volume could signal the beginning of a new uptrend, while rejection from the resistance zone may keep the stock range-bound.
Bullish scenario: Breakout above ₹1,520 → potential move toward ₹1,650–₹1,800.
Bearish scenario: Breakdown below ₹1,200 → consolidation structure could fail and lower levels may come into play.
For now, this is a wait-for-breakout setup rather than a confirmed breakout.