Long
Long
 Long
Long
JINDALSTEL## Jindal Steel & Power Ltd. (CMP ₹1,145.00, NSE: JINDALSTEL)
**The SmartWay Research Desk | 4 September 2026**
A New Delhi‑based steel and power company, incorporated in 1979. Jindal Steel & Power Ltd. (JSPL) is one of India’s leading **steel producers and energy companies**, with operations spanning **steel manufacturing, power generation, mining, and infrastructure projects**. The company has plants in Chhattisgarh, Odisha, and Jharkhand, and exports to over 20 countries.
**Promoter Holding (Jun 2026):** **Jindal Family (Naveen Jindal & Associates) — ~60.5% stake (no pledges)**
---
### FY22–FY26 Snapshot
- **Revenue Growth:** FY26 revenue ₹58,842 Cr vs ₹52,412 Cr in FY25 (+12.3% YoY). → **Good**
- **Net Profit:** FY26 PAT ₹6,212 Cr vs ₹5,412 Cr in FY25 (+14.8% YoY). → **Good**
- **Operating Margin:** FY26 EBITDA ₹12,812 Cr, margin 21.8% vs 21.2% last year (+60 bps). → **Good**
- **Equity Capital:** Stable, face value ₹1. → **Good**
- **Dividend Policy:** Dividend ₹6.00/share declared for FY26. → **Good**
- **Asset Building:** Investments in **capacity expansion, coal mining, and renewable energy projects**. → **Good**
- **Sales:** Strong demand from **domestic infra and export markets**. → **Good**
- **Expense:** Raw material and energy costs remain volatile. → **Neutral/Good**
- **EPS:** FY26 EPS ₹62.25 vs ₹54.20 last year (+14.9%). → **Good**
---
### Institutional Interest & Ownership Trends (Jun 2026)
- **Promoter Holding:** ~60.5% (no pledges)
- **FII Holding:** ~18.2%
- **DII Holding:** ~15.6%
- **Retail & Others:** ~5.7%
---
### Strategic Moves & Innovations
- Expansion in **steel capacity and value‑added products**.
- Focus on **renewable energy and green steel initiatives**.
- Partnerships with **global infra players for exports**.
- Diversification into **coal mining and power generation**.
---
### Cash Flow & Balance Sheet Strength
- Market cap ~₹1,15,000 Cr.
- Debt‑to‑equity ratio ~0.68 (moderate leverage).
- Book value per share ₹312.00; P/B ~3.7.
- EPS (TTM) ₹62.25; P/E ~18.4.
---
### Risk Factors
- Moderate **P/E ratio ~18.4**, valuations fair.
- Dependence on **steel demand cycles and infra spending**.
- Exposure to **commodity price volatility (coal, iron ore)**.
- Competition from Tata Steel, JSW Steel, and SAIL.
---
### Investor Takeaway
Jindal Steel & Power has delivered **robust FY26 performance**, supported by steel demand, infra growth, and renewable energy initiatives. With strong promoter backing (Jindal Family, 60.5% stake), dividend payouts, and leadership in steel & power, JSPL remains a **large‑cap steel and infra play**. At CMP ₹1,145.00, valuations are **reasonable (P/E ~18.4, P/B ~3.7)**, reflecting growth potential with manageable risks.  Long
Long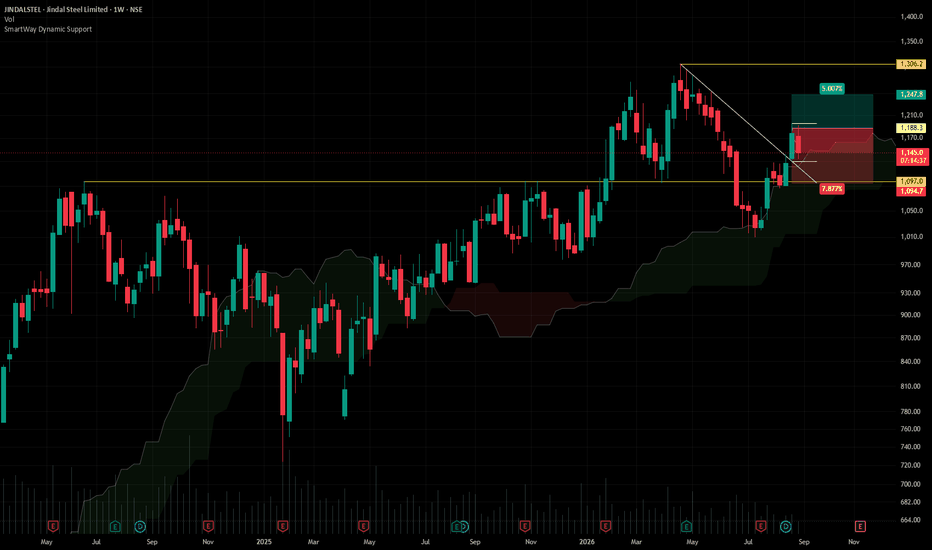
Bosch Home Comfort 🌡️ STOCK TO WATCH 🌡️
₹1,773 → ₹2,697 → ₹3,581 👀
A home-comfort + HVAC growth + momentum setup appearing on my Weekly R4 Momentum Breakout Scanner.
Bosch Home Comfort India Ltd.
📌 Buy Zone: ₹1,773
📌 Breakout Zone: ₹1,773
🛑 Stop Loss: ₹1,313
🎯 Target 1: ₹2,697
🎯 Target 2: ₹3,581
Why Bosch Home Comfort?
❄️ HVAC-focused business: The company operates in cooling products for comfort and commercial use, along with design and development services.
🏷️ Bosch ownership & brand transition: Robert Bosch GmbH completed the acquisition of the residential & light-commercial HVAC business of the Johnson Controls–Hitachi Air Conditioning joint venture, including India. The Indian company subsequently became Bosch Home Comfort India Ltd.
📈 Strong Q1 FY27 growth: Revenue for Q1 FY27 rose to approximately ₹1,095.5 Cr, up 28.5% YoY, while net profit increased approximately 49.4% YoY to ₹22.8 Cr.
🌡️ Structural cooling opportunity: Rising cooling demand and increasing adoption of air-conditioning solutions provide a long-term industry tailwind for the company's core market.
🌍 Global Bosch ecosystem: Being part of the Bosch Group provides access to global technology, engineering capabilities and an established international ecosystem. Bosch operates across around 60 countries with roughly 500 subsidiaries and regional companies.
🔥 Weekly R4 Momentum Breakout: ₹1,773 is the key level on my scanner. Sustained momentum above this zone could open the path towards the higher targets.
Why It Caught My Attention
✅ HVAC / home-comfort theme
✅ Strong Q1 FY27 revenue growth
✅ Q1 profit growth
✅ Bosch ownership & global ecosystem
✅ Cooling-demand structural opportunity
✅ Focused operating segment
🔥 Weekly R4 Momentum Breakout
⚠️ IMPORTANT
This is not a risk-free setup.
The company has undergone a major ownership and brand transition, and FY26 included restructuring-related costs. The business remains exposed to seasonality, raw-material costs, competition and execution risks.
The targets of ₹2,697 and ₹3,581 are technical/momentum targets, not guaranteed fundamental valuations.
Risk Defined. Reward Visible.
📢 Disclaimer: This content is for educational purposes only and not investment advice. Please do your own due diligence before making any investment decisions.
© 20K Microcap Investing | R4 Momentum Desk
#BoschHomeComfort #BOSCHHCIL #HVAC #AirConditioning #CoolingStocks #ConsumerDurables #SmallCapStocks #MomentumStocks #BreakoutStocks #StockMarketIndia #IndianStocks #StocksToWatch #R4Breakout #MomentumInvesting #20KMicrocap  Long
Long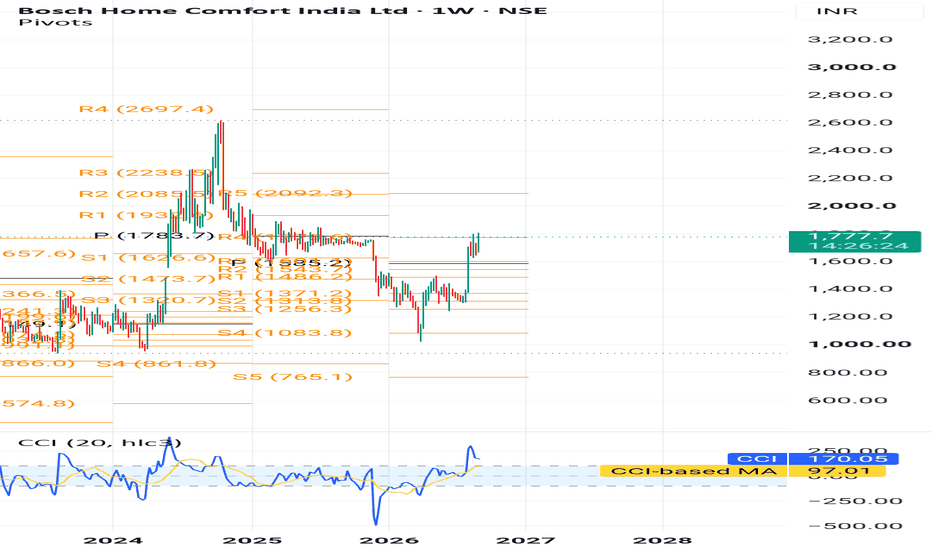
Vishnu Chemicals 🧪 STOCK TO WATCH 🧪
₹683 → ₹958 → ₹1,064 👀
A specialty chemicals + growth + momentum setup appearing on my Weekly R4 Momentum Breakout Scanner.
Vishnu Chemicals Ltd.
📌 Buy Zone: ₹683
📌 Breakout Zone: ₹683
🛑 Stop Loss: ₹564
🎯 Target 1: ₹958
🎯 Target 2: ₹1,064
Why Vishnu Chemicals?
🧪 Specialty chemicals leader: Vishnu Chemicals has strong positioning in Chromium and Barium chemicals, with products serving customers across 50+ countries.
📈 Strong Q1 FY27 growth: Consolidated revenue reached ₹433.4 Cr, up 24.9% YoY, while PAT attributable to owners rose 23% YoY to ₹39.6 Cr.
🔬 Value-added chemistry: The company's growth strategy is increasingly focused on higher-value Chromium products, while its Barium and Strontium businesses add further diversification.
🌍 Global customer base: Vishnu Chemicals has built an international specialty-chemicals franchise serving customers across 50+ countries.
🏭 Capacity expansion: The company has been adding capabilities across its specialty-chemical portfolio, including Strontium Carbonate, which has commenced commercial production.
🔥 Weekly R4 Momentum Breakout: ₹683 is the key level on my scanner. A sustained move around this zone could open the path towards the higher targets.
Why It Caught My Attention
✅ Specialty chemicals play
✅ Strong Chromium & Barium positioning
✅ 24.9% Q1 revenue growth
✅ 23% Q1 PAT growth
✅ Global presence across 50+ countries
✅ Expansion into value-added chemicals
🔥 Weekly R4 Momentum Breakout
⚠️ IMPORTANT
The business is showing healthy growth, but there are also things to monitor. Q1 FY27 included a planned maintenance shutdown at the Vizag facility, while gross margin contracted and logistics costs increased.
Therefore, ₹564 remains the key risk-management level for this setup.
The targets of ₹958 and ₹1,064 are technical/momentum targets, not guaranteed fundamental valuations.
Risk Defined. Reward Visible.
📢 Disclaimer: This content is for educational purposes only and not investment advice. Please do your own due diligence before making any investment decisions.
© 20K Microcap Investing | R4 Momentum Desk
#VishnuChemicals #VISHNU #SpecialtyChemicals #ChemicalStocks #SmallCapStocks #MomentumStocks #BreakoutStocks #StockMarketIndia #IndianStocks #StocksToWatch #R4Breakout #MomentumInvesting #20KMicrocap  Long
Long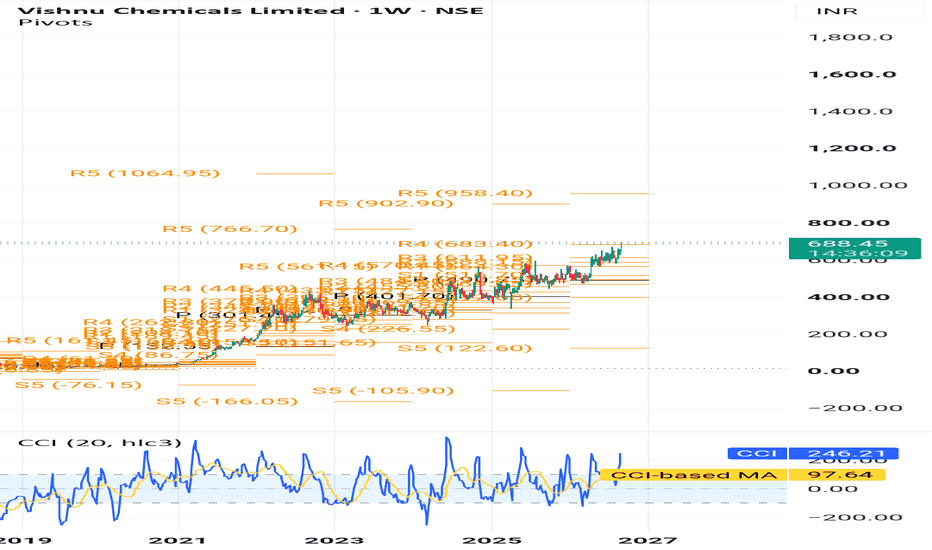
GOCL CORP 🏦 STOCK TO WATCH 🏦
₹390–410 → ₹717 → ₹1,192 → ₹1,324 👀
A special situation + asset value + momentum setup appearing on my Weekly R4 Momentum Breakout Scanner.
GOCL Corp Ltd.
📌 Buy Zone: ₹390–410
📌 Breakout Zone: ₹389
🛑 Stop Loss: ₹278
🎯 Target 1: ₹717
🎯 Target 2: ₹1,192
🎯 Target 3: ₹1,324
Why GOCL Corp?
🏢 Asset monetisation story: GOCL has been pursuing monetisation of its land assets, including the Kukatpally, Hyderabad parcel, while continuing development at its Bengaluru Ecopolis project.
💻 Electronics manufacturing pivot: The company’s EMS business is expanding into PCBA, box-build integration, product design and manufacturing across Industrial, Automotive, Defence, IoT, Consumer Electronics and E-Mobility.
🔄 Business transformation: GOCL has been moving away from its legacy explosives/energetics businesses, with those operations being discontinued or divested, while EMS and Realty remain continuing businesses.
🌐 New-age manufacturing opportunity: GOCL-EMS is building capabilities around end-to-end electronics manufacturing and ODM services, targeting technology-driven sectors where outsourcing opportunities are expanding.
🏗️ Realty optionality: Ecopolis in Bengaluru is spread across more than 38 acres, while the company continues to work on monetising land assets.
🔥 Weekly R4 Momentum Breakout: The technical setup is what brings GOCL onto my radar at the current levels.
Why It Caught My Attention
✅ Special-situation character
✅ Significant asset/realty angle
✅ Electronics manufacturing pivot
✅ Business transformation underway
✅ Multiple potential value-unlocking triggers
✅ EMS exposure to Automotive, Defence, IoT & E-Mobility
🔥 Weekly R4 Momentum Breakout
⚠️ IMPORTANT
This is not a straightforward momentum stock.
The investment thesis depends heavily on execution, asset monetisation and successful scaling of the continuing businesses. The transition away from legacy businesses also makes historical financial comparisons less straightforward.
The ₹1,324 target should therefore be viewed as a high-end special-situation/momentum scenario, not a fundamental earnings forecast.
Risk Defined. Reward Visible.
📢 Disclaimer: This content is for educational purposes only and not investment advice. Please do your own due diligence before making any investment decisions.
© 20K Microcap Investing | R4 Momentum Desk
#GOCLCorp #GOCLCORP #SpecialSituation #AssetPlay #ElectronicsManufacturing #EMS #SmallCapStocks #TurnaroundStocks #MomentumStocks #StockMarketIndia #IndianStocks #StocksToWatch #R4Breakout #MomentumInvesting #20KMicrocap  Long
Long
 Long
Long
 Long
Long
Long 
 Long
Long
 Long
Long
 Long
Long
 Long
Long
 Long
Long
 Long
Long
 Long
Long
 Long
Long
Long 
Master the Cup & Handle: Analyzing the STL Networks ChartA Cup & Handle is one of the most reliable bullish continuation patterns in technical analysis. It represents a brief period where the market takes a breather before continuing its upward trend.
Using the STL Networks Limited (STLNETWORK) weekly chart as our guide, let's break down exactly how this pattern forms, how to read it, and how traders trade it.
🔎 Anatomy of the PatternThe Cup (Accumulation Phase):What it looks like: A smooth, rounded "U" shape or bowl.The Psychology: After hitting a peak, the stock enters a gradual sell-off. As it bottoms out (seen here near the ₹16.00 level), weak hands shake out, and long-term buyers slowly accumulate shares. The gradual upward curve shows buyers gently taking control back up to the prior highs.Rule of thumb: Avoid "V" shaped cups. You want to see a slow, stable rounding bottom that shows true accumulation.
The Handle (Consolidation Phase):What it looks like: A downward-sloping or sideways channel after the cup's right rim is formed.The Psychology: Investors who bought near the bottom or at the prior peak start booking profits, creating a shallow pullback.Rule of thumb: The handle should be relatively shallow. If it retraces more than 50% of the cup's depth, the pattern is severely weakened. On this chart, the handle is beautifully contained and shallow.
📊 How to Plan the TradeWhen looking at a setup like the one on the current STL Networks chart, traders generally look for two specific execution styles:The Breakout Entry (Conservative): Wait for a strong weekly candle close completely above the upper trendline of the handle (around the ₹30–₹33 resistance zone). This confirms that supply has been cleared.The Target Projection: To calculate a classic pattern target, measure the total depth of the cup (from the rim down to the lowest bottom) and project that exact distance upward from the breakout point.
The Stop-Loss: Risk is typically managed by placing a stop-loss just below the lowest point of the handle. If the price falls back deep into the cup, the bullish thesis is invalidated.
💡 Educational Takeaway: Chart patterns require patience. While the upward yellow arrow on the right shows the potential path, the pattern is technically unconfirmed until a valid breakout occurs. Always wait for price action to confirm your bias!  Education
MAZDA## Mazda Ltd. (CMP ₹261.00, NSE: MAZDA)
**The SmartWay Research Desk | 3 September 2026**
An Ahmedabad‑based engineering company, incorporated in 1990. Mazda Ltd. is engaged in **manufacturing of vacuum systems, evaporators, pollution control equipment, and allied engineering products**, catering to industries such as chemicals, pharmaceuticals, food processing, and power.
**Promoter Holding (Jun 2026):** **Mazda Group (Patel Family) — ~65.1% stake (no pledges)**
---
### FY22–FY26 Snapshot
- **Revenue Growth:** FY26 revenue ₹642 Cr vs ₹562 Cr in FY25 (+14.2% YoY). → **Good**
- **Net Profit:** FY26 PAT ₹82 Cr vs ₹70 Cr in FY25 (+17.1% YoY). → **Good**
- **Operating Margin:** FY26 EBITDA ₹142 Cr, margin 22.1% vs 21.4% last year (+70 bps). → **Good**
- **Equity Capital:** Stable, face value ₹10. → **Good**
- **Dividend Policy:** Dividend ₹3.00/share declared for FY26. → **Good**
- **Asset Building:** Investments in **vacuum systems and pollution control equipment expansion**. → **Good**
- **Sales:** Strong demand from **chemical and pharma industries**. → **Good**
- **Expense:** Raw material cost pressures (steel, alloys) remain. → **Neutral/Good**
- **EPS:** FY26 EPS ₹26.25 vs ₹22.40 last year (+17.2%). → **Good**
---
### Institutional Interest & Ownership Trends (Jun 2026)
- **Promoter Holding:** ~65.1% (no pledges)
- **FII Holding:** ~3.2%
- **DII Holding:** ~6.8%
- **Retail & Others:** ~24.9%
---
### Strategic Moves & Innovations
- Expansion in **vacuum systems for chemical and pharma sectors**.
- Focus on **pollution control and environmental engineering solutions**.
- Partnerships with **global engineering firms for technology transfer**.
- Diversification into **food processing and power sector equipment**.
---
### Cash Flow & Balance Sheet Strength
- Market cap ~₹820 Cr.
- Debt‑to‑equity ratio ~0.34 (moderate leverage).
- Book value per share ₹92.00; P/B ~2.8.
- EPS (TTM) ₹26.25; P/E ~9.9.
---
### Risk Factors
- Low‑moderate **P/E ratio ~9.9**, valuations attractive.
- Dependence on **industrial demand cycles**.
- Exposure to **commodity price volatility (steel, alloys)**.
- Competition from Thermax, Triveni Engineering, and Kirloskar Pneumatic.
---
### Investor Takeaway
Mazda Ltd. has delivered **steady FY26 performance**, supported by demand in chemical, pharma, and pollution control equipment. With strong promoter backing (Patel Family, 65.1% stake), dividend payouts, and leadership in niche engineering solutions, Mazda remains a **small‑cap industrial engineering play**. At CMP ₹261.00, valuations are **attractive (P/E ~9.9, P/B ~2.8)**, reflecting growth potential with manageable risks.  Long
Long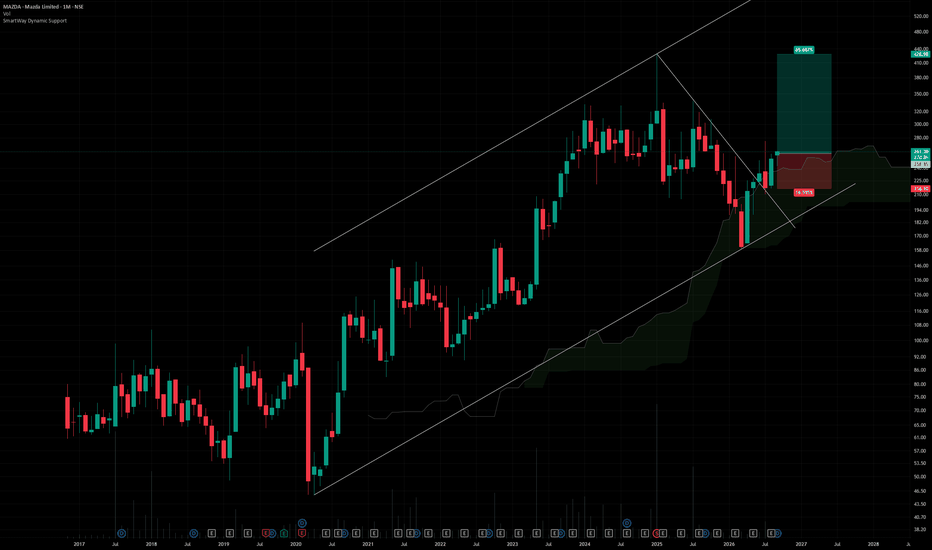
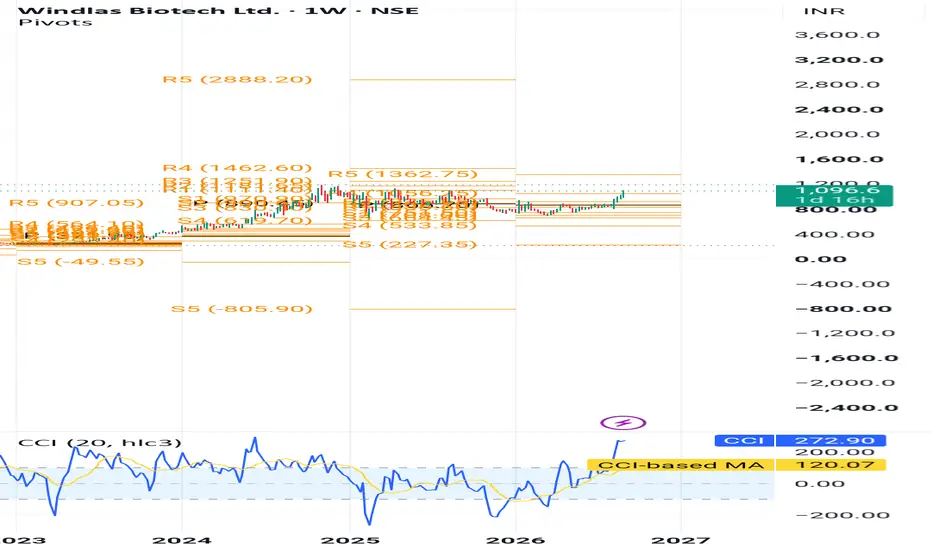
Windlass Biotech 💊 STOCK TO WATCH 💊
₹1,060–1,070 → ₹1,462 → ₹2,888 👀
A pharma/CDMO name appearing on my Weekly R4 Momentum Breakout Scanner.
Windlas Biotech Ltd.
📌 Buy Zone: ₹1,060–1,070
📌 Breakout Zone: ₹1,056
🛑 Stop Loss: ₹751
🎯 Target 1: ₹1,462
🎯 Target 2: ₹2,888
Why Windlas Biotech?
🧬 CDMO + formulations play: Windlas operates across generic formulations CDMO, domestic trade generics/institutional sales and exports, giving it multiple revenue engines.
🌍 Growing export opportunity: FY25 export revenue grew 19% YoY to ₹32.6 Cr, with 69 products exported to global partners.
🏭 Regulated manufacturing base: Its facilities include WHO-GMP-approved plants, with Plant 4 approved for markets including Europe, Canada and South Africa; Plant 5 adds injectable manufacturing capability.
💊 Complex-generic opportunity: The company is expanding product-development and manufacturing capabilities in complex generics and specialised dosage forms.
📈 Strong operating track record: Windlas reported Q1 FY26 revenue of ₹210 Cr, EBITDA ₹27 Cr and PAT ₹18 Cr, with YoY growth of 20%, 27% and 31%, respectively.
Why It Caught My Attention
✅ CDMO + branded formulations + exports
✅ Complex-generic opportunity
✅ WHO-GMP manufacturing infrastructure
✅ Injectable manufacturing capability
✅ Growing international presence
✅ Strong recent operating momentum
🔥 Weekly R4 Momentum Breakout
⚠️ HIGH RISK – HIGH REWARD SETUP. The technical levels above are your scanner-defined levels. The ₹751 stop-loss should be treated as the risk-control point, while execution, margins and export growth need continued monitoring.
Risk Defined. Reward Visible.
📢 Disclaimer: This content is for educational purposes only and not investment advice. Please do your own due diligence before making any investment decisions.
© 20K Microcap Investing | R4 Momentum Desk
#WindlasBiotech #WINDLASS #PharmaStocks #CDMO #PharmaceuticalStocks #ComplexGenerics #SmallCapStocks #HealthcareStocks #StockMarketIndia #IndianStocks #StocksToWatch #R4Breakout #MomentumInvesting #20KMicrocap  Long
Long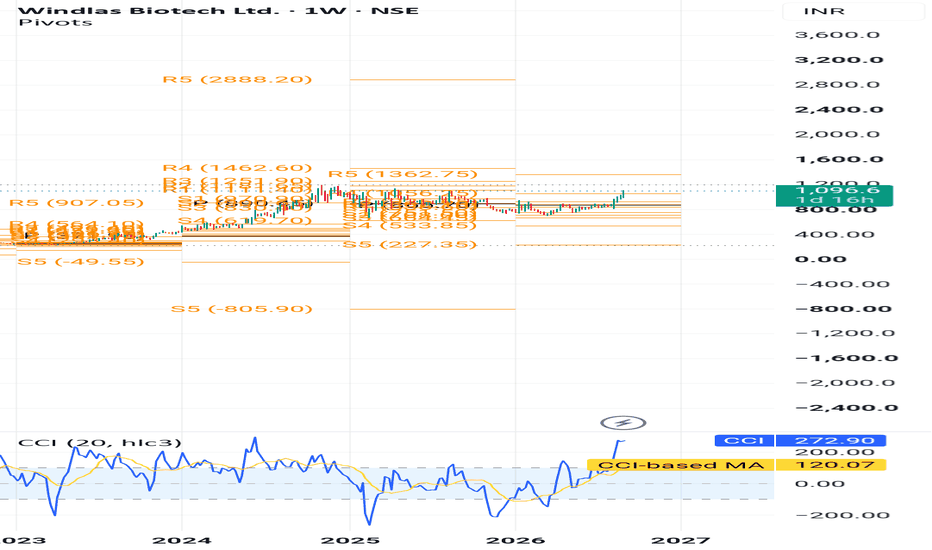
 Education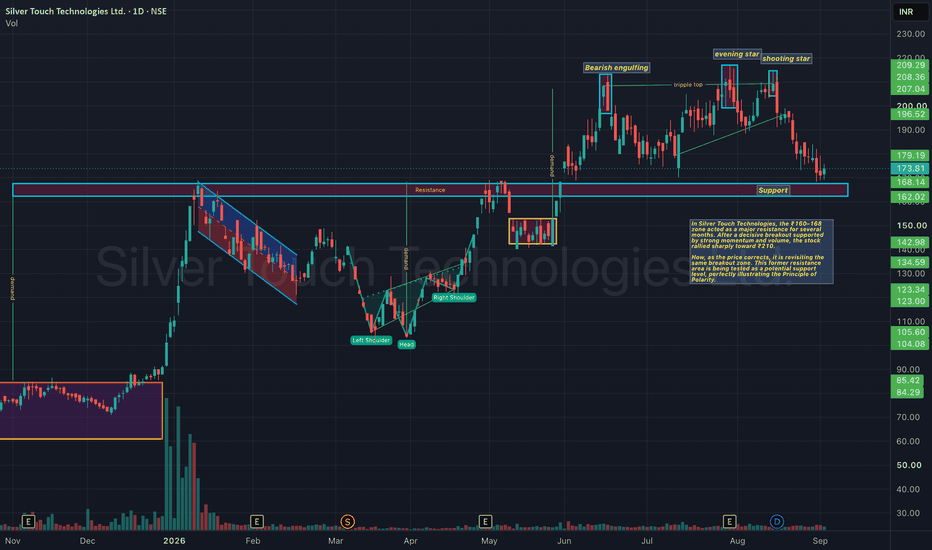
 Long
Long