Long
Long
FILATEX INDIA (NSE) — Multi-Year BreakoutTechnical Setup
NSE:FILATEX has spent years building a large basing structure, and the monthly chart is now showing signs of a fresh leg higher out of a well-defined range.
Prior Base #1: A 57-bar low-to-high base formed the launchpad for the stock's initial multi-year advance.
Retracement #1: After that advance, the stock consolidated for 16 bars before continuing higher.
Base #2: A sharp correction was followed by a long 47-bar low-to-high base, laying the foundation for the current structure.
Retracement #2: A 14-bar high-to-low pullback , which created a new base with breakout and creating demand zone (Rally-Base-Rally).
Best Buying Zone / Rally-Base-Rally: ₹71.14 – ₹78.16, marked as the ideal accumulation zone within the current base.
Stop Loss (S/L): ₹35.50 — a wide, structural stop below the base.
Long-Term Target: ₹187.73 — implying meaningful upside from current levels of ₹87.41 if the base resolves higher.
Max Period / Earlier Expected Target Zone: consider the max 57 bars, might change due to price action and market behavior.
Levels at a glance:
Long-Term Target 187.73
CMP 87.41
Best Buying Zone (upper) 78.16
Best Buying Zone (lower) 71.14
Stop Loss 35.50
Fundamental Scorecard:
Liking: Product Diversity Polyester Chips, DTY, FDY, ATY, PP Yarn, Narrow Fabrics.
OVERALL VIEW: 🟢 7.5/10 (This is basis my fundamental educational tracking) can vary from person to person / student to student.
Overall Summary on Technicals.
₹71–78 zone lines up as the best risk-reward entry area for those tracking a potential rally-base-rally continuation toward the long-term target of ₹187.73, with ₹35.50 as the structural invalidation level.
DISCLAIMER:
This is a technical and fundamental study, not a buy/sell recommendation. Position sizing and risk management (especially given the wide stop distance) are up to individual judgment. Not financial advice — please do your own due diligence.
 Long
Long
#Dixon : 3300 points move expected?Date: 03-09-2026
#Dixon current price: 14,445
Pivot Point: ₹ 14,489.50 Support: ₹ 13,955.87 Resistance: ₹ 15,027.77
Upside Levels:
L1: ₹ 15,685.63
L2: ₹ 16,343.50
L3: ₹ 17,038.75
L4: ₹ 17,734.00
Downside Levels:
L1: ₹ 13,295.69
L2: ₹ 12,635.50
L3: ₹ 11,940.25
L4: ₹ 11,245.00
#Dixon #Tradingview  Long
Long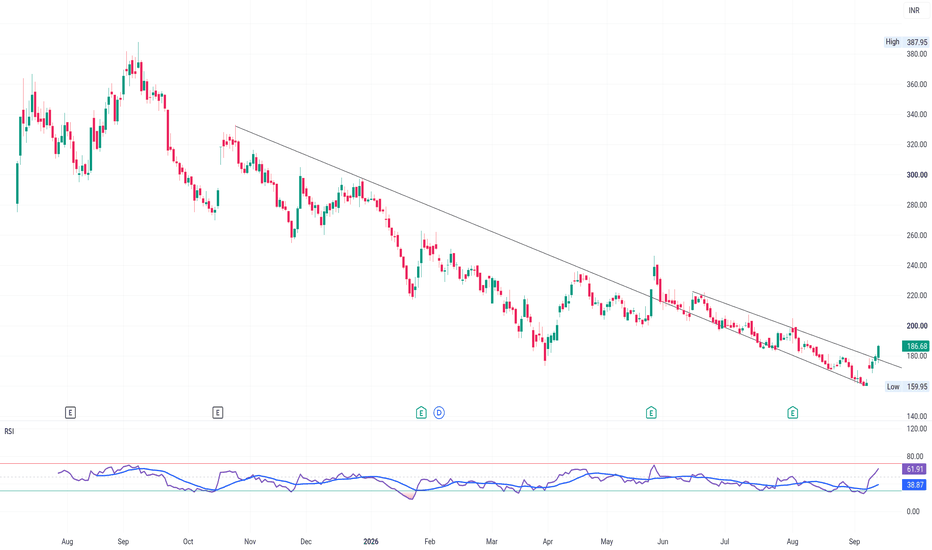
Maharashtra Seamless 🎯 STOCK TO WATCH
WEEKLY R4 MOMENTUM BREAKOUT SETUP
₹700–720 → ₹1,357 → ₹3,368
A seamless-pipe leader + oil & gas capex recovery + strong order-book + momentum setup appearing on my Weekly R4 Momentum Breakout Scanner.
🏭 MAHARASHTRA SEAMLESS LTD
NSE: MAHSEAMLES
📌 TRADE LEVELS
🟢 Buy Zone: ₹700–720
🟠 Breakout Zone: ₹689
🔴 Stop Loss: ₹560
🎯 Target 1: ₹1,357
🚀 Target 2: ₹3,368
🔥 WHY MAHARASHTRA SEAMLESS?
• Strong core business: Maharashtra Seamless is one of India's leading seamless-pipe manufacturers, with major exposure to oil & gas applications.
• Q1 FY27 PAT growth: Consolidated PAT came at ₹266.4 Cr, up 15.7% YoY.
• Core margins improved: Steel Pipes & Tubes segment profit increased 7.5% YoY, despite segment revenue declining, helped by lower material costs.
• Order book recovery: Order book reached approximately ₹1,709 Cr, up 31%, with a high-margin mix including oil & gas and exports.
• Capacity + value addition: The company continues to focus on value-added products, import substitution, exports and higher capacity utilisation.
• Strong financial flexibility: FY26 ended with ₹718.16 Cr consolidated PAT, while the company maintains substantial liquidity to navigate the steel-pipe cycle.
👀 WHY IT CAUGHT MY ATTENTION
📈 ₹689 is the key breakout reference on my R4 scanner.
📈 Order-book recovery is an important demand signal.
📈 Oil & gas remains a structural demand driver.
📈 Higher-margin oil & gas, export and specialty orders can improve the product mix.
📈 India's energy and pipeline infrastructure spending provides a longer-term runway.
📈 Strong balance-sheet flexibility gives the company room to invest through the cycle.
⚠️ IMPORTANT
There is an important earnings-quality caution here.
Q1 FY27 revenue from operations actually fell 4.7% YoY to ₹1,091 Cr, while reported PAT growth was partly supported by ₹174 Cr of other income.
The company also faced lower oil & gas tendering, Chinese import pressure and a gas-supply disruption that affected Q1 dispatches. Management expects dispatches to normalise, but Q2–Q3 execution will be crucial to validate the order-book recovery.
So this is not simply a PAT-growth story — the real trigger is whether order-book conversion + volumes + core pipe margins accelerate.
Risk Defined. Reward Visible.
⚠️ This content is for educational purposes only and not investment advice. Please do your own due diligence before making any investment decisions.
© 20K Microcap Investing | R4 Momentum Desk
#MaharashtraSeamless #MAHSEAMLES #SteelStocks #OilAndGas #SeamlessPipes #InfrastructureStocks #MomentumStocks #BreakoutStocks #IndianStocks #R4Momentum #StockToWatch  Long
Long
Solara Active Pharma 🎯 STOCK TO WATCH
WEEKLY R4 MOMENTUM BREAKOUT SETUP
₹730–740 → ₹1,593 → ₹1,857 → ₹4,041
A specialty API recovery + base-business acceleration + deleveraging + momentum setup appearing on my Weekly R4 Momentum Breakout Scanner.
💊 SOLARA ACTIVE PHARMA SCIENCES LTD
📌 TRADE LEVELS
🟢 Buy Zone: ₹730–740
🟠 Breakout Zone: ₹725
🔴 Stop Loss: ₹484
🎯 Target 1: ₹1,593
🚀 Target 2: ₹1,857
🔥 Target 3: ₹4,041
🔥 WHY SOLARA?
• Strong Q1 FY27 recovery: Consolidated revenue reached ₹384 Cr, up 20% YoY, while PAT rose 55% YoY to ₹16.3 Cr.
• Best profitability in 18 quarters: Management highlighted that Q1 FY27 delivered its highest EBITDA and PAT in 18 quarters.
• Base business accelerating: Base-business revenue grew 24% YoY to ₹307 Cr, making it the key earnings engine.
• Margin improvement: Q1 EBITDA was ₹63.5 Cr, with EBITDA margin around 17%, despite raw-material and supply-chain pressures.
• Deleveraging underway: Net debt declined to about ₹479 Cr, down roughly ₹135 Cr during the quarter, with management targeting sub-₹450 Cr by March 2027.
• Strategic optionality: Management is reviewing the Ibuprofen business, while also evaluating future CRAMS and other growth opportunities.
👀 WHY IT CAUGHT MY ATTENTION
📈 ₹725 is the key technical trigger on my R4 scanner.
📈 Base business growth is running significantly ahead of consolidated growth.
📈 EBITDA and PAT have reached multi-quarter highs.
📈 Debt reduction is improving the balance-sheet picture.
📈 Capacity utilisation across the base business is around 70%, leaving room for further growth.
📈 The potential resolution of the loss-making Ibuprofen business could materially improve consolidated earnings quality.
⚠️ IMPORTANT
This is a high-risk momentum setup, particularly because the business is still undergoing a strategic transition.
The Ibuprofen business remains loss-making, with management indicating quarterly EBITDA losses of roughly ₹10–15 Cr until the strategic review is resolved. The West Asia crisis has also created raw-material and supply-chain pressures.
So the key monitor is whether base-business growth + margin resilience + deleveraging can continue while the Ibuprofen overhang is addressed.
Risk Defined. Reward Visible.
⚠️ This content is for educational purposes only and not investment advice. Please do your own due diligence before making any investment decisions.
© 20K Microcap Investing | R4 Momentum Desk
#SolaraActivePharma #SOLARA #PharmaStocks #APIStocks #CDMO #MomentumStocks #BreakoutStocks #IndianStocks #R4Momentum #StockToWatch  Long
Long
AMD Industries🎯 STOCK TO WATCH
WEEKLY R4 MOMENTUM BREAKOUT SETUP
₹64 → ₹102 → ₹168 → ₹180
A packaging turnaround + sharp earnings acceleration + momentum setup appearing on my Weekly R4 Momentum Breakout Scanner.
📦 AMD INDUSTRIES LTD
📌 TRADE LEVELS
🟢 Buy Zone: ₹64
🟠 Breakout Zone: ₹64
🔴 Stop Loss: ₹42
🎯 Target 1: ₹102
🚀 Target 2: ₹168
🔥 Target 3: ₹180
🔥 WHY AMD INDUSTRIES?
• Strong Q1 FY27: Consolidated revenue was about ₹122 Cr, up 40.3% YoY.
• Explosive profit growth: Q1 PAT reached ₹9.12 Cr, up more than 500% YoY from ₹1.51 Cr.
• Margin expansion: Operating margin improved to 15.07%, versus 9.40% in Q1 FY26.
• Packaging specialist: AMD manufactures packaging solutions for beverages, food & FMCG, pharmaceuticals, paints, dairy and other industries.
• Strong customer ecosystem: The company counts major names including Coca-Cola, PepsiCo, AB InBev, Carlsberg, Heineken, Dabur and HUL among its customers.
• Large manufacturing footprint: AMD says it has 3+ manufacturing plants and capacity exceeding 8 billion pieces.
👀 WHY IT CAUGHT MY ATTENTION
📈 ₹64 is the key technical trigger on my R4 scanner.
📈 Q1 revenue grew more than 40% YoY.
📈 Operating profit grew sharply alongside revenue.
📈 PAT acceleration is particularly notable after a weak FY26 base.
📈 Packaging demand gives exposure to multiple consumer and industrial segments.
📈 The combination of earnings acceleration + margin expansion + technical momentum makes this one worth watching.
⚠️ IMPORTANT
The 500%+ PAT growth needs context — the comparable Q1 FY26 profit was only ₹1.51 Cr, so the percentage increase is magnified by the low base.
Also, AMD Industries is a small-cap packaging business, so execution, demand, input costs and working-capital requirements should be monitored. The key question now is whether the Q1 improvement can be sustained over the next few quarters.
Risk Defined. Reward Visible.
⚠️ This content is for educational purposes only and not investment advice. Please do your own due diligence before making any investment decisions.
© 20K Microcap Investing | R4 Momentum Desk
#AMDIndustries #AMDIND #PackagingStocks #SmallCapStocks #MomentumStocks #BreakoutStocks #IndianStocks #R4Momentum #StockToWatch  Long
Long
 Long
Long
 Long
Long
 Long
Long
 Long
Long
What Peter Lynch Saw FirstPeter Lynch became one of the most respected investors of his generation by doing something that sounds simple but is extremely difficult: finding businesses that were worth more than the market believed. From 1977 to 1990, he managed the Fidelity Magellan Fund and generated an exceptional long-term return. His approach was not about predicting every market move or finding the next hot stock. It was about understanding businesses, identifying changes in their fundamentals, and recognizing when the market had not yet fully appreciated those changes.
1. Fannie Mae: Seeing Value Others Missed
Fannie Mae became one of Peter Lynch's most successful investments and reportedly generated hundreds of millions of dollars in profit for Magellan. What made the investment interesting was not simply that the stock eventually went higher. Lynch kept studying the company's improving fundamentals and became increasingly convinced that the market was undervaluing its earning potential. He increased his position as his thesis became stronger. The lesson is important: a rising stock is not automatically a reason to sell if the business is improving even faster. Lynch was watching the company, not just the chart.
2. Ford: Understanding the Cycle
Ford showed another side of Lynch's investment style. The automobile industry is highly cyclical, which means earnings can change dramatically as economic conditions improve or deteriorate. Lynch recognized that Ford's earnings outlook was improving and understood that the market was beginning to revalue the company. Instead of assuming that a stock had become too expensive simply because it had already risen, he looked at whether the underlying business justified the new valuation. His approach highlights an important distinction: the question isn't simply whether a stock has gone up, but whether the company's future has improved enough to support the higher price.
3. Philip Morris: Finding Opportunity in an Unpopular Business
Philip Morris was another major winner for Magellan, and it demonstrated Lynch's willingness to invest in businesses that were not necessarily popular with the public. The company had powerful consumer brands and strong cash-generating characteristics, but its reputation could easily make investors overlook the underlying economics. Lynch focused on the business rather than the emotional reaction surrounding it. This is an important investing lesson because a company does not need to be admired to be a good investment. Sometimes the greatest opportunities exist where the business is stronger than the perception surrounding it.
4. MCI: Following Structural Growth
MCI gave Lynch exposure to the rapidly changing telecommunications industry and became one of Magellan's important successful investments. The opportunity was connected to a broader structural shift in the industry, where competition and technology were changing the way telecommunications businesses operated. Lynch understood that strong growth could create significant investment opportunities when the market had not fully priced the future potential. The key wasn't simply buying a company because its industry was growing. Lynch needed to understand how that growth translated into revenue, earnings and ultimately shareholder value.
5. Volvo: Looking Beyond the Obvious
Volvo demonstrated that Lynch was not restricted to familiar American companies. The Swedish automobile manufacturer became another meaningful contributor to Magellan's performance. International investing gave Lynch access to businesses that could be overlooked by investors focused entirely on the US market. But geographical diversification alone was not the reason for the investment. Lynch still needed to understand the company's business, competitive position and earnings potential. The lesson is straightforward: “invest in what you know” does not mean investing only in companies from your own country. It means refusing to invest in something you cannot understand.
The Pattern Behind the Winners
These five investments came from completely different industries, yet they shared something important. Lynch was constantly looking for a gap between **what the business was becoming and what the market believed it was worth**. Sometimes that gap came from improving earnings, sometimes from a cyclical recovery, sometimes from structural growth and sometimes from an unpopular business being underestimated. The industry itself was not the secret. The ability to recognize a change in the underlying business was.
That is where Lynch's philosophy becomes more interesting than the usual “buy what you know” advice. Seeing a popular product or a successful company is only the beginning. The real work starts when you ask why the company is succeeding, whether that success can continue, what the market already expects, and whether the current valuation leaves room for further upside. A great company can still be a terrible investment if everyone has already priced in its success.
The Real Peter Lynch Lesson:
Lynch did not need to predict exactly where the market would go next. He needed to find situations where reality could turn out to be better than expectations. That is why his biggest winners were not simply stocks that went up. They were businesses where the fundamental story became stronger than the market initially anticipated.
The most useful lesson from Peter Lynch is therefore not to copy his old stock picks. Fannie Mae, Ford, Philip Morris, MCI and Volvo belonged to a different market and a different era. The better lesson is to ask the same question Lynch was asking decades ago:
What is changing inside this business that the market may not have fully recognized yet?
That question is still relevant today.
By @BrightRally_Research  Education
 Long
Long
 Long
Long
 Long
Long
SBINSBIN — CONSOLIDATED MTF TRADE PLAN
Trade architecture
Entry 1: ₹991
Entry 2: ₹961
Average Entry: ₹976
SL: ₹933
Target: ₹1,164
At ₹976 average:
Risk: ₹43/share
Reward: ₹188/share
Gross RR: 4.37 : 1
Last high: ₹1,121
Target ₹1,164 requires a breakout beyond the previous high, so ₹1,121 is the first major confirmation/resistance point.
SBIN has a clear bullish alignment across HTF, MTF and ITF. The strongest technical feature is the repeated ₹940–₹961 demand zone appearing on Weekly, Daily, 240M, 180M and 60M.
Structure: HTF UP → MTF UP → ITF UP
Primary demand: ₹940–₹961
Key Gann level: ₹950
Breakout confirmation: ₹991
Invalidation: ₹933
Trade: Accumulate around ₹950–₹961, with ₹976 as the planned average entry. The ₹991 level should be treated more as confirmation than as the preferred fresh entry because risk increases above the demand zone.
From ₹976, risk to ₹933 is ₹43/share, while the primary target at ₹1,164 offers ₹188/share, giving approximately 4.37:1 price RR.
The trade should be managed in stages: ₹991 → ₹1,121 → ₹1,164. ₹1,121 is particularly important because it is the previous high; a sustained break above it strengthens the case for ₹1,164 and potentially the larger trend level at ₹1,234.
Bottom line:
₹940–₹961 = demand/accumulation zone | ₹950 = key reaction price | ₹970–₹991 = strength confirmation | ₹933 = hard invalidation | ₹1,121 = first major hurdle | ₹1,164 = primary target | ₹1,234 = extension.
The ₹940–₹961 multi-timeframe confluence is the core reason for the trade. Above ₹933, the bullish structure remains valid; below ₹933, the MTF setup should be considered invalid.  Long
Long
MARUTIMARUTI — MULTI-TIMEFRAME DEMAND & TRADE PLAN
1. MASTER DEMAND STRUCTURE
Level Timeframe Demand Zone Logic Trend
HTF-1 Yearly 9,737–13,680 Rally → Base → Rally UP
HTF-2 Half-Yearly 12,225–13,461 Rally → Base → Rally UP
HTF-3 Quarterly 10,725–13,461 BUFL / DMIP UP
MTF-1 Monthly 10,725–11,518 DMIP UP
MTF-2 Weekly 12,016–12,535 DMIP UP
MTF-3 Daily 12,201–12,424 DMIP UP
ITF 240M / 180M / 60M 12,201–12,424 DMIP UP
2. KEY CONFLUENCE
The 12,201–12,424 zone is the heart of the setup.
It is confirmed simultaneously by:
DAILY + 240M + 180M + 60M
and sits inside the Weekly demand zone of 12,016–12,535.
So the structure is:
HTF Structural Demand
↓
Weekly Demand: 12,016–12,535
↓
CORE EXECUTION DEMAND: 12,201–12,424
↓
ITF Confirmation: 240M / 180M / 60M
This is the strongest argument in favour of the trade.
3. TRADE EXECUTION
Entry 1: 12,424
Entry 2: 12,200
Average Entry: 12,312
Stop Loss: 12,201
Risk: 111 points
Target: 14,894
Reward: 2,582 points
Gross RR: 23.3 : 1
After the stated costs/interest assumptions:
Net RR: 14.72 : 1
4. PRICE ROADMAP
12,201 — SL / immediate invalidation
⬆
12,200–12,424 — 🔵 CORE DEMAND
⬆
12,312 — Average Entry
⬆
12,913–13,267 — 🟡 Gann Confluence
⬆
14,598 — Previous High
⬆
14,894 — 🎯 Trade Target
⬆
17,373 — Trend High
⬆
22,730 — Position Target
5. CAPITAL & PROFIT PLAN
Quantity: 200 shares
Total buy value: ₹24.62 lakh
MTF capital requirement: ₹8.62 lakh
Gross profit at 14,894: ₹5.16 lakh
Net profit after brokerage/taxes: ₹5.04 lakh
Interest: ~₹50,990
Final estimated net profit: ₹4.53 lakh
6. ONE-LINE INVESTMENT THESIS
MARUTI remains structurally bullish across HTF, MTF and ITF, with strong demand confluence at 12,201–12,424; an average entry near 12,312 offers tightly controlled downside versus a potential move toward 14,894 and beyond.
7. THE PPT HERO MESSAGE
MULTI-TIMEFRAME DEMAND CONFLUENCE
9,737–13,680 → Yearly
12,225–13,461 → Half-Yearly
10,725–13,461 → Quarterly
12,016–12,535 → Weekly
12,201–12,424 → DAILY + 240M + 180M + 60M
12,312 → Average Entry
12,201 → SL
14,894 → Target
BULLISH STRUCTURE | TIGHT INVALIDATION | ASYMMETRIC UPSIDE  Long
Long
 Long
Long
 Long
Long