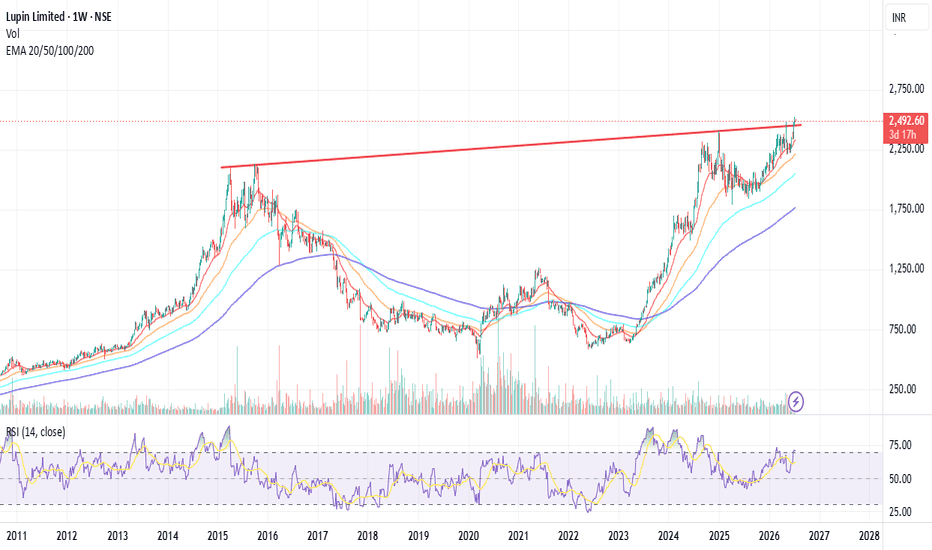
Long
Long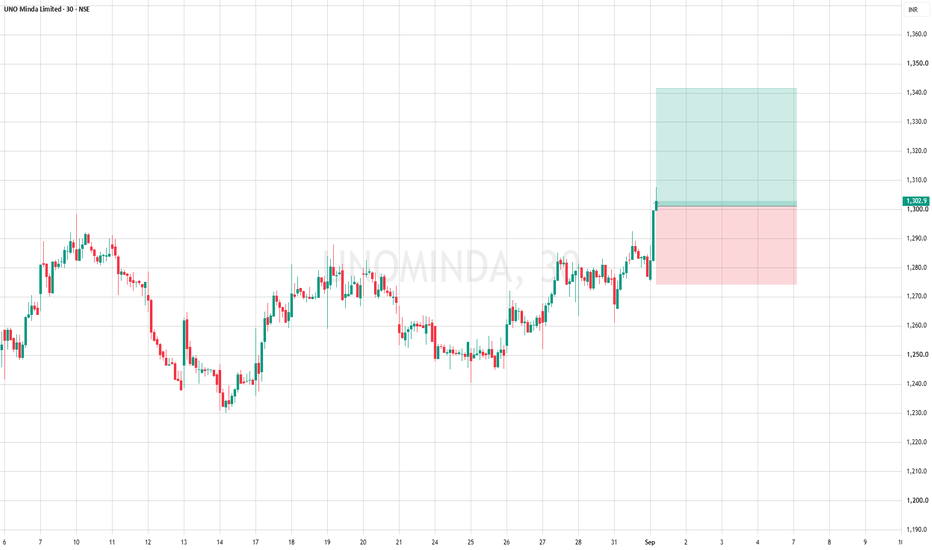
MCX Intraday Study — BTR Sell Setup 01 Sep 26Today’s MCX 15-minute chart shows a simple but important trading lesson: the setup comes first; the outcome comes later.
Price was holding around the 3,340–3,360 zone before the BTR Sell Signal appeared. After the signal, price gradually moved lower, with the bearish structure continuing to develop.
Setup Reference
🔴 BTR Sell Signal: around 3,340–3,350
🛑 SL / Invalidation: 3,400
🎯 T1: 3,241.5
🎯 T2: 3,162.3
🎯 T3: 3,083.0
At the time shown, MCX was around 3,308.5, so the move was progressing toward the first potential target.
The important part isn't the prediction
A setup like this should not be viewed as:
“Sell signal = price must fall.”
Instead, think of it as:
Signal → Defined invalidation → Potential levels → Wait for price action
If price moves against the setup and reaches the invalidation level, the setup has failed. If price moves in the expected direction, the predefined levels provide a framework for observation.
That distinction is important because no indicator can eliminate uncertainty from the market.
The real advantage of a structured chart is that it can help reduce emotional decisions:
❌ No chasing
❌ No revenge trading
❌ No changing the plan after every candle
❌ No assuming that one signal guarantees a result
✅ Define the setup
✅ Know where the idea becomes invalid
✅ Respect risk
✅ Let price develop
Trading is not about being right on every trade.
It is about being disciplined when you are wrong and patient when you are right.
📌 This is a technical chart study for educational purposes only. It is not a recommendation, solicitation, or assurance of returns. Market conditions can change rapidly and trading involves risk. Fiem IndBased on the daily chart for Fiem Industries Limited (FIEMIND), here is the technical breakdown along with key buy/sell action levels:
Technical Overview
Downtrend Retest at Base Support: After reaching a high near 2,674.8, the stock experienced a steep drop and is currently attempting to stabilize near a key support floor at 2,028.9 – 2,031.2.
Current Action: A green daily recovery candle is forming around 2,099.1 (+3.09%), indicating early interest from buyers right at the local low.
Volume Profile: Selling volume peaked during the mid-August drop and has since diminished, signaling selling exhaustion near the 2,030 baseline.
Levels (Buy/Sell Strategy)
Buy Level (Accumulation Zone): 2,030 – 2,100 (Current support zone where the risk-to-reward is favorable for a short-term bounce).
Target 1 (First Resistance): 2,291.3 (50% Fibonacci retracement level of the recent down-swing).
Target 2 (Major Resistance): 2,353.2 (61.8% Fibonacci retracement level).
Stop-Loss (Risk Level): Daily close below 2,020.0 (A breakdown invalidates the support and opens further downside).
Short-Term Setup
Bullish Rebound (Primary Trade): As long as the stock holds above 2,028.9, look for a relief rally pushing toward 2,291 (+9%) and 2,353 (+12%).
Bearish Continuation: A breakdown below 2,020 triggers an exit, as it breaks the horizontal support floor.
Disclaimer - All information on this page is for educational purposes only,
we are not SEBI Registered, Please consult a SEBI registered financial advisor for your financial matters before investing And taking any decision. We are not responsible for any profit/loss you made.
Request your support and engagement by liking and commenting & follow to provide encouragement
HAPPY TRADING 👍
 Long
Long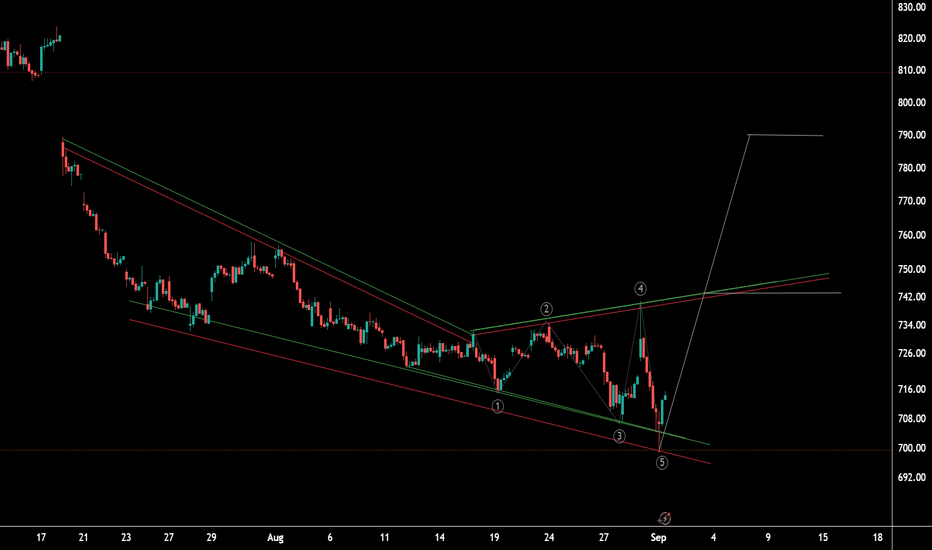
 Long
Long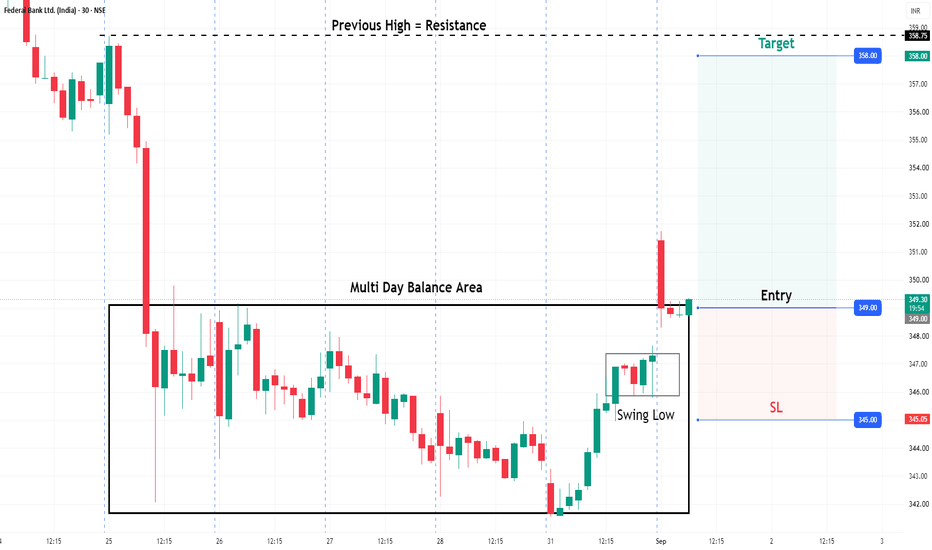
ADANIGREEN S/R
Support and Resistance Levels:
Support Levels: These are price points (green line/shade) where a downward trend may be halted due to a concentration of buying interest. Imagine them as a safety net where buyers step in, preventing further decline.
Resistance Levels: Conversely, resistance levels (red line/shade) are where upward trends might stall due to increased selling interest. They act like a ceiling where sellers come in to push prices down.
Breakouts:
Bullish Breakout: When the price moves above resistance, it often indicates strong buying interest and the potential for a continued uptrend. Traders may view this as a signal to buy or hold.
Bearish Breakout: When the price falls below support, it can signal strong selling interest and the potential for a continued downtrend. Traders might see this as a cue to sell or avoid buying.
MA Ribbon (EMA 20, EMA 50, EMA 100, EMA 200) :
Above EMA: If the stock price is above the EMA, it suggests a potential uptrend or bullish momentum.
Below EMA: If the stock price is below the EMA, it indicates a potential downtrend or bearish momentum.
Trendline: A trendline is a straight line drawn on a chart to represent the general direction of a data point set.
Uptrend Line: Drawn by connecting the lows in an upward trend. Indicates that the price is moving higher over time. Acts as a support level, where prices tend to bounce upward.
Downtrend Line: Drawn by connecting the highs in a downward trend. Indicates that the price is moving lower over time. It acts as a resistance level, where prices tend to drop.
Disclaimer:
I am not SEBI registered. The information provided here is for learning purposes only and should not be interpreted as financial advice. Consider the broader market context and consult with a qualified financial advisor before making investment decisions. ENGINEERS INDIA S/R
Support and Resistance Levels:
Support Levels: These are price points (green line/shade) where a downward trend may be halted due to a concentration of buying interest. Imagine them as a safety net where buyers step in, preventing further decline.
Resistance Levels: Conversely, resistance levels (red line/shade) are where upward trends might stall due to increased selling interest. They act like a ceiling where sellers come in to push prices down.
Breakouts:
Bullish Breakout: When the price moves above resistance, it often indicates strong buying interest and the potential for a continued uptrend. Traders may view this as a signal to buy or hold.
Bearish Breakout: When the price falls below support, it can signal strong selling interest and the potential for a continued downtrend. Traders might see this as a cue to sell or avoid buying.
MA Ribbon (EMA 20, EMA 50, EMA 100, EMA 200) :
Above EMA: If the stock price is above the EMA, it suggests a potential uptrend or bullish momentum.
Below EMA: If the stock price is below the EMA, it indicates a potential downtrend or bearish momentum.
Trendline: A trendline is a straight line drawn on a chart to represent the general direction of a data point set.
Uptrend Line: Drawn by connecting the lows in an upward trend. Indicates that the price is moving higher over time. Acts as a support level, where prices tend to bounce upward.
Downtrend Line: Drawn by connecting the highs in a downward trend. Indicates that the price is moving lower over time. It acts as a resistance level, where prices tend to drop.
Disclaimer:
I am not SEBI registered. The information provided here is for learning purposes only and should not be interpreted as financial advice. Consider the broader market context and consult with a qualified financial advisor before making investment decisions. GRASIM S/R
Support and Resistance Levels:
Support Levels: These are price points (green line/shade) where a downward trend may be halted due to a concentration of buying interest. Imagine them as a safety net where buyers step in, preventing further decline.
Resistance Levels: Conversely, resistance levels (red line/shade) are where upward trends might stall due to increased selling interest. They act like a ceiling where sellers come in to push prices down.
Breakouts:
Bullish Breakout: When the price moves above resistance, it often indicates strong buying interest and the potential for a continued uptrend. Traders may view this as a signal to buy or hold.
Bearish Breakout: When the price falls below support, it can signal strong selling interest and the potential for a continued downtrend. Traders might see this as a cue to sell or avoid buying.
MA Ribbon (EMA 20, EMA 50, EMA 100, EMA 200) :
Above EMA: If the stock price is above the EMA, it suggests a potential uptrend or bullish momentum.
Below EMA: If the stock price is below the EMA, it indicates a potential downtrend or bearish momentum.
Trendline: A trendline is a straight line drawn on a chart to represent the general direction of a data point set.
Uptrend Line: Drawn by connecting the lows in an upward trend. Indicates that the price is moving higher over time. Acts as a support level, where prices tend to bounce upward.
Downtrend Line: Drawn by connecting the highs in a downward trend. Indicates that the price is moving lower over time. It acts as a resistance level, where prices tend to drop.
Disclaimer:
I am not SEBI registered. The information provided here is for learning purposes only and should not be interpreted as financial advice. Consider the broader market context and consult with a qualified financial advisor before making investment decisions.  Long
Long
 Long
Long
 Long
Long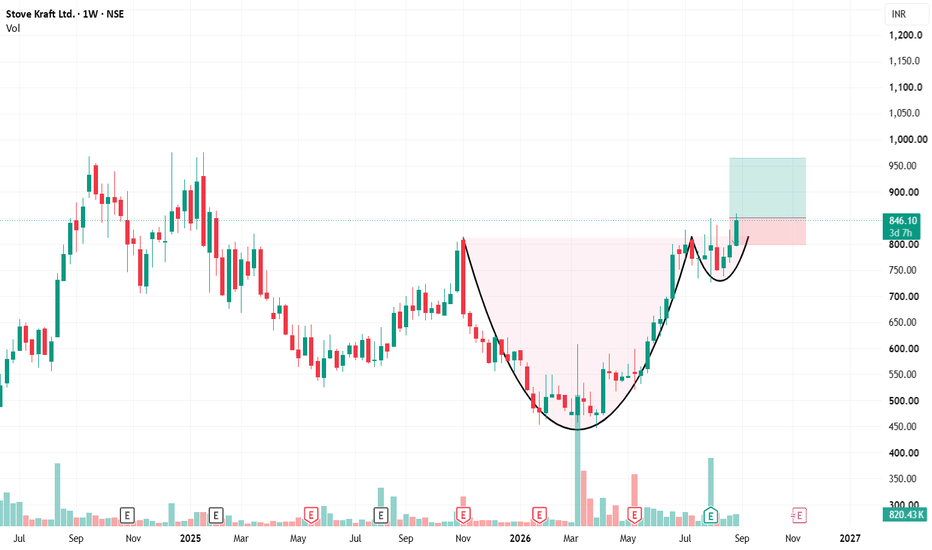
 Short
Short
RK FORGING## Ramkrishna Forgings Ltd. (CMP ₹743.00, NSE: RKFORGE)
**The SmartWay Research Desk | 1 September 2026**
A Kolkata‑based engineering company, incorporated in 1981. Ramkrishna Forgings is a leading manufacturer of **forged and machined components for automotive, railways, oil & gas, and heavy engineering sectors**, with strong domestic and export presence across Europe and North America.
**Promoter Holding (Jun 2026):** **Mahabir Prasad Agarwal Family — ~46.3% stake (no pledges)**
---
### FY22–FY26 Snapshot
- **Revenue Growth:** FY26 revenue ₹5,842 Cr vs ₹5,112 Cr in FY25 (+14.3% YoY). → **Good**
- **Net Profit:** FY26 PAT ₹812 Cr vs ₹702 Cr in FY25 (+15.7% YoY). → **Good**
- **Operating Margin:** FY26 EBITDA ₹1,412 Cr, margin 24.2% vs 23.5% last year (+70 bps). → **Good**
- **Equity Capital:** Stable, face value ₹2. → **Good**
- **Dividend Policy:** Dividend ₹6.00/share declared for FY26. → **Good**
- **Asset Building:** Investments in **capacity expansion, machining facilities, and EV component development**. → **Good**
- **Sales:** Strong demand from **OEMs in automotive and railways**. → **Good**
- **Expense:** Raw material cost pressures (steel, alloys) remain. → **Neutral/Good**
- **EPS:** FY26 EPS ₹22.25 vs ₹19.20 last year (+15.9%). → **Good**
---
### Institutional Interest & Ownership Trends (Jun 2026)
- **Promoter Holding:** ~46.3% (no pledges)
- **FII Holding:** ~22.8%
- **DII Holding:** ~20.6%
- **Retail & Others:** ~10.3%
---
### Strategic Moves & Innovations
- Expansion in **EV components and lightweight forgings**.
- Focus on **railway and heavy engineering supplies**.
- Partnerships with **global OEMs for long‑term contracts**.
- Diversification into **oil & gas and aerospace forgings**.
---
### Cash Flow & Balance Sheet Strength
- Market cap ~₹12,800 Cr.
- Debt‑to‑equity ratio ~0.52 (moderate leverage).
- Book value per share ₹182.00; P/B ~4.1.
- EPS (TTM) ₹22.25; P/E ~33.4.
---
### Risk Factors
- High **P/E ratio ~33.4**, valuations expensive.
- Dependence on **automotive demand cycles and exports**.
- Exposure to **commodity price volatility (steel, alloys)**.
- Competition from Bharat Forge, Sundaram Fasteners, and MM Forgings.
---
### Investor Takeaway
Ramkrishna Forgings has delivered **robust FY26 performance**, supported by OEM demand, EV component expansion, and railway supplies. With strong promoter backing (Agarwal Family, 46.3% stake), dividend payouts, and leadership in forgings, RK Forgings remains a **mid‑cap auto ancillary and engineering play**. At CMP ₹743.00, valuations are **expensive (P/E ~33.4, P/B ~4.1)**, reflecting growth expectations but also sectoral risks.  Long
Long
 Long
Long
TVS Srichakra 🛞 STOCK TO WATCH 🛞
₹5,500–5,510 → ₹7,201 → ₹8,262 → ₹9,383 👀
A premium auto-component name showing up on my Weekly R4 Momentum Breakout Scanner.
TVS Srichakra Ltd.
📌 Buy Zone: ₹5,500–5,510
📌 Breakout Zone: ₹5,496
🛑 Stop Loss: ₹4,422
🎯 Target 1: ₹7,201
🎯 Target 2: ₹8,262
🎯 Target 3: ₹9,383
Why TVS Srichakra?
🚗 Established tyre manufacturer: TVS Srichakra is part of the TVS Group and manufactures tyres, tubes and flaps, with a strong presence in two-wheelers, three-wheelers and other automotive applications.
📈 Q1 FY27 revenue growth: Consolidated revenue rose 30.3% YoY to ₹1,067.61 Cr.
💰 PAT surged: Q1 FY27 consolidated PAT increased 164.1% YoY to ₹34.02 Cr.
🔥 Strong operating improvement: EBITDA rose 88.6% YoY to ₹95.02 Cr, while EBITDA margin expanded to 8.9% from 6.2%.
🌍 Export opportunity: The company has an established international presence across multiple markets, supporting its diversified customer base.
Why It Caught My Attention
✅ 30%+ Q1 revenue growth
✅ 164%+ PAT growth
✅ 88%+ EBITDA growth
✅ Significant margin expansion
✅ Strong automotive tyre franchise
✅ TVS Group pedigree
🔥 Weekly R4 Momentum Breakout
⚠️ Important: The operating recovery is encouraging, but Q1 PAT also benefited from ₹14.21 Cr of other income, including a tariff-refund receivable, so the quality and sustainability of earnings should be monitored.
Risk Defined. Reward Visible.
📢 Disclaimer: This content is for educational purposes only and not investment advice. Please do your own due diligence before making any investment decisions.
© 20K Microcap Investing | R4 Momentum Desk
#TVSSrichakra #TVSSRICHAK #TyreStocks #AutoComponent #AutomotiveStocks #TVSGroup #SmallCapStocks #StockMarketIndia #IndianStocks #StocksToWatch #R4Breakout #MomentumInvesting #20KMicrocap  Long
Long
 Long
Long
Stove Craft 🍳 STOCK TO WATCH 🍳
₹830–840 → ₹1,373 → ₹2,083 → ₹2,786 👀
A consumer-durables name appearing on my Weekly R4 Momentum Breakout Scanner.
Stove Kraft Ltd.
📌 Buy Zone: ₹830–840
📌 Breakout Zone: ₹821
🛑 Stop Loss: ₹615
🎯 Target 1: ₹1,373
🎯 Target 2: ₹2,083
🎯 Target 3: ₹2,786
Why Stove Kraft?
🍳 Strong kitchenware franchise: The company operates well-known brands including Pigeon and StoveKraft, with a broad portfolio across kitchen and household appliances.
🏠 Consumer durables theme: Exposure to pressure cookers, cookware and small domestic appliances gives the company a direct play on India's rising household consumption.
🌍 Distribution reach: The business has built a wide distribution network across India and an international presence.
🏭 Manufacturing capabilities: In-house manufacturing and backward integration provide opportunities for better control over cost, quality and product development.
📈 Momentum setup: The ₹821–₹840 region is the key technical area, with ₹821 identified as the breakout level by the scanner.
Why It Caught My Attention
✅ Strong consumer-durables theme
✅ Recognised Pigeon & StoveKraft brands
✅ Kitchenware + small-appliance opportunity
✅ Broad distribution footprint
✅ Manufacturing capabilities
✅ Multiple upside levels
🔥 Weekly R4 Momentum Breakout
⚠️ HIGH RISK – HIGH REWARD SETUP. The ₹615 level is the defined stop-loss. With such a wide target range, disciplined position sizing and avoiding price chasing are essential.
Risk Defined. Reward Visible.
📢 Disclaimer: This content is for educational purposes only and not investment advice. Please do your own due diligence before making any investment decisions.
© 20K Microcap Investing | R4 Momentum Desk
#StoveKraft #STOVEKRAFT #Pigeon #ConsumerDurables #KitchenwareStocks #SmallCapStocks #ConsumerStocks #StockMarketIndia #IndianStocks #StocksToWatch #R4Breakout #MomentumInvesting #20KMicrocap Long 
Manali Petrochemicals 🧪 STOCK TO WATCH 🧪
₹80 → ₹168 👀
A petrochemical turnaround/momentum name appearing on my Weekly R4 Momentum Breakout Scanner.
Manali Petrochemicals Ltd.
📌 Buy Zone: ₹80
📌 Breakout Zone: ₹80
🛑 Stop Loss: ₹57
🎯 Target: ₹168
Why Manali Petrochemicals?
🚀 Massive Q1 FY27 profit acceleration: Consolidated PAT jumped 348.8% YoY to ₹64.36 Cr.
📈 Revenue growth: Q1 FY27 total income reached ₹288.49 Cr, up 18.9% YoY.
🔥 Operating profit surge: Operating profit increased 262.7% YoY to ₹82.80 Cr, compared with ₹22.83 Cr in Q1 FY26.
💰 Strong PBT growth: PBT rose 323.5% YoY to ₹84.53 Cr.
🏭 Specialised petrochemical portfolio: Manali Petrochemicals manufactures propylene oxide, propylene glycol, polyether polyols and polyester polyols, serving industries such as automotive, appliances, furniture, footwear, coatings and pharmaceuticals.
📊 Operating leverage: Q1 operating margin improved sharply, with reported operating margin around 26.9%.
Why It Caught My Attention
✅ 18%+ revenue growth
✅ 348%+ PAT growth
✅ 262%+ operating-profit growth
✅ 323%+ PBT growth
✅ Strong margin expansion
✅ Specialised petrochemical products
✅ Auto + appliance + industrial exposure
✅ Weekly R4 Momentum Breakout
⚠️ HIGH RISK – HIGH REWARD SETUP. The ₹57 level is the defined stop-loss. Petrochemical earnings can be cyclical, so sustained margins and product realisations need to be monitored.
Risk Defined. Reward Visible.
📢 Disclaimer: This content is for educational purposes only and not investment advice. Please do your own due diligence before making any investment decisions.
© 20K Microcap Investing | R4 Momentum Desk
#ManaliPetrochemicals #MANALIPETC #PetrochemicalStocks #ChemicalStocks #SpecialtyChemicals #AutoAncillary #IndustrialStocks #SmallCapStocks #StockMarketIndia #IndianStocks #StocksToWatch #R4Breakout #MomentumInvesting #20KMicrocap Long 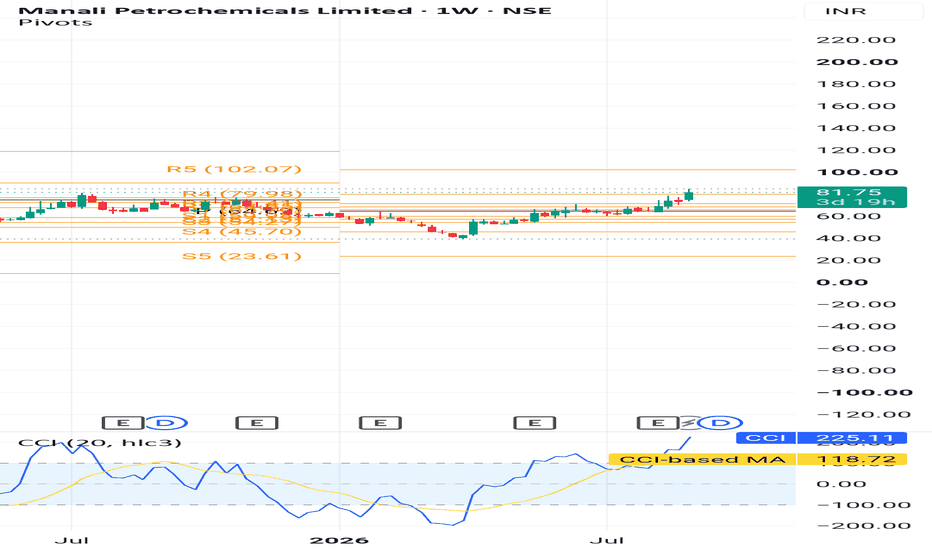
Kalyani Forge⚒️ STOCK TO WATCH ⚒️
₹860–870 → ₹1,347 👀
A strong auto-forging/engineering name appearing on my Weekly R4 Momentum Breakout Scanner.
Kalyani Forge Ltd.
📌 Buy Zone: ₹860–870
📌 Breakout Zone: ₹853
🛑 Stop Loss: ₹670
🎯 Target: ₹1,347
Why Kalyani Forge?
🚗 Auto & engineering exposure: Kalyani Forge manufactures forged, machined and assembled components for automotive, construction, power, railways and industrial applications.
📈 Sharp Q1 FY27 profit growth: PAT rose 218% YoY to ₹4.48 Cr, while operating profit increased ~95% YoY.
🔥 Margin expansion: Management reported Q1 EBITDA margin of 16.2%, up 640 bps YoY from 9.3%.
💎 ROCE crossed 20%: Q1 FY27 ROCE reached 22%, crossing the company's 20% target for the first time.
📦 New order wins: New engine and wheel-hub component orders from marquee global customers are progressing through sample validation.
💰 Efficiency + deleveraging: Cash-conversion cycle improved to 148 days from 168 days, while management highlighted a continuing deleveraging trend.
Why It Caught My Attention
✅ 218%+ YoY PAT growth
✅ ~95% operating-profit growth
✅ EBITDA margin expanded 640 bps
✅ ROCE crossed 20%
✅ New global customer orders
✅ Improving cash-conversion cycle
✅ Auto + industrial engineering exposure
✅ Weekly R4 Momentum Breakout
⚠️ HIGH RISK – HIGH REWARD SETUP. The defined stop-loss is ₹670. The stock has already shown significant recent volatility, so disciplined position sizing is important. Recent trading data shows sharp price swings during August.
Risk Defined. Reward Visible.
📢 Disclaimer: This content is for educational purposes only and not investment advice. Please do your own due diligence before making any investment decisions.
© 20K Microcap Investing | R4 Momentum Desk
#KalyaniForge #KALYANIFRG #AutoAncillary #ForgingStocks #EngineeringStocks #AutoComponents #SmallCapStocks #StockMarketIndia #IndianStocks #StocksToWatch #R4Breakout #MomentumInvesting #20KMicrocap  Long
Long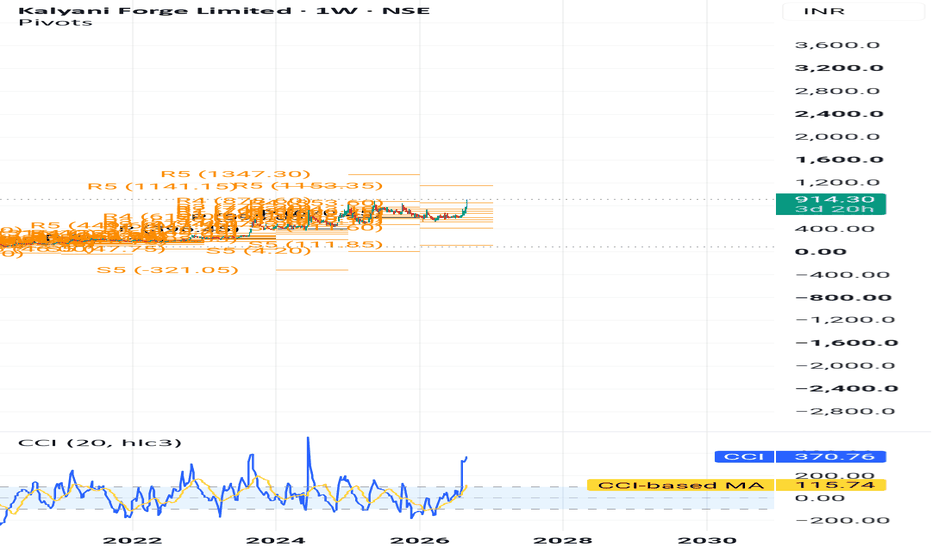
 Long
Long