RK FORGINGRamkrishna Forgings Ltd. (CMP ₹726.00, NSE: RKFORGE)
The SmartWay Research Desk | 10 August 2026
A Kolkata‑based forging and engineering company, incorporated in 1981. Ramkrishna Forgings is a leading supplier of forged components for automotive, railways, oil & gas, and heavy engineering sectors, with strong export presence in the US and Europe.
Promoter Holding (Mar 2026): Mahabir Prasad Agarwal Family — 47.5% stake (no pledges)
FY22–FY26 Snapshot
Revenue Growth: FY26 revenue ₹4,842 Cr vs ₹4,212 Cr in FY25 (+15.0% YoY). → Good
Net Profit: FY26 PAT ₹512 Cr vs ₹438 Cr in FY25 (+16.9% YoY). → Good
Operating Margin: FY26 EBITDA ₹812 Cr, margin 16.8% vs 16.2% last year (+60 bps). → Good
Equity Capital: Stable, face value ₹2. → Good
Dividend Policy: Dividend ₹5.00/share declared for FY26. → Good
Asset Building: Investments in capacity expansion and EV component manufacturing. → Good
Sales: Strong demand from OEMs in commercial vehicles and railways. → Good
Expense: Raw material cost pressures (steel, alloys) remain. → Neutral/Good
EPS: FY26 EPS ₹17.25 vs ₹14.80 last year (+16.6%). → Good
Institutional Interest & Ownership Trends (Mar 2026)
Promoter Holding: 47.5% (no pledges)
FII Holding: 22.12%
DII Holding: 18.34%
Retail & Others: 12.06%
Strategic Moves & Innovations
Expansion in EV and lightweight forged components.
Focus on railway and export markets (US, Europe).
Partnerships with global OEMs for long‑term supply contracts.
Diversification into oil & gas and defense forgings.
Cash Flow & Balance Sheet Strength
Market cap ~₹12,800 Cr.
Debt‑to‑equity ratio ~0.48 (moderate leverage).
Book value per share ₹182.40; P/B ~4.0.
EPS (TTM) ₹17.25; P/E ~42.1.
Risk Factors
High P/E ratio ~42.1, valuations expensive.
Dependence on automotive demand cycles and exports.
Exposure to commodity price volatility (steel).
Competition from Bharat Forge, MM Forgings, and Sundram Fasteners.
Investor Takeaway
Ramkrishna Forgings has delivered steady FY26 performance, supported by OEM demand, export growth, and EV component expansion. With strong promoter backing, dividend payouts, and leadership in forged components, Ramkrishna remains a mid‑cap auto ancillary and engineering play. At CMP ₹726.00, valuations are expensive (P/E ~42.1, P/B ~4.0), reflecting growth expectations but also sectoral risks.  Long
Long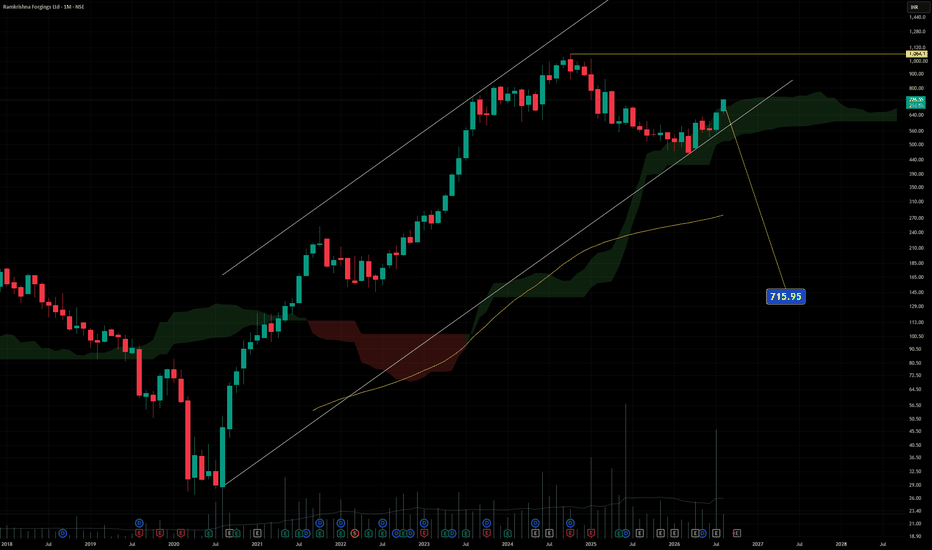
 Long
Long

 Long
Long
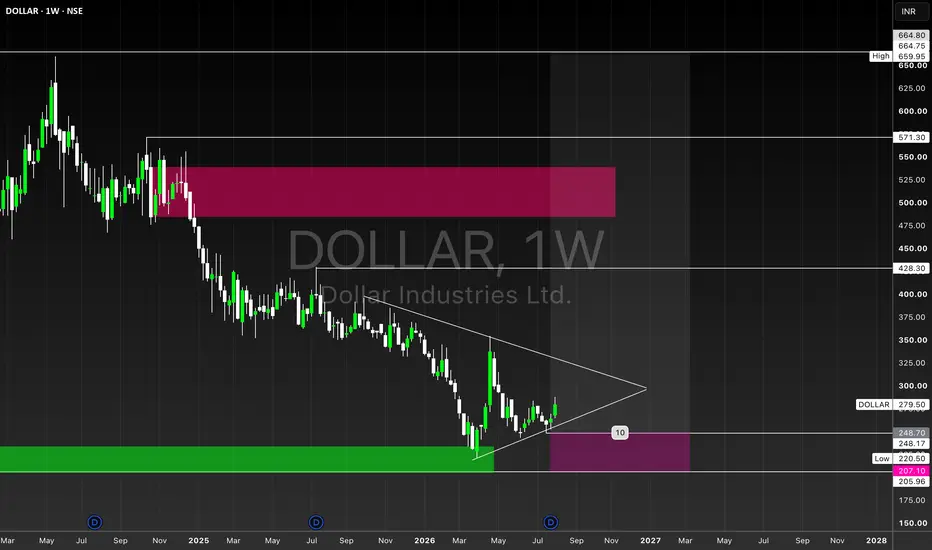
DOLLAR WEEKLY SWING# **DOLLAR | Weekly Trade Setup**
## **Executive Summary**
**Ticker:** DOLLAR
**Company:** Dollar Industries Ltd.
**Timeframe:** 1W
**CMP:** ₹279.50
**Bias:** 🟢 **Bullish Reversal / Accumulation**
**Preferred Entry:** **₹220–₹248**
**Primary Entry:** **₹248–₹249**
**Stop Loss:** **₹207**
**Setup Quality:** **8.1/10**
DOLLAR is developing a **large weekly compression/triangle structure** after an extended decline. Price has reacted from the lower boundary of the structure and is currently trading above the marked weekly demand/FVG zone.
The key opportunity is a **retracement into ₹220–₹248**, rather than chasing the current ₹279.50 price.
---
# 🧭 1. Weekly Market Structure
The broader chart shows a prolonged bearish phase from the ₹600+ region.
However, the character of price action has changed:
**Major decline → lower lows → base formation → higher reaction → compression**
The current structure resembles a **large contracting triangle / accumulation-type formation**.
The rising lower trendline is particularly important because it has been supporting the recent lows.
### Current condition
* 🔴 Historical HTF trend: **Bearish**
* 🟡 Current structure: **Compression / transition**
* 🟢 Location: **Near weekly discount**
* 🟢 Demand/FVG: **₹220–₹248**
* 🟢 Upside liquidity: **₹428 → ₹571 → ₹660**
---
# 🎯 2. Preferred Entry Zone
### **₹220–₹248**
This is the most important zone on the chart.
The green area represents the major weekly demand/FVG region.
### Preferred execution
**₹248–₹249 → first entry**
If price gives a deeper retracement:
**₹220–₹235 → stronger accumulation zone**
The ideal sequence is:
**Retracement → liquidity sweep/rejection → bullish displacement → entry**
### ⚠️ Current price: ₹279.50
I would **not chase ₹279–₹300** purely from this weekly chart.
The risk/reward becomes considerably better closer to the marked demand zone.
---
# 🛑 3. Stop Loss
### **₹207**
This sits below the marked external low / demand structure.
A decisive weekly acceptance below ₹207 would materially weaken the bullish thesis.
Therefore:
**₹207 = structural invalidation**
Position sizing should be calculated from the actual entry-to-SL distance.
---
# 📈 4. Liquidity Roadmap
## **TP1 — ₹428**
This is the first major upside objective visible on the chart.
It also represents an important internal liquidity/structure level.
From ₹248:
**≈ +73%**
---
## **TP2 — ₹571**
This is the next major HTF liquidity level.
It sits near the upper portion of the current large-range structure.
From ₹248:
**≈ +130%**
This would require a significant structural expansion.
---
## **TP3 / Extended — ₹660**
The major external high is approximately **₹659–₹660**.
This represents the full bullish recovery scenario toward the previous external range high.
From ₹248:
**≈ +166%**
This is an **extended objective**, not a guaranteed target.
---
# 📊 5. Risk / Reward
Using approximately **₹248 entry / ₹207 SL**:
| Level | Price | Approx. R |
| ------- | ----: | --------: |
| **SL** | ₹207 | -1R |
| **TP1** | ₹428 | ~4.4R |
| **TP2** | ₹571 | ~7.9R |
| **TP3** | ₹660 | ~10R |
This provides an attractive asymmetric setup **if the ₹220–₹248 demand zone continues to hold**.
---
# 🔍 6. Key Technical Confluences
### 🟢 Bullish
* Weekly discount location
* Major weekly demand/FVG
* Rising lower trendline
* External low around ₹220
* Long-term compression structure
* Price has already demonstrated a reaction from the lower boundary
* Large upside liquidity pools
* Significant distance between current demand and HTF resistance
### 🔴 Bearish / Risk
* Long-term trend is still technically bearish
* Price remains below the major descending structural resistance
* Triangle can resolve in either direction
* ₹428 is substantial resistance
* Failure of ₹207 can expose the setup to further downside
---
# 🧠 7. Execution Model
### **Aggressive**
**₹248–₹249**
Enter only if the zone holds and price demonstrates rejection.
### **Preferred**
Wait for:
**₹220–₹248 mitigation**
↓
**Liquidity sweep / rejection**
↓
**Bullish displacement**
↓
**Retest**
↓
**LONG**
### **Conservative**
Wait for a weekly breakout from the compression structure and then look for a successful retest.
This provides stronger confirmation but gives up some entry advantage.
---
# 🔄 8. Alternative Bearish Scenario
If DOLLAR breaks below:
### **₹207**
and establishes weekly acceptance underneath it:
**Bullish setup invalidated.**
In that scenario, the current accumulation thesis should be abandoned rather than averaging blindly into weakness.
---
# 🏆 Final Trade Thesis
> **DOLLAR is developing a major weekly compression structure after a prolonged decline. Price is currently above a significant weekly demand/FVG zone, with a rising structural trendline supporting the lower boundary. The preferred strategy is to wait for a retracement into ₹220–₹248 rather than chase ₹279+, with ₹207 as structural invalidation. If the demand zone holds and bullish confirmation appears, the upside liquidity roadmap is ₹428 → ₹571 → ₹660.**
### **TRADE PLAN**
**Entry:** ₹220–₹248
**Preferred Entry:** ₹248
**SL:** ₹207
**TP1:** ₹428
**TP2:** ₹571
**TP3:** ₹660
**Bias:** 🟢 Bullish reversal
**Setup Quality:** **8.1/10**
**Execution:** **WAIT → RETRACEMENT → CONFIRMATION → EXECUTE**
---
### ⚠️ Disclaimer
**This analysis is for educational and informational purposes only and does not constitute investment advice, financial advice, or a recommendation to buy or sell any security.** The levels and scenarios are based on technical analysis of the provided chart and may fail as market conditions change. Trading and investing involve substantial risk, including possible loss of capital. Always conduct your own research, verify current market and fundamental conditions, and apply appropriate position sizing and risk management. **Past performance does not guarantee future results.**
 Long
Long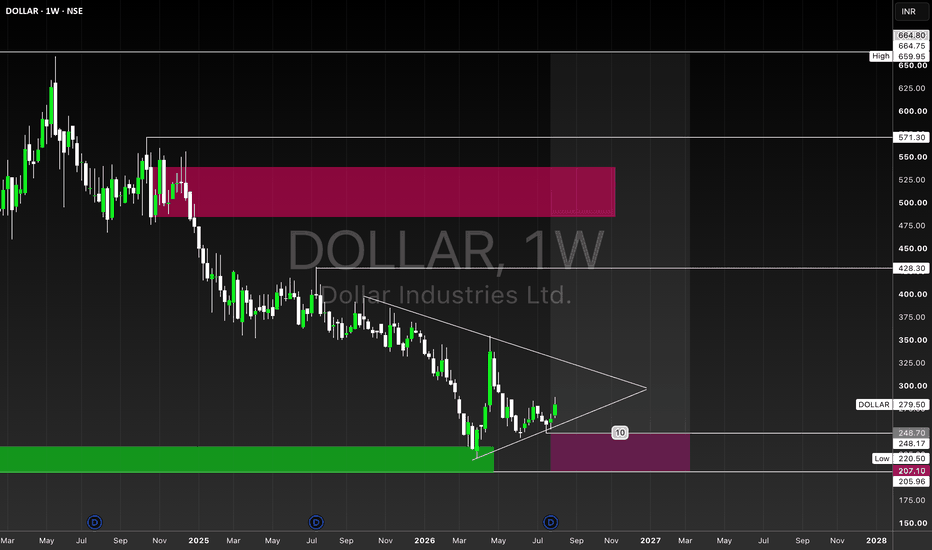
COCHINSHIP SWING SETUP# **COCHINSHIP | Weekly Trade Setup**
### **Executive Summary**
**Ticker:** COCHINSHIP
**Timeframe:** 1W
**CMP:** ₹1,519.70
**Bias:** 🟢 **Bullish Reversal / Accumulation**
**Preferred Entry:** **₹1,420–₹1,435**
**Stop Loss:** **₹1,332**
**Setup Quality:** **8.4/10**
Cochin Shipyard is positioned in the **weekly discount region**, with price holding above a rising long-term trendline and a visible **+FVG** around the preferred entry zone.
The setup offers an attractive **risk-to-reward profile**, but confirmation remains important because the broader weekly structure has not fully transitioned bullish.
---
## 🎯 Trade Plan
| Level | Price | Role |
| ------------ | ------------: | ----------------------- |
| **Entry** | ₹1,420–₹1,435 | Discount + FVG |
| **SL** | ₹1,332 | Structural invalidation |
| **TP1** | ₹1,981 | First IRL liquidity |
| **TP2** | ₹2,274 | Second liquidity target |
| **TP3** | ₹2,550–₹2,562 | Major IRL liquidity |
| **Extended** | ₹2,978 | External high |
### 📊 Approx. Risk/Reward
Using **₹1,435 entry / ₹1,332 SL**:
* **TP1:** ~5.3R
* **TP2:** ~8.1R
* **TP3:** ~10.8R
* **Extended:** ~15R
---
## 🔍 Key Confluences
### 🟢 Bullish Factors
* Weekly **discount** location
* +FVG around the entry region
* Long-term rising trendline support
* Price has stabilized following the previous decline
* Significant liquidity targets above
* Large upside imbalance zones remain unfilled
### 🔴 Risk Factors
* Weekly structure is not yet fully bullish
* **₹1,750–₹1,850** contains significant bearish IFVG resistance
* ₹2,274–₹2,700 contains substantial overhead supply
* A decisive breakdown below **₹1,332** invalidates the setup
---
## 🧠 Execution
**Preferred sequence:**
**₹1,420–₹1,435 retracement**
↓
Bullish reaction / confirmation
↓
**₹1,981**
↓
**₹2,274**
↓
**₹2,550–₹2,562**
↓
**₹2,978 extended**
### ⚠️ Do Not Chase
Current price is around ₹1,520. The chart provides a better risk-defined location around **₹1,420–₹1,435**.
If price reaches TP1, consider partial profit-taking and protect the remaining position.
---
## 🔄 Alternative Scenario
If price breaks and establishes weekly acceptance below **₹1,332**:
**Bullish thesis invalidated.**
The next major downside reference visible on the chart is approximately **₹1,168**.
---
# **Final Trade Thesis**
> **COCHINSHIP is positioned in weekly discount with supportive FVG and long-term trendline structure. The preferred strategy is to wait for a retracement into ₹1,420–₹1,435 rather than chase price, with ₹1,332 as structural invalidation. The upside liquidity roadmap is ₹1,981 → ₹2,274 → ₹2,550–₹2,562, with ₹2,978 as the extended objective.**
**ENTRY:** ₹1,420–₹1,435
**SL:** ₹1,332
**TP1:** ₹1,981
**TP2:** ₹2,274
**TP3:** ₹2,550–₹2,562
**EXTENDED:** ₹2,978
**Execution:** **WAIT → RETRACEMENT → CONFIRMATION → EXECUTE**
---
### ⚠️ Disclaimer
**This analysis is for educational and informational purposes only and does not constitute investment advice, financial advice, or a recommendation to buy or sell any security.** Trading and investing involve substantial risk, including the possible loss of capital. The levels and scenarios shown are based solely on technical analysis of the provided chart and may fail as market conditions change. Always conduct your own research, verify fundamentals and market conditions, and use appropriate position sizing and risk management. **Past performance does not guarantee future results.**
 Long
Long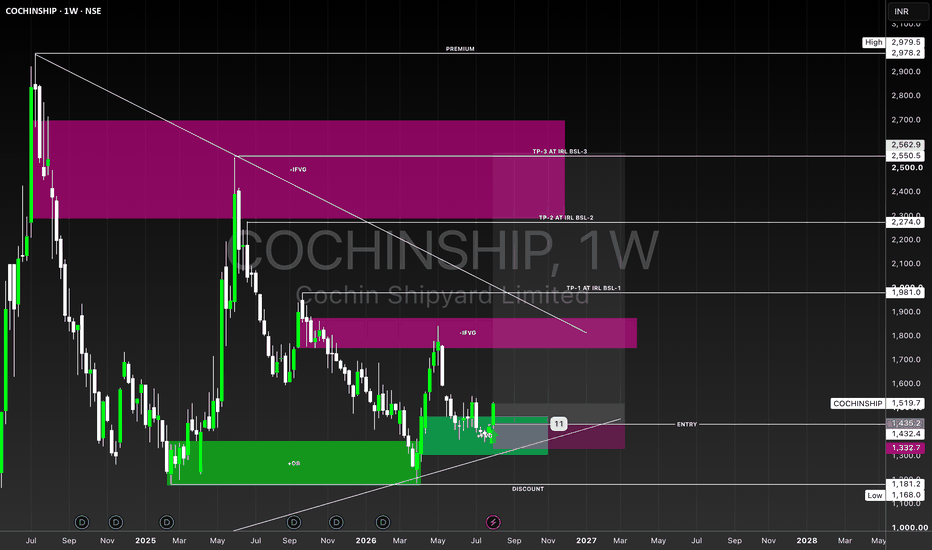
HINDALCO: 1H Impulsive Breakout & Dynamic Moving Average Ribbon 📊 Hindalco Industries Limited (HINDALCO) - 1-Hour (1H) Chart Analysis
This post is shared for EDUCATIONAL PURPOSES ONLY to analyze short-term impulse breakouts, volume expansion dynamics, and dynamic moving average stack alignment. It is not financial or investment advice.
🎯 Educational Swing Setup:
• Entry Zone: 1,030.00 – 1,055.00 (Sizing into position blocks near current levels, or accumulating on minor 1H pullbacks toward the 1,035.00 green EMA support shelf).
• Target 1: 1,130.00 (Near-term key structural supply / consensus price target zone)
• Target 2: 1,175.00 (Major 52-week peak structural retest target)
• Invalidation / Stop-Loss: 980.00 (A definitive hourly candle close back below the pink long-term EMA baseline invalidates this bullish momentum setup).
• Expected Duration: 4 to 10 Trading Days (Short-term 1H swing view)
⚠️ Risk Management:
Since the 1H RSI is currently running in strong momentum territory (78.36), a brief high-level consolidation or minor retest around the 1,035.00 zone is normal technical behavior. Keep your position sizing disciplined and manage your risk strictly!  Long
Long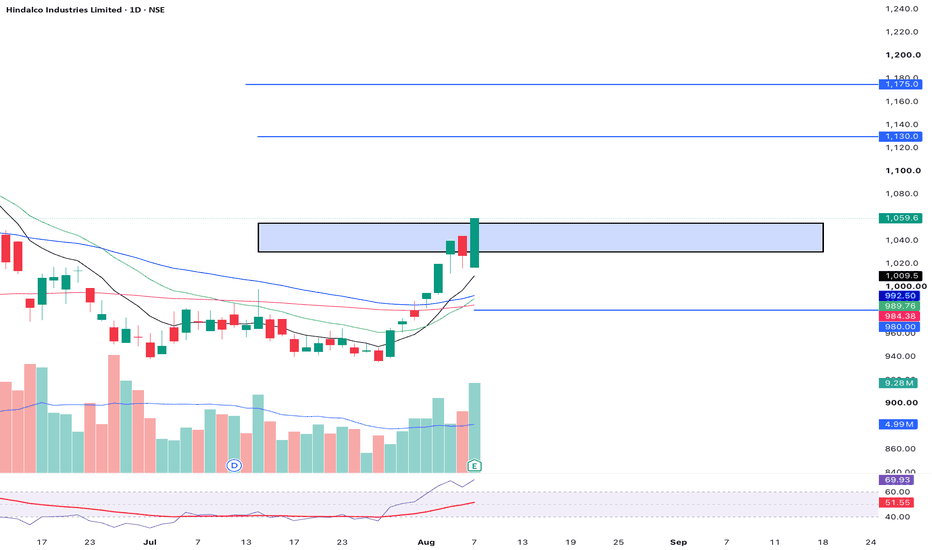
 Long
Long
NAVIN FLUORINENAVIN FLUORINE – MTF TRADE VIEW
Overall Bias: 🟢 Strong Bullish
Navin Fluorine has a well-aligned bullish structure across HTF, MTF and ITF. Unlike a setup that is dependent on one timeframe, here the demand zones are stacked progressively higher, indicating sustained buying interest and a healthy upward structure.
1. Structure
HTF: Yearly, Half-Yearly and Quarterly → UP
MTF: Monthly, Weekly and Daily → UP
ITF: 240M, 180M and 60M → UP
Gann: UP
Immediate ITF demand is concentrated around ₹7,371–₹7,548.
Daily demand extends from ₹7,378–₹7,936, giving strong support to the current structure.
The key takeaway is that ₹7,378–₹7,548 is the critical support cluster. As long as this area holds, the broader bullish structure remains intact.
2. Trade Setup
Entry Zone: ₹7,527–₹7,936
Average Entry: ₹7,732
Stop Loss: ₹7,378
Primary Target: ₹9,127
Position Target: ₹9,347
The entry is being taken within the Daily/ITF demand structure, making this a continuation trade rather than a deep-value entry.
3. Key Levels
Level Significance
₹9,347 Extended positional target
₹9,127 Primary target
₹8,762 Recent high / intermediate resistance
₹7,936 Daily demand upper boundary
₹7,732 Average entry
₹7,548 ITF demand
₹7,378 Critical support / SL
4. Trade Logic
The setup can be viewed as:
₹7,378–₹7,548 Support → ₹7,732 Entry → ₹8,762 Breakout → ₹9,127 Target → ₹9,347 Extension
The most important near-term level is ₹8,762, the recent high. A sustained breakout above this level would confirm that the stock is resuming its upward momentum and would improve the probability of reaching ₹9,127.
If the stock retraces, ₹7,378–₹7,548 should act as the key demand area. A decisive break below ₹7,378 would invalidate the current setup.
5. Risk–Reward
At ₹7,732 average entry:
Risk: ₹354/share
Reward: ₹1,395/share
Gross R:R: 1:3.95
Net R:R: 1:3.47
For 100 shares, the trade provides approximately ₹1.36L net profit before MTF interest if ₹9,127 is achieved.
After the estimated MTF interest, the projected net profit is approximately ₹1.21L.
Final Assessment
NAVIN FLUORINE – BULLISH POSITIONAL SETUP
Entry: ₹7,732 | SL: ₹7,378 | Target: ₹9,127 | Extended: ₹9,347
Risk: ₹354 | Reward: ₹1,395 | R:R: 1:3.95
The major strength of the setup is the complete HTF–MTF–ITF alignment. The ₹7,378–₹7,548 zone is the key demand/support cluster, while ₹8,762 is the critical breakout level. Holding above the demand zone keeps the bullish structure intact; a decisive breakout above ₹8,762 would open the path toward ₹9,127 and potentially ₹9,347.  Long
Long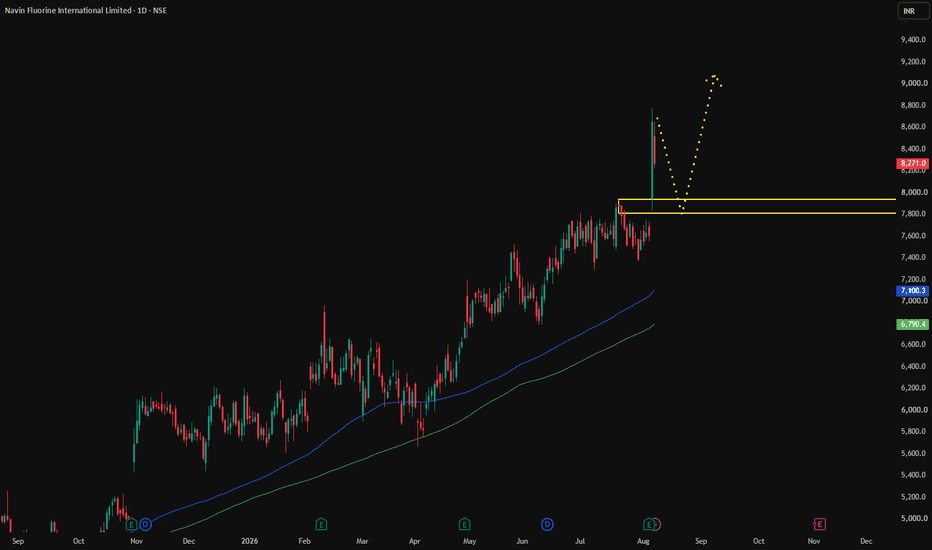
TD POWER SYSTEMTD POWER – MTF TRADE VIEW
Overall Bias: 🟢 Strong Bullish
TD Power is showing clear bullish alignment across HTF, MTF and ITF. The important point is that the demand structure is progressively moving higher, indicating that buyers are defending higher levels rather than allowing the stock to retrace into the deeper HTF zones.
1. Structure
HTF: Yearly, Half-Yearly and Quarterly are all UP.
MTF: Monthly, Weekly and Daily are also UP.
ITF: 240M, 180M and 60M are aligned UP.
The strongest immediate demand is concentrated around ₹930–₹1,068.
This creates a good structural base for a positional long trade.
2. Trade Setup
Average Entry: ₹1,110
Stop Loss: ₹930
Primary Target: ₹1,560
Extended Target: ₹1,830
The entry is slightly above the ITF demand zone, so the trade is effectively looking for continuation from the current bullish structure rather than trying to catch a bottom.
3. Key Price Levels
₹930 – Critical demand / trade invalidation
₹1,068 – Strong ITF demand and important support
₹1,110 – Planned average entry
₹1,380 – Major resistance / previous high
₹1,560 – Primary positional target
₹1,830 – Extended target
4. Trade Logic
The most important level is ₹1,068.
If the stock holds above this zone, the bullish structure remains intact. A sustained move above ₹1,380 would be the major confirmation that the stock is entering the next expansion phase.
Therefore, the preferred sequence is:
₹1,068 support → ₹1,110 entry → ₹1,380 breakout → ₹1,560 target → ₹1,830 extension
5. Risk Management
At an average entry of ₹1,110, the risk to ₹930 is ₹180/share.
With 3,000 shares:
Maximum gross risk: ₹5.40L
Estimated net loss including charges: ~₹5.55L
Gross reward to ₹1,560: ₹13.50L
Estimated net profit: ~₹13.34L
After estimated MTF interest: ~₹12.70L
The 1:2.5 gross R:R is reasonable for a positional trade, but the trade becomes significantly stronger once ₹1,380 is decisively cleared.
Final Assessment
TD POWER – BULLISH POSITIONAL SETUP
The multi-timeframe structure is strongly aligned to the upside, with ₹930–₹1,068 acting as the core demand zone. ₹1,110 is a reasonable continuation entry, while ₹930 is the structural invalidation level. The key hurdle is ₹1,380; a sustained breakout above this level would strengthen the probability of ₹1,560, with ₹1,830 as the extended positional objective.
Bias: BUY | Entry: ₹1,110 | SL: ₹930 | Target: ₹1,560 | Extended: ₹1,830  Short
Short
LUPIN — A DECADE-LONG CEILING RECLAIMED AND A P/E AT HALF MEDIANLUPIN — A DECADE-LONG CEILING RECLAIMED, AND A P/E AT HALF ITS OWN MEDIAN
Lupin peaked near 2,120 in 2015 and then spent nine years below it. The decline was brutal — down to roughly 560 by 2020, a failed recovery to 1,250, and back to about 575 in 2022 alongside a genuine operational collapse: an operating margin of 1.3% and a net loss of Rs 1,528 Cr in FY22.
That ceiling has now been reclaimed. Price broke the 2,000-2,120 band, retested it through 2025 and held, and made a new high near 2,520-2,550 in 2026. A nine-year ceiling that becomes a defended floor is the strongest structural statement a weekly chart makes, and this one has already passed its retest.
The difference between this and most breakout charts is that the fundamentals arrived first. Operating margin has gone 1.3% > 10% > 19% > 23% > 29% > 32% TTM. EPS has gone from -33.62 to 120.98. This is not a chart hoping for a story. The story already printed.
The catch is location. At 2,363.5 price sits near the highs, and this week opened at 2,435, printed 2,440, and closed at 2,363.5 — down 2.13% and near the low of its range. That is a rejection, not an entry.
STRUCTURE I'M WATCHING
Measured objective .. 2,880 – 2,950 . Range projection above the 2,440 shelf. Blue sky above the ATH.
All-time high ....... 2,520 – 2,550 . The 2026 high. Reclaiming it opens the measured move.
Resistance 1 ........ 2,440 ........ The 2025 spike high. Rejected this week.
Current ............. 2,363.5 ...... Upper range. Poor risk/reward from here.
Support 1 ........... 2,120 ........ Top of the reclaimed band. Where it gets interesting.
Breakout band ....... 2,000 – 2,120 . The 2015 all-time high. Reclaimed, retested, held.
Invalidation ........ below 1,980 .. Band failure. The structural case ends here.
Deeper support ...... 1,700 – 1,800 . The 2024 consolidation.
From 2,363 with invalidation at 1,980, risk is roughly 16% for about 8% to the all-time high. Worse than 1:1. From 2,120 the same stop is roughly 6.6% risk for 20% to the high and far more on a breakout — closer to 3:1. The band is the trade.
WHAT THE CHART IS TELLING ME
- The retest already happened and it held. Most decade-long breakouts fail their first retest. This one spent 2025 inside the 2,000-2,120 band and came out the top. That is the single most constructive fact on the chart.
- New highs on a nine-year base mean no overhead supply. Above 2,550 there is nobody trapped. Moves in that air tend to be fast.
- This week is a rejection at 2,440. Open near the high, close near the low. Momentum is pausing, not accelerating.
- The trend is intact regardless. Higher lows from 575 to roughly 2,000 and higher highs from 1,250 to 2,550. Nothing here is broken — it is simply extended.
FUNDAMENTAL BACKDROP — THE TURNAROUND IS REAL AND CASH-BACKED
Sales .............. 16,405 (FY22) > 27,958 (FY26) > 29,967 (TTM)
Operating profit ... 219 (FY22) > 8,160 (FY26) > 9,538 (TTM)
OPM ................ 1.3% > 10% > 19% > 23% > 29% > 32% (TTM)
Net profit ......... -1,528 (FY22) > 5,355 (FY26) > 5,551 (TTM)
EPS ................ -33.62 (FY22) > 116.65 (FY26) > 120.98 (TTM)
Sales CAGR ......... 3-year 19%, TTM 28% — accelerating
Profit CAGR ........ 3-year 140%, TTM 61%
ROE ................ 13% (5yr) > 22% (3yr) > 29% (last year)
ROIC ............... 24%
Piotroski F-score .. 7 of 9
Debt / equity ...... 0.30 — moderate and manageable
Dividend ........... 0.78% yield, 15% payout
Critically, the cash flow confirms it rather than contradicting it:
CFO ................ 367 (FY22) > 1,897 > 3,648 > 3,000 > 7,334 (FY26)
CFO / OP ........... 105% in FY26 — earnings are converting to cash
Free cash flow ..... 5,527 Cr in FY26, up from 1,347 Cr
Capex .............. 4,172 and 3,865 Cr in FY25-26 — reinvesting heavily
Many turnarounds show accounting profit without cash. This one does not. A 105% cash conversion rate alongside record FCF is what separates a genuine operational recovery from a presentation.
THE VALUATION ARGUMENT — AND THE COUNTER-ARGUMENT
Lupin's TTM P/E has compressed from roughly 110 to about 19.6 over five years — its lowest reading in that window and roughly half its own five-year median of 37.0. The stock has risen substantially and become cheaper doing it, because earnings grew faster than price. That is an unusual and genuinely bullish configuration.
The counter sits in the same data. Forward P/E of 21.03 is HIGHER than the trailing 19.58, meaning consensus models a modest earnings decline. The likely reason is the margin itself: a 32% operating margin is exceptional for a generics-weighted pharmaceutical business where peers typically run 20-25%. Margins like that usually come from limited-competition or exclusivity-window products, and those windows close.
Three scenarios worth holding in mind:
- Re-rating: EPS holds near 120 and the multiple moves toward the 30s. Implies a substantially higher price.
- Base case: mild normalisation, EPS in the low 100s at 22x. Roughly current levels.
- Reversion: margins retrace toward the mid-20s, EPS toward the 80s at 18x. Implies the 1,500s.
The spread between those outcomes is wide, and it is exactly why entering at the 2,000-2,120 band rather than at 2,363 matters. Verify what is driving the margin surge and how durable it is. That single question determines which scenario applies.
THE SHAREHOLDING SIGNAL
Promoters ......... 46.85%, essentially unchanged for a decade. No dilution, no drift.
FIIs .............. 13.32% (Mar 2023) rising to 22.42% (Jun 2026) — nine points added
DIIs .............. 28.92% (Mar 2023) falling to 24.65% — domestic funds trimming
Public ............ 10.39% falling to 6.08% — retail float collapsing
Shareholders ...... roughly 3.0 lakh, broadly stable
The clean read: foreign institutions have been the marginal buyer throughout the entire re-rating, absorbing both domestic institutional trimming and retail exit. Promoters have not sold a share. Public float at 6.08% with institutions and promoters holding roughly 94% between them means very little stock is genuinely available — supportive on the way up, and thin on the way down.
FUTURE PLANS — WHAT THE COMPANY IS BUILDING
(Framework as of my information; verify against the latest annual report, investor presentation and exchange filings.)
- Complex generics and inhalation. Respiratory and inhalation products are Lupin's differentiated capability. These are hard to manufacture, hard to get approved, and therefore carry margins that plain oral solids do not. This is the structural reason margins can stay above peer levels.
- Biosimilars. A longer-dated, capital-intensive optionality with meaningful upside if approvals land in regulated markets.
- US specialty and branded assets. Reducing dependence on price-eroding commodity generics.
- India branded formulations. A steady, growing, rupee-denominated base that offsets US volatility.
- Reinvestment. Capex near 3,900-4,200 Cr per year against 5,527 Cr of FCF means growth is being funded internally rather than by leverage.
The strategic read: Lupin is trying to convert a cyclical exclusivity windfall into a structurally higher-margin portfolio. Whether that conversion completes before current high-margin products erode is the entire investment question.
COMPETITIVE LANDSCAPE
Lupin sits mid-pack by size among Indian pharma majors — behind Sun Pharma, and competing directly with Dr Reddy's, Cipla, Zydus, Aurobindo and Torrent. In the US generics channel it also faces global players including Teva, Sandoz, Viatris and Amneal.
Where Lupin competes well: inhalation and complex generics, where approval barriers limit the number of entrants and pricing holds far better than in commodity orals. Its US respiratory franchise is the reason a 32% margin is even conceivable.
Where it is exposed: the commodity generics book, where price erosion is relentless and scale favours larger competitors. And unlike Sun Pharma, Lupin has less of a high-margin specialty branded business to cushion generic deflation.
The peer-relative point worth making: at roughly 19.6x trailing with 29% ROE and 24% ROIC, Lupin does not screen expensive against Indian pharma peers, most of which trade at higher multiples on lower returns. The market appears to be discounting the durability of the earnings rather than the quality of the business.
MACRO LENS
- US generic price erosion. The structural headwind for the entire Indian pharma sector — mid-single-digit annual deflation is the norm. Complex generics resist it; commodity products do not. This is the single most important macro variable for Lupin.
- US FDA compliance. Binary and unhedgeable. A warning letter or import alert on a key facility can remove a product line overnight. Lupin has lived through exactly this, and it was a primary cause of the 2017-2022 collapse.
- Pharmaceutical tariffs and trade policy. US measures targeting imported pharmaceuticals are a live policy risk for Indian exporters and would hit margins directly.
- Currency. Substantial USD revenue against a rupee cost base makes Lupin a structural beneficiary of rupee weakness — a genuine tailwind that operates independent of volumes.
- India domestic market. Steady high-single-digit growth in branded formulations provides a defensive, non-dollar earnings base.
- API supply chain. Concentration of active ingredient sourcing in China is a persistent input and geopolitical risk for all Indian formulators.
- Indian largecap flows. At Rs 1.08 lakh crore this is an index-relevant name; domestic and foreign allocation shifts move it regardless of fundamentals.
INVALIDATION
A decisive weekly close below 1,980 breaks the reclaimed 2015 band and ends the structural thesis. A nine-year ceiling failing after a successful retest would be a serious signal, not a routine pullback.
Softer warning: repeated rejections at 2,440-2,550 while price drifts back toward the band means the breakout is stalling and the margin normalisation debate is being resolved the wrong way.
RISKS WORTH NAMING
- Margin durability is the whole thesis. A 32% OPM is well above sector norms. If it is exclusivity-driven, it is temporary by definition. Forward estimates already hint at this.
- Forward P/E above trailing. The market is modelling an earnings dip, not growth. That caps multiple expansion until estimates turn up.
- Regulatory binary risk. FDA action on a key plant is the classic Indian pharma tail risk and this company has suffered it before.
- Rising interest cost. Interest expense has climbed from 143 Cr (FY22) to 452 Cr (TTM) even as profits soared. Worth understanding why.
- Other income volatility. FY26 included 523 Cr of other income against -82 Cr TTM. Look through non-operating items when assessing the earnings trend.
- Thin public float. Only 6.08% in public hands amplifies moves in both directions.
- Extended location. Near all-time highs after a 4x from the 2022 low. Excellent businesses still make poor entries.
TRADE PLAN
Value entry ........ 2,120 – 2,200 on a weekly hold with volume
Momentum entry ..... Weekly close above 2,550 into blue sky
Invalidation ....... Weekly close below 1,980
Target 1 ........... 2,550 (all-time high)
Target 2 ........... 2,880 – 2,950 (measured move above the 2,440 shelf)
Geometry ........... Worse than 1:1 from 2,363. Roughly 3:1 from 2,120. Wait for the level
Sizing ............. Regulatory tail risk is real. Size for a gap, not for a drawdown
Not chasing 2,363 into a weekly rejection. This is the strongest business on my watchlist and still the wrong price. The band is where the trade lives, and if it never comes back, the breakout above 2,550 is the alternative.
The single thing to monitor: whether operating margin holds above the high 20s in coming quarters. That answers the only question that matters here.
Not financial advice — my own chart and filings interpretation, shared for discussion. Figures are read from public data panels; verify against the company's filings before acting. Do your own research and manage your own risk.  Long
Long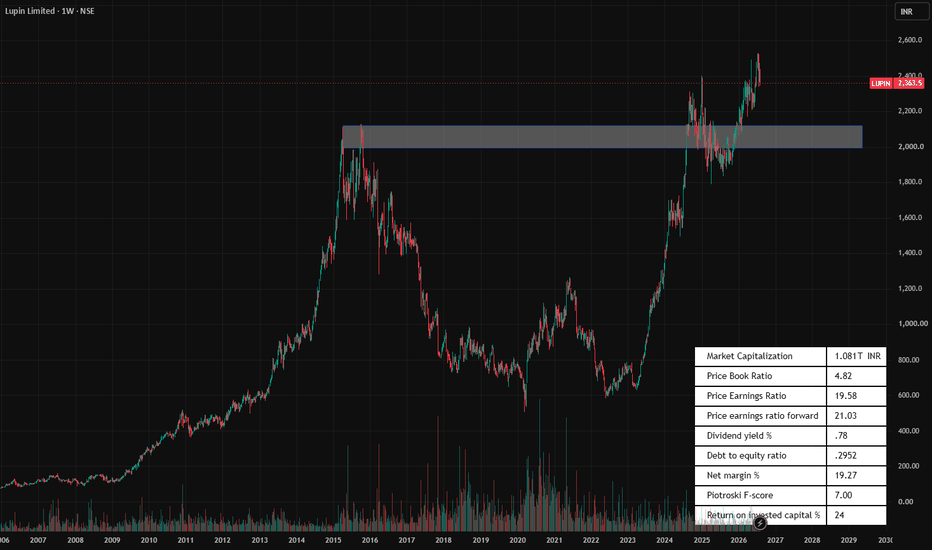
 Long
Long
 Long
Long
BHARATWIRE — CLEAN BALANCE SHEET, SHRINKING TOP LINE, AND A SHARBHARATWIRE — CLEAN BALANCE SHEET, SHRINKING TOP LINE, AND A SHAREHOLDING TABLE THAT LIES
NSE:BHARATWIRE | Weekly | Bias: Watchlist. Good business quality, poor location, deteriorating growth
Price 201.17 | Week: O 197.48 / H 208.58 / L 197.48 / +2.12% / Vol 943.88K | Market cap Rs 1,380 Cr
THE SETUP
Bharat Wire Ropes is a genuine turnaround that already happened. Losses of Rs 45, 61 and 17 Cr across FY19-FY21, interest costs peaking at Rs 89 Cr, and then a resolution: interest expense down to Rs 10 Cr TTM, debt-to-equity at 0.09, and four consecutive profitable years. That work is done and the market paid for it — the stock ran from roughly 20 in 2020 to about 400 by early 2024.
Since that peak the chart has been a wide, violent range: down to roughly 125 in early 2025, back to about 250, down to the 160s, up to roughly 265 in early 2026, and now 201.17. Two years of lower highs against a rising floor.
The grey band at roughly 140-165 is the structure that matters. It was the 2018 high, it was the 2023 breakout shelf, and it has been defended repeatedly since. That band is the idea. Price at 201 is not.
STRUCTURE I'M WATCHING
All-time high ....... 400 ...... Early 2024. Requires a full growth re-rating.
Resistance 2 ........ 300 ...... Mid-vacuum from the 2024 decline.
Resistance 1 ........ 250 – 265 . The 2025 and 2026 highs. The level that matters.
Current ............. 201.17 ... Mid-range. Poorest risk/reward in the structure.
Band top ............ 165 ...... Top of the support shelf. Where it gets interesting.
Support band ........ 140 – 165 . The 2018 high and 2023 breakout zone. Repeatedly defended.
Invalidation ........ below 138 . Band failure.
Cycle low ........... 125 ...... The early-2025 low.
This week opened at its low of 197.48, ran to 208.58, and settled back to 201.17. A green week, but it gave up more than half the range. Not a bar that demands action.
WHAT THE CHART IS TELLING ME
- The 140-165 band is the real level. Three separate roles across eight years — resistance, breakout shelf, then support — is about as validated as a smallcap level gets.
- Higher lows against lower highs. 125 then roughly 160 on the downside; 400 then 265 on the upside. That is a contracting range, and contracting ranges resolve — but they do not tell you which way.
- Mid-range offers no edge. From 201 with invalidation at 138, risk is roughly 31% for about 32% to the first objective at 265. Barely 1:1. From 165 the same 138 stop is roughly 16% risk for 60% upside — closer to 3.7:1. Same idea, same target, entirely different trade.
- Liquidity is thin. Under a million shares a week on a Rs 1,380 Cr company means impact cost is real. Size and exit planning matter more here than on a large cap.
FUNDAMENTAL BACKDROP — THE BALANCE SHEET IS FIXED, THE INCOME STATEMENT IS NOT
The deleveraging is genuine and complete:
Interest cost ...... Rs 89 Cr (FY20) to Rs 10 Cr (TTM)
Debt / equity ...... 0.09 — effectively debt-free
FCF ................ Rs 66 Cr in FY26, up from Rs 10 Cr in FY25
CFO / OP ........... 79% in FY26, versus 52-56% in FY24-25 — cash conversion improving
Price / book ....... 1.70 — undemanding
The income statement is the problem:
Sales .............. 622 (FY24) > 619 (FY25) > 591 (FY26) > 579 (TTM). Declining three years running
Operating profit ... 164 (FY24) > 132 > 131 > 126 (TTM)
Net profit ......... 96 (FY24) > 72 > 72 > 69 (TTM)
EPS ................ 14.16 (FY24) > 10.58 > 10.57 > 10.07 (TTM)
OPM ................ 26% (FY24) > 22% (TTM)
3-year sales CAGR .. 0%. TTM sales growth -8%
ROE ................ 24% (5yr) > 21% (3yr) > 12% (last year)
Piotroski F-score .. 3 of 9
Dividend ........... Nil, every year on record
That ROE compression from 24% to 12% is the honest summary. This company earned its re-rating between FY21 and FY24 and has been giving it back since.
DATA FLAG: the forward P/E of 10.69 against a trailing 20.31 implies earnings roughly doubling. With sales down 8% TTM and a three-year sales CAGR of zero, that estimate deserves scepticism. Smallcap forward estimates rest on thin coverage. Find the capacity or order-book basis for it before you trust it — if there isn't one, the stock is on 20x, not 10.7x.
THE SHAREHOLDING SIGNAL — READ IT CAREFULLY
The Jun 2026 quarter shows DII holding jumping from 0.32% to 19.00%. That looks like a landmark institutional entry. It mostly is not.
Authum Investment and Infrastructure held 18.59% classified under Public in Mar 2026 and appears at 18.78% under DIIs in Jun 2026. Public holding falls from 54.00% to 37.68% in the same quarter. That is one existing block being recategorised, not bought. The real change in that stake is roughly +0.19pp.
What IS new and genuinely worth noting:
- Lloyds Metals & Energy at 3.35% and Lloyds Enterprises at 2.00% appear for the first time — roughly 5.35% taken by a listed industry player. Strategic money entering a small competitor's cap table is a signal worth watching, and it is the most interesting line in the whole table.
- FIIs halved, 4.42% to 2.06%, in the same quarter. Foreign money left while strategic money arrived.
- A large individual public holder cut from roughly 7.6% to 5.0% in Dec 2025.
- Promoter holding is static at 41.27% and has not moved in five quarters. It is also low versus the sector median of roughly 60%.
- Shareholder count is flat to slightly falling at around 31,600.
Net read: a concentrated register with a dominant non-promoter block, low promoter skin in the game, foreign investors exiting, and a strategic industrial buyer arriving. Interesting, but not the clean institutional-accumulation story the headline row suggests.
FUTURE PLANS — WHAT THE COMPANY IS BUILDING
(Framework as of my information — verify against the latest annual report, investor presentation and exchange filings.)
- Capacity utilisation and value-added mix. The core lever is shifting output from commodity ropes toward higher-realisation ropes for elevators, cranes, offshore, mining and oil and gas. OPM at 21-22% is already well above the peer median of 10.25%, which suggests the mix work has partly landed.
- Export expansion. Wire rope is an exportable, specification-driven product. Growing overseas share is the most credible route back to top-line growth given a flat domestic run rate.
- Import substitution. A structural opportunity in India where higher-specification ropes were historically imported.
- Balance-sheet-funded growth. With debt-to-equity at 0.09 and FCF at Rs 66 Cr, expansion no longer requires the leverage that nearly destroyed the company. Capex has been modest — Rs 25, 62 and 31 Cr across FY24-FY26.
The strategic tension: margins and cash conversion are improving while revenue shrinks. That is a company optimising rather than growing. Optimisation has a floor; it cannot produce a doubling in earnings on its own. The forward multiple needs volume, and volume is what is missing.
COMPETITIVE LANDSCAPE — THE PEER TABLE IS UNFLATTERING
The direct comparison is Usha Martin, the dominant listed Indian wire rope player:
Bharat Wire Usha Martin
Market cap (Cr) 1,380 15,696
OPM % 21.78 20.03
ROCE % 12.32 19.47
P/E 19.97 28.80
Price / book 1.70 4.75
Qtr sales growth % -7.95 +16.44
Op profit growth % -2.86 +30.78
5-year return % 20.43 50.01
Debt / equity 0.09 0.07
Bharat Wire earns a slightly better operating margin on a fraction of the scale — that is a real achievement. But it converts capital far worse (ROCE 12.32 versus 19.47), and it is shrinking while its direct competitor grows sales at 16% and operating profit at 31%.
That distinction is decisive. This is not a sector downturn dragging everyone down. The category is growing and Bharat Wire is not participating. The valuation discount — 1.70x book against 4.75x — is therefore substantially earned rather than an obvious mispricing.
Against the broader 82-company peer set, Bharat Wire screens well on margin (21.78 vs 10.25 median) and leverage (0.09 vs 0.27), poorly on growth, and is the only name in the top eight paying no dividend. Promoter holding of 41.27% sits well below the 59.77% median.
Wider competition includes global rope manufacturers and, more persistently, imported product. Pricing pressure from cheap imports is the recurring threat to a margin profile that is currently this company's main selling point.
MACRO LENS
- Steel wire rod input costs. The dominant margin variable. OPM falling from 26% to 22% is consistent with input cost pressure, realisation pressure, or both. Steel price direction moves this P&L more than anything else on this list.
- Indian infrastructure and capex cycle. End demand comes from construction, cranes, ports, mining, elevators and offshore. Government capital expenditure and the real-estate cycle are the demand engine — this is a leveraged play on India's industrial cycle, not a defensive holding.
- Import competition and trade policy. Global steel overcapacity keeps pressure on domestic pricing. Anti-dumping and safeguard measures are a live policy variable that can swing margins in either direction.
- Currency. A weaker rupee helps export realisations and hurts imported input costs. Direction matters to the export growth plan specifically.
- Interest rates now matter far less. At 0.09 debt-to-equity with Rs 10 Cr of interest cost, the rate cycle has stopped being a solvency question. That is a meaningful change from three years ago.
- Smallcap liquidity regime. Indian smallcap valuations move with domestic flows. When smallcap flows reverse, thin names re-rate downward regardless of fundamentals.
INVALIDATION
A decisive weekly close below 138 breaks the 140-165 band that has held for years and puts the 125 cycle low back in play. On a Piotroski score of 3 with declining sales, I would not average into that break.
Softer warning: repeated rejections in the 250-265 zone while the band gets retested means the range is compressing toward a downside resolution.
RISKS WORTH NAMING
- Growth has stalled, not slowed. Three years of zero sales CAGR and -8% TTM. Everything else depends on this reversing.
- Losing share to a direct competitor. Usha Martin growing 16% while this shrinks 8% is company-specific, not cyclical.
- The forward multiple may be fiction. 10.69x requires an earnings double that current trends do not support.
- Concentrated register. A single non-promoter block near 19% and promoter holding at 41.27% means governance and exit risk both concentrate.
- Thin liquidity. Under a million shares a week. Exits in a drawdown will be expensive.
- No dividend, ever. Zero payout across the entire record. No income support at the lows.
- Input cost volatility on a business whose main attraction is currently its margin.
TRADE PLAN
Value entry ........ 145 – 168 on a weekly hold with volume
Breakout entry ..... Weekly close above 265
Invalidation ....... Weekly close below 138
Target 1 ........... 265
Target 2 ........... 300
Geometry ........... Roughly 1:1 from 201. Roughly 3.7:1 from 165. Wait for the band
Sizing ............. Thin smallcap. Position for illiquidity, not just volatility
No position at 201. The balance sheet earns this a watchlist slot; the growth trend does not earn a market order.
The thing to monitor is quarterly sales turning positive. That single line item is what would convert this from a value trap into a re-rating.
Not financial advice — my own chart and filings interpretation, shared for discussion. Figures are read from public data panels; verify against the company's filings before acting. Forward estimates on smallcaps are unreliable. Do your own research and manage your own risk.
 Long
Long
 Long
Long
 Long
Long
YASHO (D) CHARTIf you are an investor, you should definitely try this.I use equinox dates to time my investments.
Over the past few months (from April to August), several select stocks and sectors in the Indian stock market have delivered impressive returns. During this period, key stocks across the large-cap, mid-cap, and small-cap segments have generated substantial profits for investors:
In Large-Cap :-Among large-cap stocks, automobile, metal, and select PSU stocks have performed well
Bajaj Auto: This auto sector heavyweight has delivered returns of approximately 35% to 40%, showing a strong upward trend in recent months. & TVS Motor Company Ltd Automobile (2-Wheelers) has delivered returns between 60% and 70%.
Hindustan Zinc & NALCO: Driven by a rally in the metal and mining sector, Hindustan Zinc and National Aluminium (NALCO) have yielded gains of around 30% to 50%.
Hero MotoCorp: This two-wheeler company has also provided returns of approximately 20% to 25% to investors.
Defense, Railways, and Capital Goods (Defense & Infrastructure)
Stocks in these sectors maintained consistent momentum, driven by the government's focus on defense and capital expenditure:
Bharat Electronics Ltd (BEL) / HAL: These defense sector stocks have demonstrated impressive, albeit intermittent, rallies over the past six months, delivering strong returns to investors in the medium term.
Solar Industries & CG Power: Stocks in the capital goods and industrial segments have witnessed a significant surge in recent months, with many recording remarkable returns ranging from 40% to 60%.
Top Performers in Mid-Cap and Small-Cap Segments
Selected stocks in the small-cap and mid-cap categories have delivered stellar short-term gains:
Diamond Power Infrastructure: This stock has generated impressive returns of over 100% in recent months, demonstrating a 'multibagger' performance.
Sigma Advanced Systems & Other Engineering Stocks: Several stocks associated with specialty engineering and manufacturing have nearly doubled investors' money (yielding returns of 100%–140%) over the past six months.
Select companies and stocks in the Indian stock market that have delivered impressive returns ranging from 60% to 200% or more (stocks showing strong momentum among retail and swing traders). These include sectors such as telecom equipment/manufacturing, aerospace and defense, engineering/industrial piping, and specialty chemicals.
1. Sterlite Technologies Ltd.
2. Sigma Advanced Systems Ltd.
3. Dee Development Engineers.
4. Yasho Industries.
5.Solar Industries India Ltd.
Key Drivers for the Rally in These Stocks:
Focus on Defense and Manufacturing: Stocks in this segment have surged the most due to the government's emphasis on capital expenditure (CapEx) and the defense sector.
Strong Earnings: Investor buying has been most intense in companies that have delivered results significantly better than expected over the last few quarters and have seen their profits (PAT) multiply.
Order Book Growth: Stock prices of many engineering and infrastructure companies have remained on an upward trajectory due to their substantial order books.
(Note: Stocks in the small-cap and mid-cap segments are subject to high volatility. Before making any fresh investments or engaging in swing trading, be sure to analyze trading volumes, risk management parameters, and technical chart levels.)  Long
Long
 Long
Long