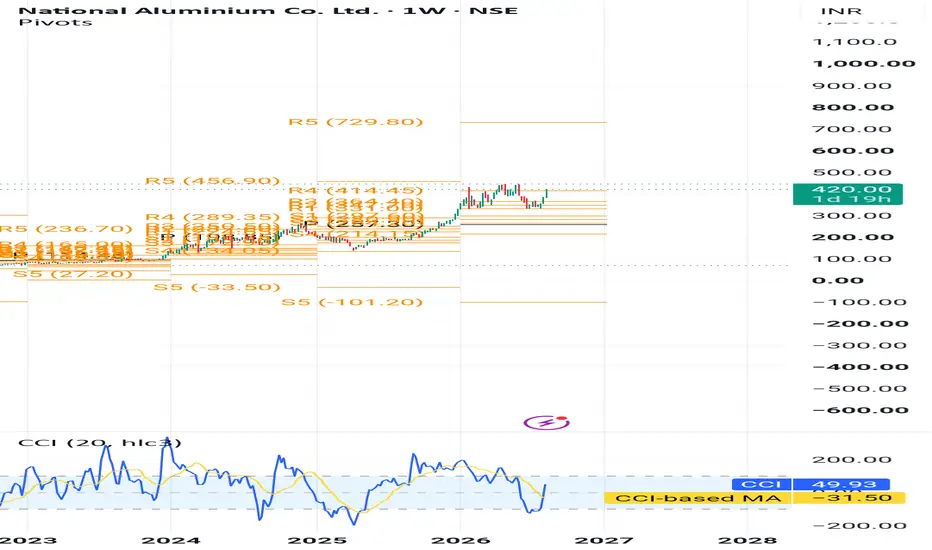
Long
Long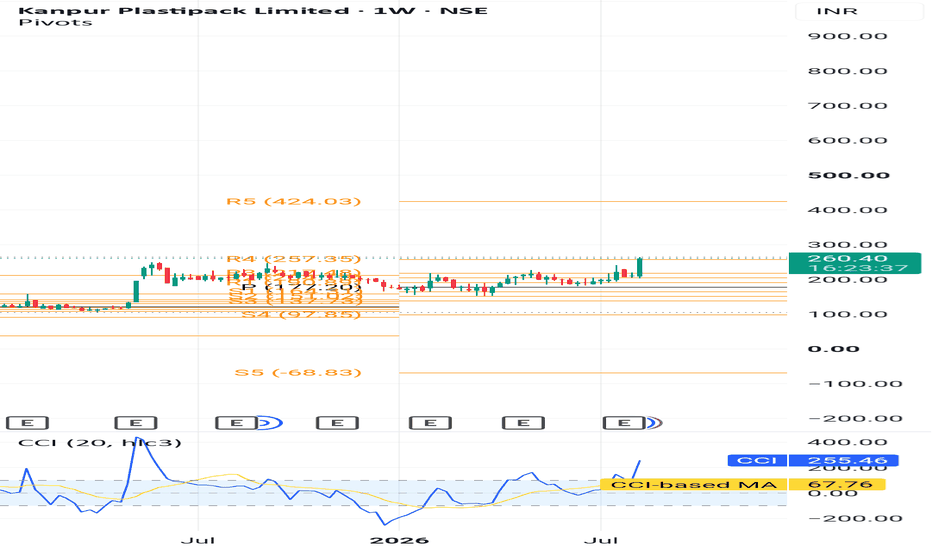
 Short
Short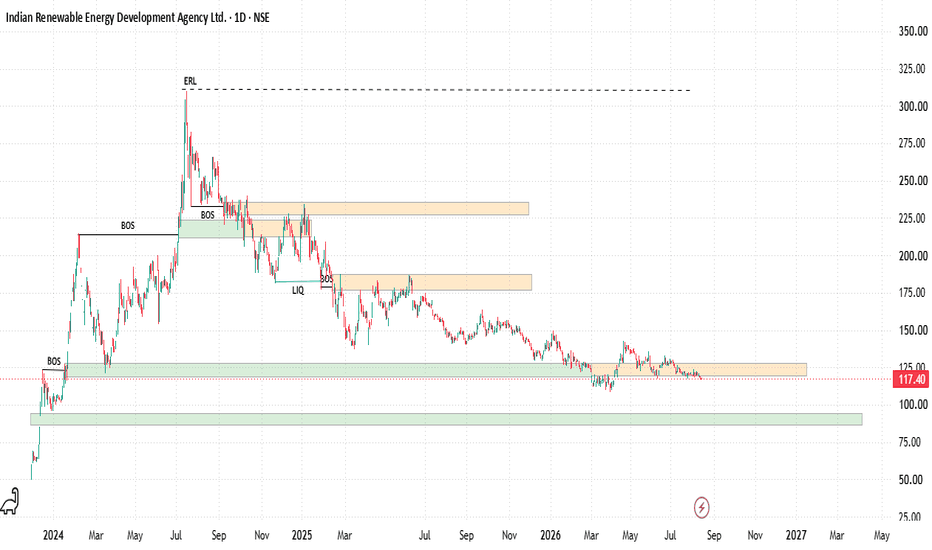
 Long
Long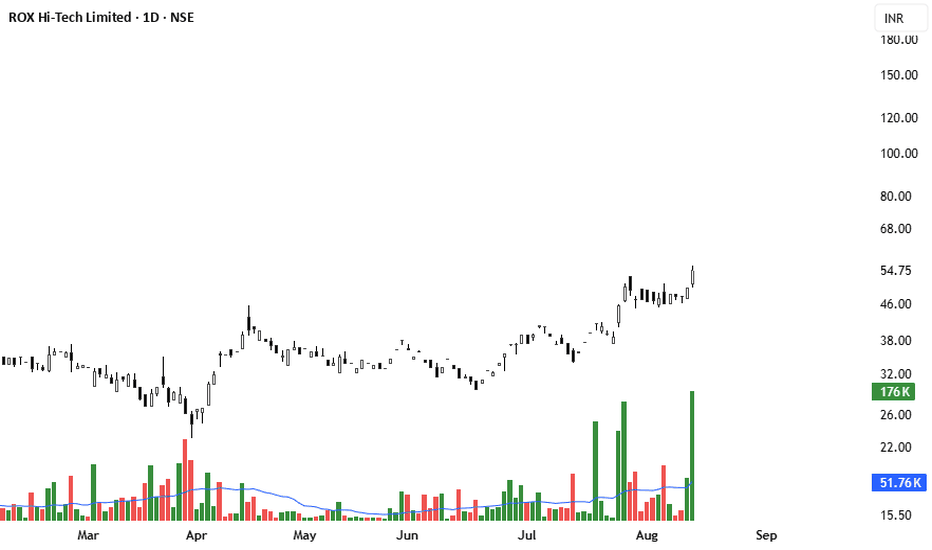
 Long
Long
GRAVITA: Approaching Major Resistance, Breakout Setup?GRAVITA is approaching a key resistance zone around ₹1,850–₹1,900.
The stock has recovered strongly from the ₹1,300–₹1,400 support zone and is now testing the descending resistance trendline.
🔹 Breakout zone: ₹1,850–₹1,900
🔹 Bullish confirmation: Daily close above the resistance with strong volume
🔹 Next potential levels: ₹2,000 → ₹2,200+
🔹 Major support: ₹1,500 / ₹1,300
A decisive breakout could signal the end of the long-term downtrend and open the way for a larger move higher.
⚠️ This is a technical analysis setup, not financial advice. Wait for confirmation rather than chasing the breakout.  Long
Long
 Long
Long
 Long
Long
 Long
Long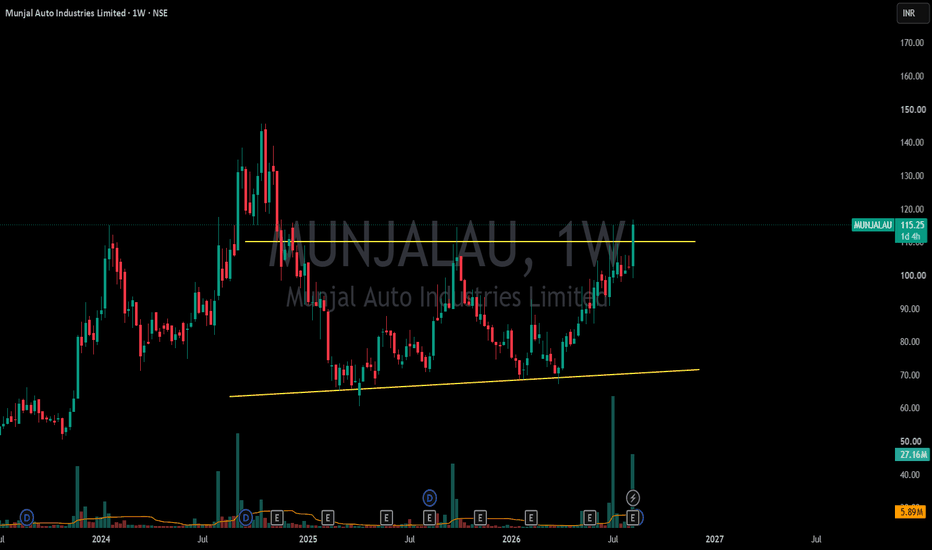
AZAD: Daily Pennant Compression Nearing Breakout Apex 📊 Azad Engineering Limited (AZAD) - Daily (1D) Chart Analysis
This post is shared for EDUCATIONAL PURPOSES ONLY to observe classical chart pattern compression and horizontal demand zones. It is not financial or investment advice.
🟢 Technical Observations:
1. Symmetrical Triangle Consolidation: On the daily chart, AZAD is tightening intensely inside a massive pennant structure. The higher lows and lower highs are converging directly toward an imminent breakout apex.
2. Rock-Solid Demand Base: The horizontal blue support zone between 2,000.00 and 2,050.00 has been verified multiple times by the bulls, confirming heavy interest and strong structural accumulation at these levels.
3. Moving Average Clusters: The price is trading cleanly above its primary exponential moving averages. The shorter-term moving average (green line) has flattened out and is turning up right underneath the current price of 2,233.50 to provide dynamic trailing support.
4. Immediate Breakout Trigger: The price is currently grinding against the descending upper resistance trendline. A strong daily candle close above the 2,250.00 level will signal a definitive macro continuation breakout.
🎯 Educational Swing Setup:
• Entry Zone: 2,130.00 – 2,233.50 (Accumulating safely within this apex squeeze, or executing on a confirmed daily breakout close above 2,250.00).
• Target 1: 2,350.00 (Previous major swing high / key structural resistance)
• Target 2: 2,600.00+ (Macro price expansion target in blue-sky territory)
• Invalidation / Stop-Loss: 1,970.00 (A daily close below the blue demand box and the lower ascending support trendline invalidates this continuation thesis).
• Expected Duration: 2 to 4 Weeks (Daily swing view)
⚠️ Risk Management:
Symmetrical triangles approaching their apex can experience rapid expansion once a direction is chosen. Watch for a high-volume spike to confirm institutional backing on the breakout candle. Maintain disciplined position sizing!  Long
Long
 Long
Long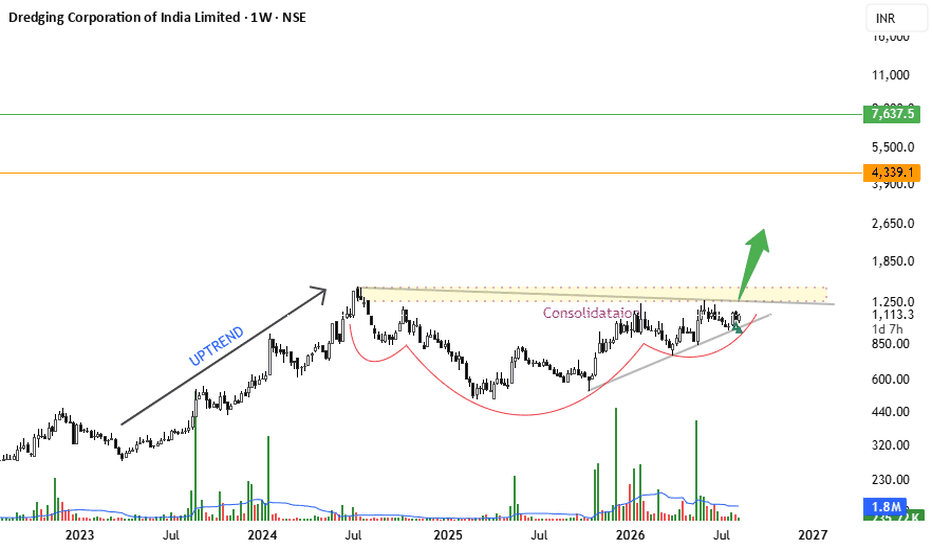
PITTIENG: 30m Earnings Breakout & High-Volume Dynamic EMA 📊 Pitti Engineering Ltd. (PITTIENG) - 30-Minute (30m) Chart Analysis
This post is shared for EDUCATIONAL PURPOSES ONLY to analyze short-term earnings breakouts, volume expansion dynamics, and dynamic moving average stack alignment. It is not financial or investment advice.
🎯 Educational Swing Setup:
• Entry Zone: 1,000.00 – 1,044.00 (Sizing into position blocks near current levels, or accumulating on minor 30m retests toward the 1,005.90 green EMA support shelf).
• Target 1: 1,120.00 (Near-term key structural supply / extension target)
• Target 2: 1,223.00 (1-Year consensus analyst price target zone)
• Invalidation / Stop-Loss: 950.00 (A definitive 30m candle close back below the pink long-term moving average baseline invalidates this bullish momentum setup).
• Expected Duration: 3 to 8 Trading Days (Short-term 30m swing view)
⚠️ Risk Management:
Since the price has put on a sharp vertical extension, look for volume continuation on subsequent sessions or brief consolidation around the 1,000.00 zone to confirm sustained follow-through. Maintain disciplined position sizing! BALKRISHNA INDUSTRIESBalkrishna Industries Ltd. (CMP ₹2,496.00, NSE: BALKRISIND)
The SmartWay Research Desk | 13 August 2026
A Mumbai‑based tire manufacturer, incorporated in 1961. Balkrishna Industries (BKT) is India’s leading producer of off‑highway tires (OHT), catering to agriculture, construction, mining, and industrial equipment markets, with strong exports to over 160 countries.
FY22–FY26 Snapshot
Revenue Growth: FY26 revenue ₹10,842 Cr vs ₹9,612 Cr in FY25 (+12.8% YoY). → Good
Net Profit: FY26 PAT ₹1,812 Cr vs ₹1,612 Cr in FY25 (+12.4% YoY). → Good
Operating Margin: FY26 EBITDA ₹2,812 Cr, margin 25.9% vs 25.2% last year (+70 bps). → Good
Equity Capital: Stable, face value ₹2. → Good
Dividend Policy: Dividend ₹12.00/share declared for FY26. → Good
Asset Building: Investments in greenfield plants, carbon black expansion, and R&D for radial OHT tires. → Good
Sales: Strong demand from agriculture and mining equipment exports. → Good
Expense: Raw material cost pressures (natural rubber, crude derivatives) remain. → Neutral/Good
EPS: FY26 EPS ₹94.25 vs ₹83.80 last year (+12.5%). → Good
Institutional Interest & Ownership Trends (Mar 2026)
Promoter Holding: ~58.3% (no pledges)
FII Holding: ~20.1%
DII Holding: ~15.6%
Retail & Others: ~6.0%
Strategic Moves & Innovations
Expansion in carbon black production for cost efficiency.
Focus on radial OHT tires for global markets.
Partnerships with OEMs in agriculture and mining sectors.
Diversification into sustainable tire technology and recycling initiatives.
Cash Flow & Balance Sheet Strength
Market cap ~₹48,200 Cr.
Debt‑to‑equity ratio ~0.32 (moderate leverage).
Book value per share ₹412.00; P/B ~6.1.
EPS (TTM) ₹94.25; P/E ~26.5.
Risk Factors
Moderate P/E ratio ~26.5, valuations fair.
Dependence on global OHT demand cycles.
Exposure to commodity price volatility (rubber, crude).
Competition from MRF, Apollo Tyres, and JK Tyre.
Investor Takeaway
Balkrishna Industries has delivered steady FY26 performance, supported by export growth, carbon black expansion, and radial tire innovation. With strong promoter backing, dividend payouts, and leadership in off‑highway tires, BKT remains a large‑cap specialty tire play. At CMP ₹2,496.00, valuations are reasonable (P/E ~26.5, P/B ~6.1), reflecting growth expectations with manageable risks.  Long
Long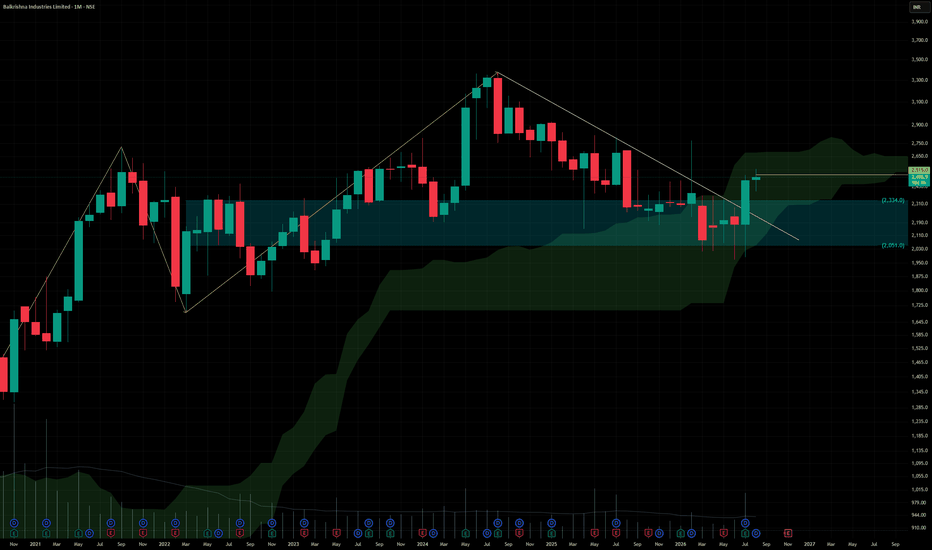
 Long
Long

 Long
Long
 Long
Long
Hindalco⚙️ STOCK TO WATCH ⚙️
Hindalco Industries Ltd.
₹1,075 → ₹1,444 👀
A leading aluminium and copper producer appearing on my Weekly R4 Breakout Scanner.
📌 Buy Zone: ₹1,075
📌 Breakout Zone: ₹1,075
🛑 Stop Loss: ₹935
🎯 Target: ₹1,444
Why Hindalco?
⛏️ One of India's leading integrated aluminium and copper producers, with global exposure through Novelis.
🌍 Diversified operations across aluminium, copper and value-added products provide exposure to multiple industrial end markets.
📈 Q1 FY27 was exceptionally strong: consolidated revenue rose 32%, EBITDA 73% and PAT 75% YoY to ₹7,013 crore.
🔥 Aluminium upstream EBITDA reached a record ₹7,390 crore, up 81% YoY, while downstream EBITDA also reached a record level.
🚀 Aluminium prices have recently moved to a seven-week high amid supply concerns, providing an additional near-term tailwind for Indian aluminium producers.
📊 Weekly Camarilla R4 Breakout Setup.
Why It Caught My Attention
✅ Strong aluminium & metals theme
✅ Record Q1 FY27 operating performance
✅ Direct exposure to aluminium-price momentum
✅ Diversified global business through Novelis
✅ Weekly R4 Momentum Breakout
⚠️ High Risk – High Reward Setup. Always follow strict stop-loss and disciplined position sizing.
📢 Disclaimer: This content is for educational purposes only and not investment advice. Please do your own due diligence before making any investment decisions.
Risk Defined. Reward Visible.
© 20K Microcap Investing | R4 Momentum Desk
#Hindalco #Aluminium #MetalsAndMining #Copper #Novelis #Infrastructure #Manufacturing #StockMarketIndia #IndianStocks #StocksToWatch #R4Breakout #20KMicrocap  Long
Long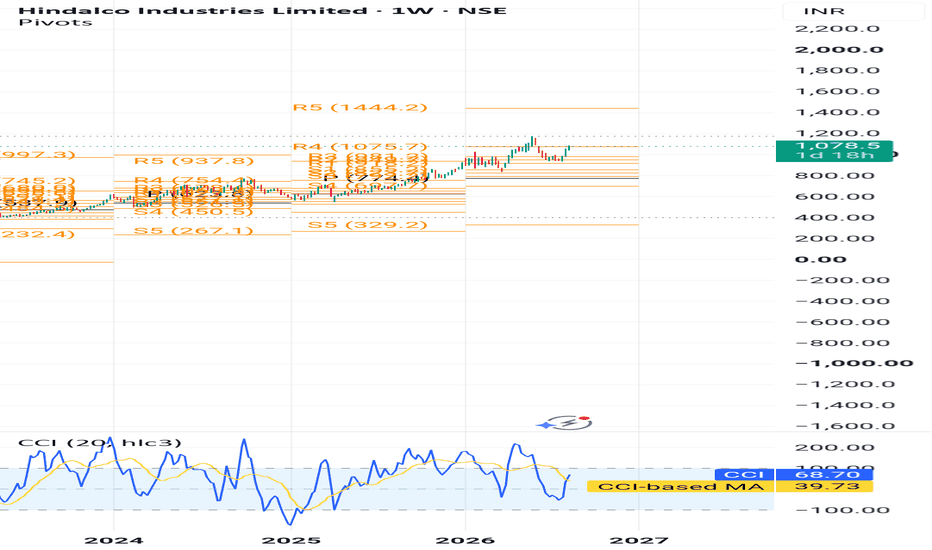
Black Box ⚙️ STOCK TO WATCH ⚙️
Black Box Ltd.
₹760–₹770 → ₹1,195 → ₹2,210 👀
A digital infrastructure and technology-solutions company appearing on my Weekly R4 Breakout Scanner.
📌 Buy Zone: ₹760–₹770
📌 Breakout Zone: ₹757
🛑 Stop Loss: ₹522
🎯 Target 1: ₹1,195
🎯 Target 2: ₹2,210
Why Black Box?
🌐 Provides digital infrastructure solutions spanning data centres, enterprise networking and connectivity.
🤖 Its exposure to AI-ready infrastructure and hyperscale data-centre requirements gives it a strong structural growth theme.
📈 FY26 order backlog reached approximately $792 million (~₹7,000 crore), up 57% YoY, providing strong revenue visibility.
🚀 FY26 revenue rose 6% to ₹6,322 crore, while EBITDA increased 7% to ₹570 crore and PAT rose 6% to ₹218 crore.
📊 Weekly Camarilla R4 Breakout Setup.
Why It Caught My Attention
✅ Strong AI & digital-infrastructure theme
✅ Exposure to data-centre growth
✅ 57% YoY increase in order backlog
✅ Improving profitability and business mix
✅ Weekly R4 Momentum Breakout
⚠️ High Risk – High Reward Setup. Always follow strict stop-loss and disciplined position sizing.
📢 Disclaimer: This content is for educational purposes only and not investment advice. Please do your own due diligence before making any investment decisions.
Risk Defined. Reward Visible.
© 20K Microcap Investing | R4 Momentum Desk
#BlackBox #BBOX #DigitalInfrastructure #DataCenters #AIInfrastructure #TechnologyStocks #StockMarketIndia #IndianStocks #StocksToWatch #R4Breakout #20KMicrocap  Long
Long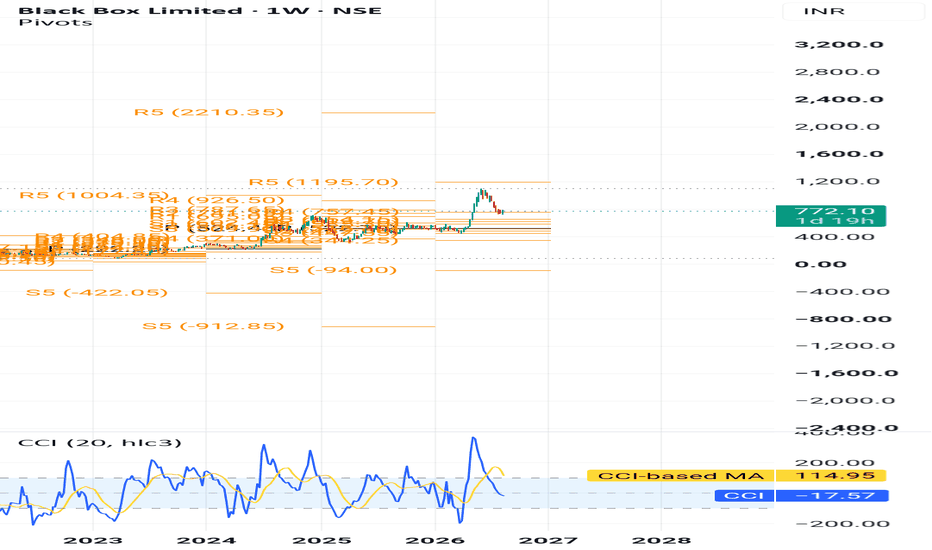
KEI Industries ⚙️ STOCK TO WATCH ⚙️
KEI Industries Ltd.
₹5,650–₹5,700 → ₹8,414 👀
A leading wires and cables manufacturer appearing on my Weekly R4 Breakout Scanner.
📌 Buy Zone: ₹5,650–₹5,700
📌 Breakout Zone: ₹5,642
🛑 Stop Loss: ₹4,657
🎯 Target: ₹8,414
Why KEI Industries?
⚡ One of India's leading manufacturers of wires and cables, serving residential, commercial and industrial markets.
🏗️ Exposure to India's infrastructure, power transmission, construction and real-estate capex cycle.
📈 Q1 FY27 revenue grew 22.97% YoY to ₹3,185 crore, while net profit increased 40.05% YoY to ₹274 crore.
🚀 EBITDA rose nearly 40% YoY, with margin improving to 13.04%, supporting the ongoing operating-efficiency story.
📊 Weekly Camarilla R4 Breakout Setup.
Why It Caught My Attention
✅ Strong wires & cables theme
✅ Beneficiary of India's power & infrastructure capex
✅ Strong Q1 FY27 earnings momentum
✅ Improving operating margins
✅ Weekly R4 Momentum Breakout
⚠️ High Risk – High Reward Setup. Always follow strict stop-loss and disciplined position sizing.
📢 Disclaimer: This content is for educational purposes only and not investment advice. Please do your own due diligence before making any investment decisions.
Risk Defined. Reward Visible.
© 20K Microcap Investing | R4 Momentum Desk
#KEIIndustries #KEI #WiresAndCables #PowerInfrastructure #CapitalGoods #Manufacturing #StockMarketIndia #IndianStocks #StocksToWatch #R4Breakout #20KMicrocap  Long
Long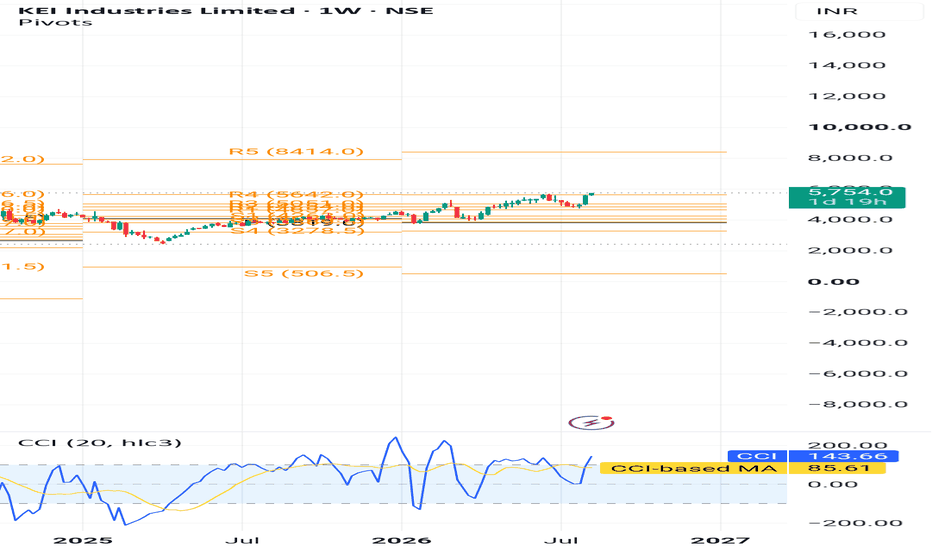
 Long
Long