Long
Long
 Long
Long
 Long
Long
BLUESTONE tightening above the July breakoutStock topped in October 2025 and then fell for five months. Clean Stage 4 under a falling trendline, averages sloping down, price grinding all the way to the February low. Nothing to do through any of it.
The base started forming in April. Three months of sideways movement between roughly 465 and 590, price chopping around while both averages flattened and eventually turned up underneath. It tested the base low in June before recovering. Boring stretch, and that is usually where people move on.
Base 1 broke in late July. Price took out the top of the range and the downtrend line in the same move, and it did it on the biggest volume bars on the whole chart, several days of heavy trade in a row. That is size coming in, not retail.
Price then ran from around 590 to over 900 in a few weeks.
Since mid August it has been building the second base at the highs. Wide range, one sharp pullback to the rising short term average that held, and now price is pushing back up through the range. Today up 4.05%, closed at 533.
Five months of decline, three months of basing, then the move. The base is where the setup gets built.
Watching the second base now. Valid while the base low holds. Close back under it and I stand aside.
Not a recommendation, just sharing what I am watching.  Long
Long
 Long
Long
 Long
Long
BTR Indicator | MCX Swing Trading Study | 1-Day ChartThis daily chart of Multi Commodity Exchange of India (MCX) presents an interesting example of how a swing setup can develop over several weeks.
The BTR Buy Signal appeared around the ₹2,600–₹2,650 zone, following a prolonged period of weakness and consolidation. Since then, price has moved strongly upward and is now trading around ₹3,280.
📊 Setup Structure
🟢 BTR Buy Signal: ~₹2,650
🛑 SL / Invalidation Reference: ₹2,565.5
🎯 T1: ₹3,090.6
🎯 T2: ₹3,353.1
🎯 T3: ₹3,615.6
The chart shows that T1 has already been crossed, while price is currently trading below the T2 reference around ₹3,353.
🧠 The bigger lesson: Swing trading needs patience
Look at the distance between the original setup and the current price.
This wasn't a one-candle move.
The market needed time to build the trend.
There were multiple phases of consolidation and pullbacks before price reached the higher levels. This is exactly why swing trading shouldn't be approached with the expectation that every setup will immediately move in one direction.
A structured approach can be:
Identify setup → Define invalidation → Mark potential levels → Wait → Review price behaviour
The key is not to predict what the next candle must do.
Instead, observe whether the original setup continues to remain valid.
🎯 Where discipline matters most
Once price has already moved significantly from the original signal, chasing becomes a different proposition from studying the original setup.
The chart may look obvious in hindsight.
But the real test of a swing trader is what they do while the trade is developing:
Patience during consolidation.
Discipline during pullbacks.
Risk control when the setup fails.
No emotional chasing after a large move.
Good trading is not about being active every day.
Sometimes the hardest part of a good setup is simply giving it enough time.
The BTR indicator shown here is a technical analysis tool used to structure potential setups and reference levels. It does not guarantee future price movement or target achievement.
📌 Educational chart study only. Not investment advice, a buy/sell recommendation, or a guarantee of returns. Commodity and derivative trading involves risk.  Long
Long
ASKAUTOLTD holding tight after the August gapStock was in Stage 4 from October through March. Falling averages, a downtrend line off the October high capping every bounce, price grinding down to the March low. Nothing to do for six months.
The turn came in late March and April. Price came off the low, reclaimed the short term average, and then moved into the first base.
That base ran from late April through July, about three months. Wide range between roughly 430 and 480, price moving sideways while both averages caught up from below and flattened out underneath it. Slow and boring to watch, which is exactly why most people lose interest right before the move.
Base 1 broke at the start of August. Price gapped through the top of the range on the biggest volume bar on the whole chart, and it also cleared the long term average and the downtrend line in the same move. That was the Stage 4 to Stage 2 handover and it happened in a single session.
Since then it has been building the second base right above the gap. About six weeks sideways, price holding the rising short term average on every dip, range tightening now. Today up 1.54%, closed at 632.
Six months of decline, three months of base building, then a gap that repriced the stock in one day. That is how these tend to resolve.
Watching the second base now. Valid while the base low holds. Close back inside the gap and I stand aside.
Not a recommendation, just sharing what I am watching.  Long
Long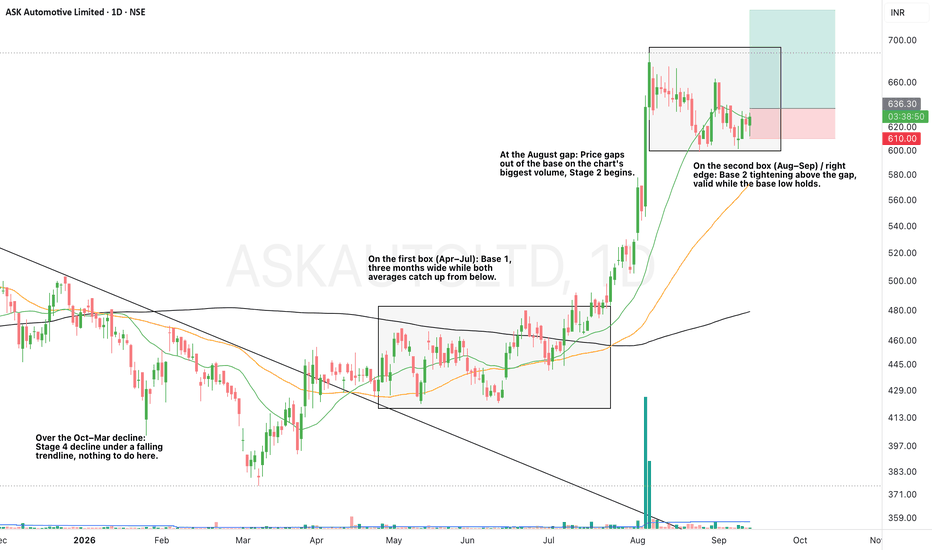
 Short
Short
 Long
Long
 Long
Long
 Long
Long
 Long
Long
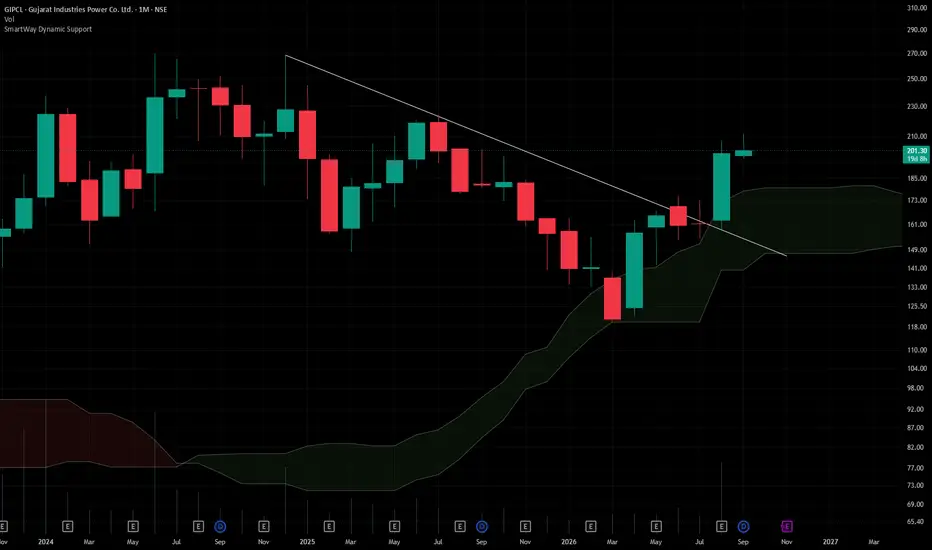
GIPCL## Gujarat Industries Power Company Ltd. (CMP ₹201.00, NSE: GIPCL)
**The SmartWay Research Desk | 11 September 2026**
A Vadodara‑based power generation company, incorporated in 1985. Gujarat Industries Power Company Ltd. (GIPCL) operates **thermal, gas‑based, and renewable power plants**, supplying electricity to Gujarat state utilities and industrial consumers. The company has diversified into **solar and wind energy projects** alongside its lignite‑based thermal stations.
**Promoter Holding (Jun 2026):** **Government of Gujarat & State PSUs — ~54.1% stake (no pledges)**
---
### FY22–FY26 Snapshot
- **Revenue Growth:** FY26 revenue ₹2,842 Cr vs ₹2,512 Cr in FY25 (+13.1% YoY). → **Good**
- **Net Profit:** FY26 PAT ₹412 Cr vs ₹362 Cr in FY25 (+13.8% YoY). → **Good**
- **Operating Margin:** FY26 EBITDA ₹812 Cr, margin 28.6% vs 27.9% last year (+70 bps). → **Good**
- **Equity Capital:** Stable, face value ₹10. → **Good**
- **Dividend Policy:** Dividend ₹3.50/share declared for FY26. → **Good**
- **Asset Building:** Investments in **solar parks, wind farms, and lignite mining expansion**. → **Good**
- **Sales:** Strong demand from **state utilities and industrial consumers**. → **Good**
- **Expense:** Fuel and maintenance costs remain elevated. → **Neutral/Good**
- **EPS:** FY26 EPS ₹13.25 vs ₹11.65 last year (+13.7%). → **Good**
---
### Institutional Interest & Ownership Trends (Jun 2026)
- **Promoter Holding:** ~54.1% (no pledges)
- **FII Holding:** ~8.2%
- **DII Holding:** ~18.6%
- **Retail & Others:** ~19.1%
---
### Strategic Moves & Innovations
- Expansion in **solar and wind energy capacity**.
- Focus on **clean energy transition and sustainability**.
- Partnerships with **state utilities for long‑term PPAs**.
- Diversification into **lignite mining and captive power projects**.
---
### Cash Flow & Balance Sheet Strength
- Market cap ~₹3,200 Cr.
- Debt‑to‑equity ratio ~0.38 (moderate leverage).
- Book value per share ₹142.00; P/B ~1.4.
- EPS (TTM) ₹13.25; P/E ~15.2.
---
### Risk Factors
- Moderate **P/E ratio ~15.2**, valuations fair.
- Dependence on **state utility demand cycles**.
- Exposure to **fuel price volatility and regulatory changes**.
- Competition from NTPC, Torrent Power, and Adani Power.
---
### Investor Takeaway
GIPCL has delivered **steady FY26 performance**, supported by renewable energy expansion, lignite mining, and stable utility demand. With strong promoter backing (Government of Gujarat, 54.1% stake), dividend payouts, and leadership in state power generation, GIPCL remains a **mid‑cap power sector play**. At CMP ₹201.00, valuations are **reasonable (P/E ~15.2, P/B ~1.4)**, reflecting growth potential with manageable risks.  Long
Long
 Long
Long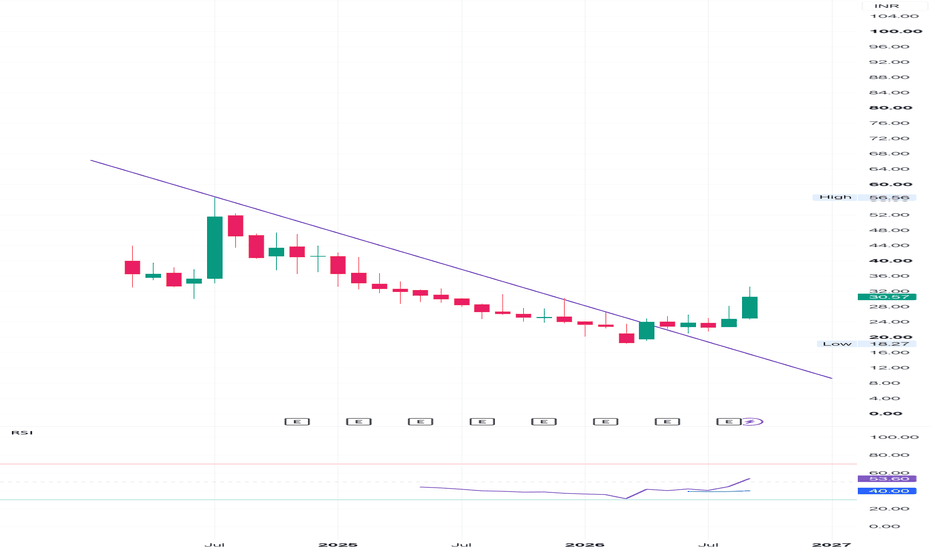
 Long
Long
 Long
Long
 Long
Long
 Long
Long