Long
Long
 Long
Long
 Long
Long
 Long
Long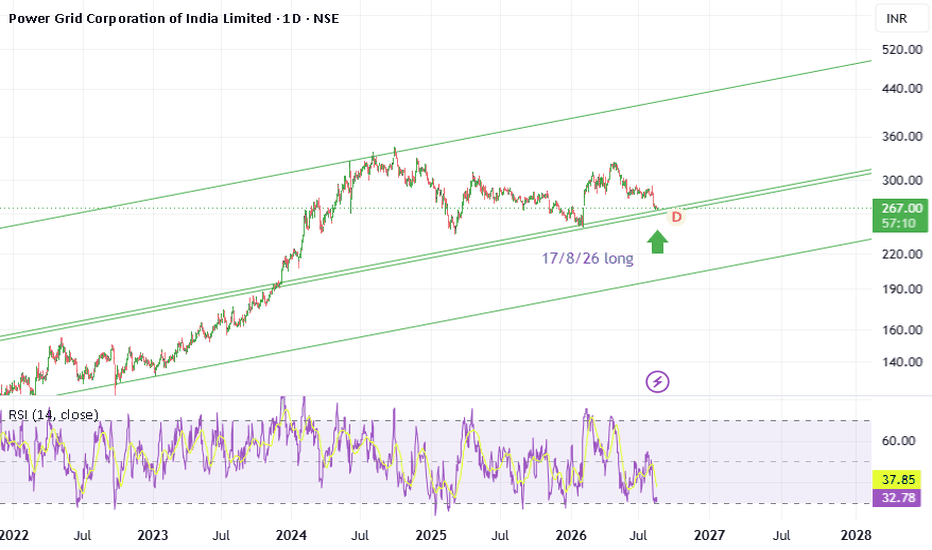
Bullish View On BATA # Bata India – Business Model
## 1. Company Overview
Bata India Limited is one of India's leading footwear companies and is part of the global Bata Shoe Organization. The company operates primarily in the **footwear and accessories** segment and serves consumers across men's, women's and children's categories. Bata India is also one of India's largest footwear retailers. ( )
Its business model combines **manufacturing, branded retail, franchising, wholesale/distribution, institutional sales and digital commerce**.
The company's core proposition is built around **brand trust + product quality + comfort + fashion + extensive distribution**.
---
# 2. Core Business
Bata India's reported business segment is **Footwear and Accessories**. Footwear accounts for the overwhelming majority of its turnover. ( )
The company serves:
* Men
* Women
* Children
* Institutional customers
* Wholesale customers
* Online consumers
---
# 3. Major Product Categories
### Men's Footwear
* Formal shoes
* Casual shoes
* Sports shoes
* Sneakers
* Sandals
* Slippers
* School and work footwear
### Women's Footwear
* Formal footwear
* Casual footwear
* Sandals
* Flats
* Sneakers
* Heels
* Fashion footwear
### Children's Footwear
* School shoes
* Casual footwear
* Sports shoes
* Sandals
* Kids' fashion footwear
### Accessories
Bata also participates in selected footwear-related accessories and complementary products.
---
# 4. Brand Portfolio
Bata operates multiple brands and product propositions to target different consumer requirements and price points.
Important brands include:
* **Bata**
* **Power**
* **Hush Puppies**
* **North Star**
* **Floatz**
* **Bubblegummers**
* **Bata Red Label**
* **Bata Comfit**
For example, Power focuses strongly on sports and athleisure, Hush Puppies on comfort and premium casual/formal footwear, while Bubblegummers addresses children's footwear. ( )
This multi-brand strategy enables Bata to address different **age groups, occasions, styles and price segments**.
---
# 5. How Bata Makes Money
Bata primarily earns revenue through the **sale of footwear and accessories**.
Its revenue model can be simplified as:
**Product Design & Sourcing**
↓
**Manufacturing / Procurement**
↓
**Branding & Marketing**
↓
**Retail / Franchise / Wholesale / Online**
↓
**Consumer**
↓
**Product Sales**
The company also earns revenue through institutional and non-retail channels. ( )
---
# 6. Distribution Model
Bata uses a highly diversified distribution network.
### Company-Owned Stores
Bata operates company-owned retail stores, allowing it to control:
* Customer experience
* Product presentation
* Pricing
* Inventory
* Brand positioning
### Franchise Stores
Franchising is an important expansion strategy, particularly for entering smaller cities and towns.
The franchise model allows Bata to expand its physical presence with lower capital requirements compared with opening every store directly.
### Wholesale & Distribution
Bata also sells through its non-retail business, including:
* Multi-brand outlets
* Key accounts
* Wholesale
* Institutional customers
* Other distribution channels
### E-Commerce
The company sells through:
* Its own digital platform
* Online marketplaces
* Digital retail channels
The company reported continued growth in e-commerce during FY2025-26, with both its own platform and marketplace channels contributing to digital sales. ( )
---
# 7. Retail Network
Retail is the heart of Bata India's business model.
As of FY2024-25, the company reported **1,962 COCO and franchise stores** across India. It also serves customers through its website and marketplaces. ( )
The large physical network provides Bata with:
* Strong brand visibility
* High customer accessibility
* Direct consumer interaction
* Better product discovery
* Geographic reach
* Distribution advantages
The company also continues to expand its franchise network, particularly beyond major metropolitan markets.
---
# 8. Omnichannel Business Model
Bata is increasingly moving from a traditional store-led model toward an **omnichannel retail model**.
The customer can discover and purchase products through:
**Physical Stores**
*
**Company Website**
*
**Mobile App**
*
**Marketplaces**
*
**Hyperlocal Delivery**
This allows Bata to combine the advantages of physical retail with digital commerce.
During FY2025-26, Bata reported that around **70% of its stores were enabled with hyperlocal delivery arrangements**, while its e-commerce business also recorded growth. ( )
---
# 9. Manufacturing Model
Bata follows a combination of:
* In-house manufacturing
* Supplier sourcing
* Local sourcing
* Imported components/products
* Strategic sourcing partnerships
The company has historically maintained manufacturing facilities in India.
Manufacturing provides greater control over:
* Product quality
* Production
* Cost
* Product availability
* Supply-chain efficiency
Bata has also focused on **local-to-local sourcing and import substitution** to improve speed-to-market and margins. ( )
---
# 10. Customer Segments
### Value-Conscious Consumers
Customers looking for affordable and reliable footwear.
### Middle-Income Consumers
Consumers seeking branded footwear with a combination of:
* Quality
* Comfort
* Style
* Durability
### Premium Consumers
Customers looking for premium brands such as Hush Puppies and higher-end product ranges.
### Young Consumers
Demand for:
* Sneakers
* Sports shoes
* Athleisure
* Casual footwear
is increasingly important for younger customers.
### Children
School footwear and children's footwear represent an important recurring category.
### Institutional Customers
Bata also serves institutional and non-retail customers through its B2B business.
---
# 11. Key Competitive Advantages
## 1. Strong Brand Recognition
Bata has one of the strongest and most recognizable footwear brands in India.
Its long operating history has created significant consumer trust.
## 2. Extensive Retail Network
A large physical footprint gives Bata access to consumers across metros, smaller cities and towns. ( )
## 3. Multi-Brand Portfolio
Multiple brands allow Bata to address different customer segments.
## 4. Distribution Strength
The company combines retail stores, franchises, wholesale, institutional channels and digital platforms.
## 5. Manufacturing & Sourcing Capabilities
Local manufacturing and sourcing provide better control over product availability and supply-chain efficiency.
## 6. Brand Loyalty
Bata benefits from strong recall among Indian consumers, particularly in categories such as school shoes, formal footwear and everyday footwear.
---
# 12. Key Growth Drivers
### Rising Disposable Income
As household incomes increase, consumers tend to purchase more branded and premium footwear.
### Formalization of the Footwear Market
Consumers are gradually shifting from unorganized footwear sellers toward organized brands.
### Premiumization
Consumers are increasingly willing to pay for:
* Better design
* Comfort
* Technology
* Brand
* Durability
### Casualization
The growing popularity of:
* Sneakers
* Sports shoes
* Casual footwear
* Athleisure
creates opportunities for brands such as Power and North Star.
### Women's Participation in Workforce
Increasing female workforce participation can support demand for formal and fashionable women's footwear. Bata identifies this as one of the structural growth drivers of the industry. ( )
### Tier 2 & Tier 3 Cities
Smaller cities represent an important expansion opportunity for organized footwear retailers.
### E-Commerce
Online shopping allows Bata to reach consumers beyond the physical store network.
---
# 13. Franchise Business Model
Franchising is an increasingly important component of Bata's expansion strategy.
### Basic Structure
**Bata Brand**
↓
**Franchise Partner**
↓
**Investment + Store Operations**
↓
**Bata Products & Brand**
↓
**Consumer Sales**
This model allows Bata to expand into new locations without bearing the entire capital and operating burden of company-owned stores.
It is particularly useful for:
* Tier 2 cities
* Tier 3 cities
* Tier 4/5 markets
* Smaller towns
Bata has described franchising as a strategic growth engine for expanding into markets beyond major metros. ( )
---
# 14. Cost Structure
Major costs include:
* Raw materials
* Leather and synthetic materials
* Rubber and plastics
* Manufacturing
* Employee costs
* Store rentals
* Store operating expenses
* Advertising and marketing
* Logistics
* Distribution
* Inventory
* Technology
* E-commerce expenses
Rent and employee costs are particularly relevant because Bata operates a large physical retail network.
---
# 15. Inventory-Based Business
Footwear retail requires careful inventory management because products vary by:
* Size
* Colour
* Style
* Season
* Gender
* Age group
* Fashion trends
Poor inventory management can result in:
**Excess Inventory → Discounts → Lower Gross Margin**
Therefore, Bata's ability to manage product assortment and inventory turnover is important for profitability.
---
# 16. Major Risks
### 1. Competition
Bata faces competition from:
* International brands
* Indian footwear companies
* Sportswear brands
* E-commerce brands
* Local footwear manufacturers
### 2. Fashion Risk
Consumer preferences change quickly, particularly in sneakers and fashion footwear.
### 3. Weak Consumer Spending
Footwear is a discretionary purchase in many categories. Economic weakness can affect premium and fashion footwear demand.
### 4. High Retail Costs
A large store network creates expenses related to:
* Rent
* Employees
* Utilities
* Maintenance
### 5. Inventory Risk
Slow-moving styles or sizes can result in markdowns.
### 6. Raw Material Inflation
Changes in the prices of leather, synthetic materials, rubber and other inputs can affect margins.
### 7. E-Commerce Competition
Online-first footwear brands can compete aggressively on:
* Price
* Discounts
* Variety
* Convenience
---
# 17. Bata's Revenue Model
The company's revenue can broadly be viewed across these channels:
| Channel | Business Model |
| ------------------------ | ------------------------------ |
| **Company-Owned Stores** | Direct retail sales |
| **Franchise Stores** | Franchise-led retail expansion |
| **E-Commerce** | Direct digital sales |
| **Marketplaces** | Online marketplace sales |
| **Wholesale** | Sale to trade partners |
| **Institutional** | B2B / institutional sales |
| **Exports** | International sales |
Bata's FY2025-26 reporting indicates that its core business remains overwhelmingly concentrated in footwear and accessories, while its distribution model spans retail and non-retail channels. ( )
---
# 18. Business Model – Simplified
| Component | Bata India |
| ------------------ | ------------------------------------------------------------ |
| **Industry** | Footwear & Consumer Discretionary |
| **Core Business** | Footwear & Accessories |
| **Major Brands** | Bata, Power, Hush Puppies, North Star, Floatz, Bubblegummers |
| **Customers** | Men, Women, Children, Institutions |
| **Revenue Model** | Product Sales |
| **Retail Model** | Company-Owned + Franchise |
| **Digital Model** | Website + App + Marketplaces |
| **Wholesale** | Dealers, Multi-Brand Outlets, Key Accounts |
| **Key Strength** | Brand + Distribution + Retail Network |
| **Growth Drivers** | Premiumization, Casualization, Organized Retail, E-commerce |
| **Major Risks** | Competition, Fashion Risk, Inventory, Retail Costs |
---
# 19. Business Model in One Line
**Bata India follows a brand-led footwear retail model that combines company-owned stores, franchising, wholesale distribution and digital commerce to sell footwear and accessories across value, mainstream and premium consumer segments.**
## Investment Perspective
Bata India can be viewed as a **strong-brand, retail-led footwear company with a large physical distribution network and increasing omnichannel and franchise penetration**.
The long-term opportunity comes from:
**Branded Footwear Adoption**
* **Rising Disposable Income**
* **Premiumization**
* **Sneaker & Athleisure Growth**
* **Tier 2/3 Expansion**
* **E-Commerce**
The key factors to monitor are **same-store sales growth, volume growth, store productivity, franchise expansion, gross margins, inventory turnover, premiumization and the ability to compete with fast-growing sports and fashion footwear brands**.
For context, Bata India's FY2025-26 revenue from operations was approximately **₹3,515 crore**, up about **0.8%** from FY2024-25, while reported net profit declined year-on-year. This highlights the importance of monitoring not just sales growth but also operating margins and profitability.
 Long
Long
Voltas Bearish View# Voltas Limited – Business Model
## 1. Company Overview
Voltas Limited is a Tata Group company operating across **air conditioning, cooling products, engineering projects, and industrial equipment**. The company has evolved from being primarily an engineering and air-conditioning business into a diversified consumer and engineering solutions company.
Its business model combines **B2C consumer products** with **B2B engineering and project businesses**, providing diversification across end markets.
Voltas' current reporting structure comprises three broad segments: **Unitary Cooling Products (UCP), Electro-Mechanical Projects & Services (EMPS), and Engineering Products & Services (EP&S).** ( )
---
# 2. Major Business Segments
## A. Unitary Cooling Products
This is the company's core consumer-facing business.
Major products include:
* Room Air Conditioners
* Air Coolers
* Air Purifiers
* Water Dispensers
* Water Coolers
* Commercial Refrigeration
* Visi Coolers
* Chest Freezers
* Convertible Freezers
Voltas also provides after-sales service for its cooling products.
The UCP segment is strongly linked to India's growing demand for residential and commercial cooling. ( )
### Room Air Conditioners
Room air conditioners are particularly important to Voltas.
The company has historically maintained a leading position in India's room air-conditioner market, giving it significant brand recognition and distribution strength. ( )
---
# 3. Electro-Mechanical Projects & Services
This is the company's major **B2B engineering and project business**.
It provides solutions such as:
### MEP
* Mechanical systems
* Electrical systems
* Plumbing
* Fire protection
* Extra-low-voltage systems
### HVAC
* Heating
* Ventilation
* Air conditioning
* Central cooling systems
### Infrastructure
Voltas and its subsidiaries participate in projects involving:
* Water infrastructure
* Electrical projects
* Solar projects
* Industrial infrastructure
* Data centres
* Electronics manufacturing
* Smart infrastructure
This business generates revenue primarily through **project execution and engineering contracts**. ( )
---
# 4. Engineering Products & Services
The third business area focuses on specialised industrial products and services.
Major activities include:
### Textile Machinery
Voltas participates in the textile machinery market through distribution and related services.
Products and solutions can include:
* Textile machinery
* Spinning machinery
* Humidification systems
* Embroidery machinery
* Knitting machinery
* Accessories
### Mining & Construction Equipment
The business also provides equipment and support services for:
* Mining
* Construction
* Earthmoving
* Heavy equipment
### After-Sales Services
Maintenance, spare parts and service support provide an additional recurring revenue component.
---
# 5. How Voltas Makes Money
Voltas essentially operates through **three revenue engines**:
### Consumer Product Sales
Manufacturing / sourcing cooling products
↓
Dealers & Distributors
↓
Retailers / E-commerce
↓
Consumers
↓
Product Sales + After-Sales Service
### Engineering Projects
Customer / Government / Developer
↓
Project Tender / Contract
↓
Engineering & Procurement
↓
Project Execution
↓
Milestone-Based Revenue
### Industrial Products
Manufacturer / Global Supplier
↓
Voltas Distribution Network
↓
Industrial Customer
↓
Equipment Sale + Service
---
# 6. Customer Segments
Voltas serves a diversified customer base.
### Residential Consumers
Major products include:
* Air conditioners
* Air coolers
* Air purifiers
* Water heaters and related consumer appliances
### Commercial Customers
* Offices
* Hotels
* Hospitals
* Shopping malls
* Retail facilities
* Commercial buildings
### Industrial Customers
* Manufacturing companies
* Mining companies
* Textile manufacturers
* Infrastructure companies
### Government & Institutional Customers
Voltas participates in infrastructure and engineering projects involving government and institutional customers.
---
# 7. Voltas Beko
Voltas has also expanded into the **home-appliance market through Voltas Beko**, a joint venture with Arçelik.
The business provides products such as:
* Refrigerators
* Washing machines
* Dishwashers
* Kitchen appliances
* Other household appliances
This provides Voltas with an opportunity to expand beyond air conditioning and participate in the broader Indian home-appliance market. ( )
---
# 8. Distribution Model
Distribution is one of Voltas' important competitive advantages.
The company reaches customers through:
* Dealers
* Distributors
* Retailers
* Modern retail
* E-commerce
* Institutional sales
* Project sales
Voltas has built a large customer-touchpoint network across India. Its official business information states that the company has more than **30,000 customer touchpoints**. ( )
---
# 9. Manufacturing & Sourcing Model
Voltas uses a combination of:
* In-house manufacturing
* Contract manufacturing
* Component sourcing
* Supplier partnerships
* Global sourcing
The company has manufacturing capabilities for selected cooling products, while other products may involve sourcing and strategic manufacturing partnerships.
The objective is to balance:
**Cost + Quality + Capacity + Product Availability**
---
# 10. Seasonal Business Model
Voltas' consumer cooling business has a significant seasonal component.
### Peak Season
Generally associated with:
**Summer → Higher temperatures → Higher AC demand → Higher sales**
### Off-Season
Demand can moderate during:
**Monsoon / Winter → Lower cooling demand → Lower sales**
Therefore, weather conditions can have a meaningful impact on quarterly revenue and profitability.
The company's FY2025-26 performance demonstrated this sensitivity, with volatile weather and an early monsoon affecting the UCP business. ( )
---
# 11. Key Growth Drivers
## Rising Temperatures
Increasing temperatures and longer periods of heat can increase demand for air conditioning and cooling products.
## Low AC Penetration
India still has significant room for growth in household air-conditioner penetration.
## Rising Income
Higher disposable income can encourage households to purchase air conditioners and premium appliances.
## Urbanization
Urbanization increases demand for:
* Residential cooling
* Commercial HVAC
* Infrastructure
* Modern appliances
## Premiumization
Consumers increasingly prefer:
* Inverter ACs
* Energy-efficient ACs
* Smart ACs
* Higher-capacity products
* Premium appliances
## Commercial Infrastructure
Growth in:
* Data centres
* Hotels
* Airports
* Hospitals
* Offices
* Industrial facilities
can create opportunities for Voltas' HVAC and MEP businesses.
---
# 12. Competitive Advantages
### 1. Strong Tata Brand
Being part of the Tata Group provides significant brand credibility.
### 2. Strong AC Brand
Voltas has established a leading position in the Indian room-air-conditioner market. ( )
### 3. Distribution Network
A large dealer and retailer ecosystem provides extensive market reach.
### 4. Engineering Expertise
Decades of experience in HVAC and engineering projects provide technical capabilities.
### 5. Diversified Business
Voltas is not dependent solely on residential AC sales.
It has exposure to:
**Consumer Cooling + Commercial HVAC + Infrastructure + Industrial Equipment + Home Appliances**
### 6. After-Sales Network
A large service network supports customer retention and brand loyalty.
---
# 13. Cost Structure
Major costs include:
* Raw materials
* Electronic components
* Compressors
* Copper
* Aluminum
* Steel
* Plastics
* Manufacturing
* Employee costs
* Logistics
* Advertising
* Distribution
* Warranty and service
* Project execution costs
Commodity prices can influence product margins, particularly in the cooling-products business.
---
# 14. Major Risks
### 1. Weather Risk
Poor summer conditions can reduce AC demand.
### 2. Competition
The Indian AC market has intense competition from domestic and international brands.
### 3. Commodity Inflation
Higher copper, aluminum, steel and component prices can pressure margins.
### 4. Project Execution Risk
Large engineering projects can face:
* Cost overruns
* Delays
* Working-capital requirements
* Execution challenges
### 5. Working Capital
Project businesses can require substantial working capital because payments may be linked to project milestones.
### 6. Seasonality
Consumer cooling revenue can fluctuate significantly between quarters.
### 7. Consumer Durable Competition
Voltas Beko competes against established appliance brands across refrigerators, washing machines and other categories.
---
# 15. Voltas Business Model – Simplified
| Component | Voltas |
| ---------------------- | ----------------------------------------------------------- |
| **Industry** | Consumer Durables, Cooling & Engineering |
| **Core Product** | Air Conditioners & Cooling Products |
| **Major Segments** | UCP, EMPS, EP&S |
| **Consumer Brands** | Voltas, Voltas Beko |
| **Customers** | Consumers, Businesses, Industries, Government |
| **Revenue Model** | Product Sales + Project Revenue + Services |
| **Distribution** | Dealers, Distributors, Retail, E-commerce |
| **Key Strength** | Brand + Distribution + Engineering Expertise |
| **Key Growth Drivers** | Cooling Demand, Urbanization, Income Growth, Infrastructure |
| **Major Risks** | Weather, Competition, Commodity Costs, Project Execution |
| **Business Nature** | B2C + B2B |
---
# 16. FY2024-25 Business Mix
For FY2024-25, Voltas reported consolidated segment revenue of approximately **₹15,340 crore**:
| Segment | Revenue |
| ------------------------------------------ | ----------------: |
| **Unitary Cooling Products** | ₹10,614 crore |
| **Electro-Mechanical Projects & Services** | ₹4,157 crore |
| **Engineering Products & Services** | ₹569 crore |
| **Total** | **₹15,340 crore** |
UCP was therefore the largest revenue contributor, while engineering and project businesses provided diversification. ( )
---
# 17. Business Model in One Line
**Voltas follows a diversified B2C and B2B business model, combining a strong consumer cooling franchise with engineering, infrastructure and industrial solutions to generate revenue through product sales, project execution and after-sales services.**
## Investment Perspective
Voltas can be viewed as a **leading Indian cooling and air-conditioning franchise with an additional engineering and project business**.
The long-term investment story depends on several factors:
**Increasing AC penetration**
* **Rising temperatures**
* **Higher household incomes**
* **Urbanization**
* **Commercial infrastructure growth**
* **Strong brand and distribution**
However, investors should also monitor **weather-driven seasonality, competitive intensity, commodity prices, project execution, working capital and the profitability of the consumer-durables expansion**.
 Short
Short
Bullish View Havells# Havells India – Business Model
## 1. Company Overview
Havells India Limited is a leading Indian consumer electrical and home-appliance company. Its business covers a wide range of electrical products used in **homes, commercial buildings, infrastructure projects and industrial applications**.
The company has built its business around strong brands, a wide distribution network, manufacturing capabilities, product innovation and an extensive retail presence.
Havells operates across categories such as **switchgear, cables, wires, lighting, fans, electrical appliances, air conditioners, water heaters and other consumer electrical products**.
---
## 2. Major Business Segments
### A. Cables & Wires
Cables and wires are an important part of Havells' business.
Products include:
* Power cables
* Building wires
* Industrial cables
* Flexible cables
* Communication-related cables
* Specialized electrical cables
The company serves both residential and industrial requirements.
---
### B. Switchgear
Havells manufactures electrical protection and control products such as:
* MCBs
* RCCBs
* Distribution boards
* Switches
* Circuit protection equipment
* Industrial switchgear
These products are used in homes, offices, factories and infrastructure projects.
---
### C. Lighting
Havells operates in the lighting segment through products such as:
* LED bulbs
* LED fixtures
* Panel lights
* Downlights
* Decorative lighting
* Commercial lighting solutions
* Industrial lighting
Lighting provides exposure to both replacement demand and new construction.
---
### D. Fans
Havells is a major player in the Indian fan market.
Its portfolio includes:
* Ceiling fans
* Decorative fans
* High-speed fans
* BLDC fans
* Exhaust fans
* Personal fans
The company increasingly focuses on energy-efficient and technologically advanced fans.
---
### E. Consumer Appliances
Havells has expanded significantly into consumer appliances.
Products include:
* Water heaters
* Air conditioners
* Air coolers
* Room heaters
* Electric kettles
* Toasters
* Mixer grinders
* Other kitchen and household appliances
This segment provides Havells with opportunities to increase its presence in the consumer durable market.
---
### F. Switches & Home Electricals
Havells also sells:
* Modular switches
* Sockets
* Home automation products
* Electrical accessories
* Smart electrical products
These products complement its existing electrical portfolio.
---
# 3. How Havells Makes Money
Havells primarily follows a **product manufacturing and distribution model**.
### Business Flow
**Raw Materials & Components**
↓
**Manufacturing / Procurement**
↓
**Branding & Product Development**
↓
**Distributors / Dealers / Retailers**
↓
**Electrical Contractors / Builders / Consumers**
↓
**Product Sales**
Revenue is primarily generated through the sale of electrical and consumer-durable products.
---
# 4. Customer Segments
Havells serves multiple customer categories.
### Residential Consumers
Households purchase:
* Fans
* Wires
* Switches
* Lighting products
* Air conditioners
* Water heaters
* Appliances
### Commercial Customers
Offices, hotels, hospitals, malls and commercial buildings require electrical and lighting solutions.
### Industrial Customers
Factories and industrial facilities require cables, switchgear and electrical equipment.
### Infrastructure & Construction
Builders and infrastructure companies require electrical products during construction and project development.
### Electrical Contractors
Contractors and electricians are an important part of the distribution ecosystem because they influence product selection and installation.
---
# 5. Brand Portfolio
Havells has developed a portfolio of brands to address different categories and customer segments.
Important brands associated with the company include:
* **Havells**
* **Lloyd**
* **Crabtree**
* **Standard Electricals**
* **REO**
The multi-brand approach allows Havells to participate across different price points and product categories.
---
# 6. Lloyd Acquisition and Consumer Durables
The acquisition of **Lloyd** helped Havells expand beyond traditional electrical products into consumer durables.
Lloyd provides Havells exposure to categories such as:
* Air conditioners
* Refrigerators
* Televisions
* Other consumer electronics and appliances
The strategy enables Havells to participate in the rapidly growing Indian consumer-durables market.
---
# 7. Distribution Model
One of Havells' biggest competitive strengths is its distribution network.
The company reaches consumers through:
* Dealers
* Distributors
* Retailers
* Electrical stores
* Modern retail
* E-commerce
* Institutional sales
* Project sales
Its distribution network provides extensive reach across Indian markets.
---
# 8. Retail Strategy
Havells has developed an extensive retail ecosystem.
Its products are available through electrical retailers as well as organized retail and online platforms.
The company has also invested in dedicated retail formats and brand experience centers.
This helps Havells maintain direct visibility with consumers and strengthen brand recognition.
---
# 9. Manufacturing Model
Havells has established manufacturing capabilities across several product categories.
Manufacturing provides the company with greater control over:
* Product quality
* Production efficiency
* Product innovation
* Supply-chain management
* Product customization
The company also works with suppliers for components and raw materials.
---
# 10. Key Raw Materials
Havells' cost structure is influenced by commodity prices.
Major inputs can include:
* Copper
* Aluminum
* Steel
* Plastics
* Electronic components
* Motors
* Compressors
* Other electrical components
Copper and aluminum prices are particularly important for the cables and wires business.
Therefore:
**Higher commodity prices → Higher input costs → Margin pressure**
unless the company is able to pass the increased costs to customers.
---
# 11. Key Competitive Advantages
### 1. Strong Brand
Havells has developed strong consumer recognition in India's electrical-products market.
### 2. Distribution Network
Its extensive dealer and retailer network provides significant market reach.
### 3. Product Diversification
The company operates across multiple categories instead of relying on a single product.
### 4. Manufacturing Capability
In-house manufacturing provides greater control over quality and product development.
### 5. Premium Positioning
Havells has historically focused strongly on branded and value-added products rather than competing purely on price.
### 6. Consumer Focus
The company has increasingly shifted from being primarily an electrical-products company toward becoming a broader consumer electrical and durable-products company.
---
# 12. Growth Strategy
Havells' growth strategy can broadly be understood through five areas:
### Premiumization
Increasing the contribution of higher-value products with better features and technology.
### Consumer Durables
Expansion into air conditioners, water heaters and other household appliances.
### Energy Efficiency
Growing demand for:
* BLDC fans
* Energy-efficient lighting
* Efficient air conditioners
* Smart electrical products
### Digital & Smart Products
Connected and smart-home products can increase the value of the company's product portfolio.
### Distribution Expansion
Increasing penetration into smaller cities and towns provides an opportunity for long-term growth.
---
# 13. B2B + B2C Business Model
One of Havells' important characteristics is its combination of **B2B and B2C markets**.
### B2B
Products are sold for:
* Infrastructure
* Construction
* Commercial buildings
* Industrial applications
* Electrical projects
### B2C
Products are directly purchased by consumers through:
* Retailers
* Dealers
* Modern retail
* E-commerce
This combination diversifies the company's revenue sources.
---
# 14. Revenue Drivers
Havells' revenue growth is influenced by:
**Volume Growth**
More electrical products sold.
**Price Growth**
Higher product prices and commodity pass-through.
**Premiumization**
Customers shifting toward higher-value products.
**New Categories**
Expansion into consumer durables and appliances.
**Distribution Expansion**
Increasing penetration into new geographic markets.
**Replacement Demand**
Consumers replacing old electrical products and appliances.
---
# 15. Major Risks
### Commodity Price Risk
Copper, aluminum and other raw materials can significantly affect margins.
### Competition
The electrical and consumer-durable industries are highly competitive.
### Consumer Spending
Appliances such as air conditioners and premium electrical products can be affected by economic cycles.
### Seasonality
Certain products, especially fans and air conditioners, can experience significant seasonal demand.
### Lloyd Integration
Consumer durables require substantial investment in technology, distribution, advertising and after-sales service.
### Technology Changes
Rapid technological developments require continuous investment in product innovation.
---
# 16. Havells Business Model – Simplified
| Component | Havells India |
| --------------------- | ---------------------------------------------------------------- |
| **Industry** | Consumer Electricals & Consumer Durables |
| **Core Markets** | Residential, Commercial, Industrial |
| **Major Products** | Cables, Wires, Switchgear, Fans, Lighting, Appliances |
| **Major Brands** | Havells, Lloyd, Crabtree, Standard Electricals, REO |
| **Revenue Model** | Product Sales |
| **Distribution** | Dealers, Distributors, Retailers, E-commerce, Projects |
| **Customers** | Consumers, Contractors, Builders, Industries |
| **Key Raw Materials** | Copper, Aluminum, Steel, Plastics, Electronics |
| **Key Strengths** | Brand, Distribution, Product Portfolio, Manufacturing |
| **Growth Drivers** | Urbanization, Premiumization, Electrification, Consumer Durables |
| **Major Risks** | Commodity Prices, Competition, Seasonality, Economic Cycles |
---
# 17. Business Model in One Line
**Havells follows a diversified consumer electrical and durable-products business model, combining strong brands, manufacturing capabilities and an extensive distribution network to sell value-added electrical and household products across India's residential, commercial and industrial markets.**
### Investment Perspective
Havells can be viewed as a **brand-led consumer electrical company gradually expanding toward a broader consumer-durables platform**. Its long-term growth potential is linked to India's rising electrification, urbanization, increasing household incomes, premiumization, replacement demand and adoption of energy-efficient electrical
 Long
Long
 Long
Long
Wait Till Level Near 500# Whirlpool Business Model
## 1. Company Overview
Whirlpool Corporation is a global home-appliance company known for manufacturing and marketing household appliances such as refrigerators, washing machines, dryers, cooking appliances, dishwashers, and related products.
The company operates primarily through a **consumer appliance business model**, where it designs products, manufactures them through its production network, distributes them through retail and digital channels, and earns revenue from the sale of appliances and related services.
Whirlpool competes through a combination of **strong brands, product innovation, technology, manufacturing capabilities, distribution reach, and after-sales service**.
---
## 2. Core Business Segments
Whirlpool's business is broadly built around major categories of home appliances:
### Refrigeration
* Refrigerators
* Freezers
* French-door refrigerators
* Side-by-side refrigerators
* Built-in refrigeration solutions
### Laundry
* Washing machines
* Dryers
* Washer-dryer combinations
* Front-load and top-load machines
### Cooking
* Ovens
* Ranges
* Cooktops
* Microwaves
### Dishwashing
* Dishwashers
* Integrated kitchen cleaning solutions
### Small & Related Appliances
Depending on the market, the company also participates in selected adjacent appliance categories and related consumer solutions.
---
# 3. How Whirlpool Makes Money
Whirlpool primarily generates revenue through **selling appliances to consumers and businesses**.
### Revenue Flow
**Product Design & Innovation**
↓
**Manufacturing / Sourcing**
↓
**Distribution Network**
↓
**Retailers / E-commerce / Dealers**
↓
**Consumers**
↓
**Product Sales + Services + Parts**
The major revenue driver remains the sale of finished appliances.
Additional economic value can come from:
* Replacement parts
* Extended warranties
* After-sales services
* Accessories
* Premium product features
* Connected-home products and services
---
# 4. Customer Segments
Whirlpool serves several customer groups:
### Individual Consumers
Households purchasing refrigerators, washing machines, cooking appliances and other products.
### Premium Consumers
Customers looking for higher-end appliances with advanced technology, design and convenience features.
### Mass-Market Consumers
Price-sensitive consumers looking for reliable and affordable appliances.
### Builders & Developers
Large residential projects may purchase appliances in bulk.
### Retailers and Distributors
Whirlpool also operates through large retail chains, dealers and distribution partners.
---
# 5. Brand Strategy
One of Whirlpool's important competitive advantages is its portfolio of established appliance brands.
The company has historically operated multiple brands to address different customer segments and price points.
A multi-brand strategy allows Whirlpool to target:
* Value-conscious consumers
* Mainstream consumers
* Premium customers
* Different geographical markets
* Different appliance categories
This helps the company avoid depending entirely on a single brand or customer segment.
---
# 6. Product Differentiation
Whirlpool attempts to differentiate its products through:
### Innovation
Development of new appliance technologies and features.
### Energy Efficiency
Products designed to consume less electricity and water.
### Convenience
Features that simplify household activities.
### Smart Appliances
Connected appliances with digital controls, sensors and smart-home integration.
### Design
Modern aesthetics and premium finishes help Whirlpool compete in higher-value segments.
### Reliability
Durability and product performance are important factors in appliance purchasing decisions.
---
# 7. Manufacturing Model
Whirlpool follows a combination of:
* Internal manufacturing
* Global sourcing
* Supplier relationships
* Regional production facilities
* Distribution centers
Manufacturing efficiency is extremely important because appliances are relatively large physical products with significant transportation and storage costs.
The company therefore focuses heavily on:
**Scale + Automation + Procurement + Supply Chain Efficiency**
---
# 8. Distribution Model
Whirlpool uses multiple sales channels.
### Retail Stores
Traditional appliance retailers remain an important channel.
### Dealers and Distributors
Local and regional dealers help Whirlpool reach consumers across markets.
### E-commerce
Online marketplaces and company-operated digital channels allow consumers to research and purchase appliances online.
### Institutional / Project Sales
Products can also be sold to builders, developers and other institutional customers.
---
# 9. Competitive Advantage
Whirlpool's key competitive advantages include:
**1. Established Brands**
Strong consumer recognition accumulated over decades.
**2. Global Scale**
Large-scale procurement, manufacturing and distribution capabilities.
**3. Product Innovation**
Continuous development of new appliance technologies.
**4. Distribution Network**
Strong relationships with retailers, dealers and distributors.
**5. Consumer Understanding**
Extensive experience in household appliance requirements.
**6. Manufacturing Expertise**
Large-scale production capabilities provide potential cost advantages.
---
# 10. Cost Structure
Major costs include:
* Raw materials
* Components
* Manufacturing expenses
* Employee costs
* Logistics and transportation
* Advertising and marketing
* Research and development
* Distribution
* Warranty and after-sales service
* Energy and facility costs
Important raw materials and components can include:
* Steel
* Aluminum
* Plastics
* Electronics
* Motors
* Compressors
* Semiconductors
* Other specialized components
Therefore, commodity prices and supply-chain conditions can significantly influence margins.
---
# 11. Key Growth Drivers
Whirlpool's future growth can be supported by:
### Rising Household Income
Higher disposable income encourages consumers to upgrade from basic to premium appliances.
### Urbanization
Urban households increasingly demand modern appliances that save time and space.
### Appliance Replacement Cycle
Appliances eventually require replacement, creating recurring demand.
### Premiumization
Consumers may shift toward higher-priced products with better technology and design.
### Energy-Efficient Appliances
Growing awareness of electricity and water consumption supports demand for efficient appliances.
### Smart Homes
Connected appliances provide opportunities for technology-driven product differentiation.
### Emerging Markets
Increasing appliance penetration in developing economies can create long-term growth opportunities.
---
# 12. Major Risks
### Economic Slowdown
Appliances are durable goods, so consumers may postpone purchases during economic downturns.
### Raw Material Inflation
Higher steel, plastics, electronics and other input costs can pressure margins.
### Competition
The appliance industry is highly competitive, with both global and regional manufacturers.
### Supply-Chain Disruptions
Component shortages and logistics problems can affect production and deliveries.
### Currency Fluctuations
Global operations expose Whirlpool to foreign-exchange movements.
### Interest Rates
Higher interest rates can reduce consumer spending on large-ticket products.
### Changing Consumer Preferences
Rapid technological and design changes require continuous investment in innovation.
---
# 13. Business Model in One Line
**Whirlpool's business model is based on designing, manufacturing, branding and distributing household appliances through a global network of retailers, dealers and digital channels, while creating value through innovation, premiumization, scale and strong consumer brands.**
---
## 14. Simplified Business Model
| Component | Whirlpool |
| ------------------ | ------------------------------------------------------------------------ |
| **Industry** | Consumer Durables / Home Appliances |
| **Core Products** | Refrigerators, Washing Machines, Dryers, Cooking Appliances, Dishwashers |
| **Customers** | Households, Retailers, Builders, Institutions |
| **Revenue Model** | Sale of Appliances + Services/Parts |
| **Distribution** | Retail, Dealers, Distributors, E-commerce |
| **Key Strength** | Brands + Scale + Innovation |
| **Major Costs** | Raw Materials, Manufacturing, Logistics, Marketing |
| **Growth Drivers** | Replacement Demand, Premiumization, Urbanization, Smart Appliances |
| **Major Risks** | Competition, Input Costs, Economic Cycles, Supply Chain |
### Investment Perspective
Whirlpool can be viewed as a **consumer durable company with a replacement-driven demand cycle**. The quality of its business depends heavily on brand strength, market share, product innovation, manufacturing efficiency and its ability to protect margins against commodity and operating-cost inflation.
 Long
Long
 Long
Long
 Long
Long
 Long
Long
 Long
Long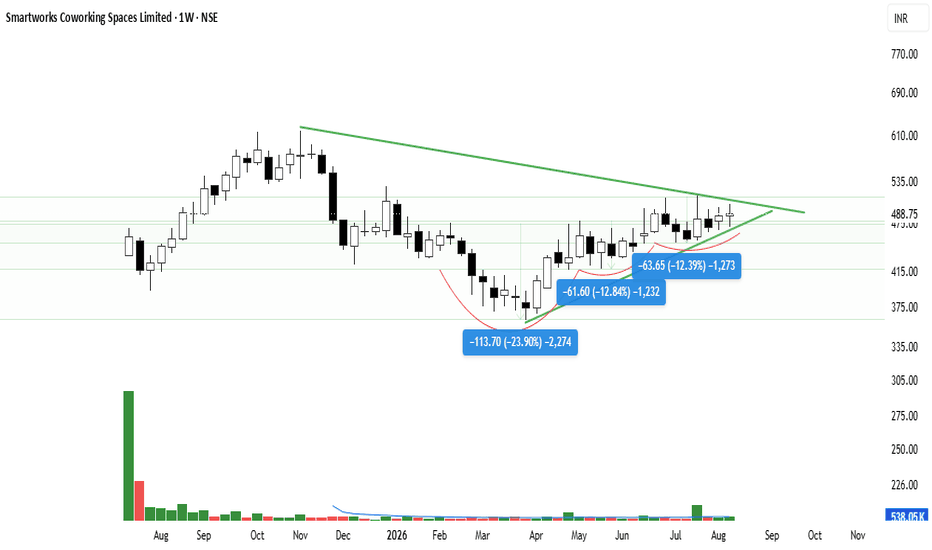
 Long
Long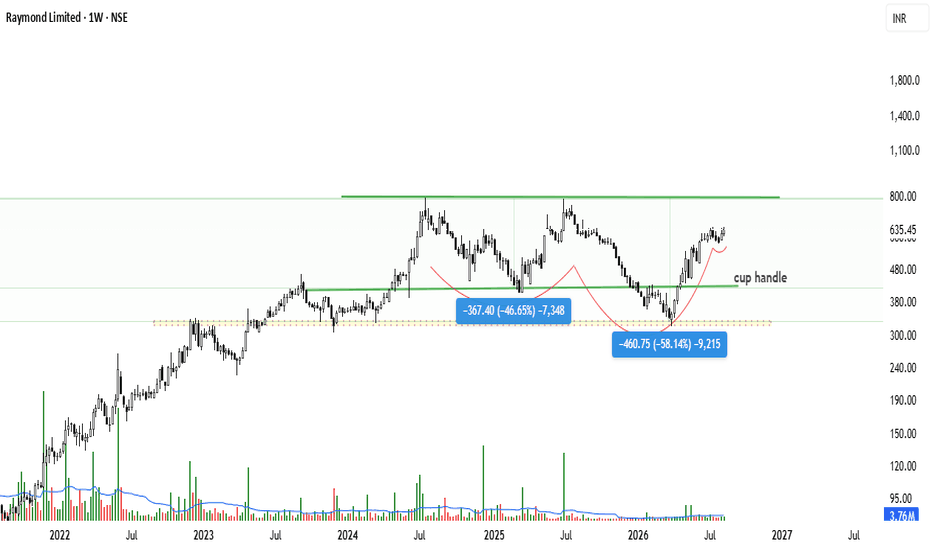
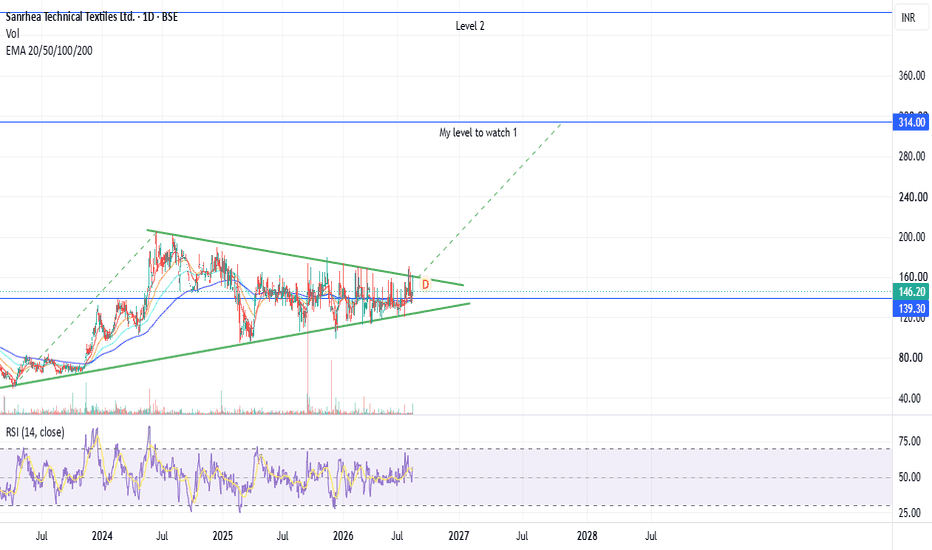
Sanrhea Technical Textiles - Long above the wedgesA Gujarat weaver incorporated in 1983 found its actual business in 1997, at a small converting shed in Kalol.
It weaves heavy nylon and polyester on Sulzer looms up to 3.5 metres wide, then dips the cloth in resorcinol formaldehyde latex so rubber will bond to it and stay bonded.
That dipping step is the whole company: a belt that delaminates or a tyre whose chafer fails is a warranty event for a customer many times its size, so tyre and belt makers qualify slowly and leave reluctantly.
For twenty years it was too small to matter, losing money in FY16 on Rs 19.89 crore of revenue and losing money again in FY20.
Through those years Tushar Patel quietly did the one thing that counts: he bought, taking warrants in FY18, FY19, October 2021 and FY26, walking his stake from 52.02 percent to 74.98 percent with his own money and no pledge behind it.
Every one of those rounds also diluted everybody else, and at 74.98 percent the route is now closed.
FY22 was the turn, revenue nearly doubling to Rs 68.31 crore at a 34 percent ROCE, with margins finding a 12 to 14 percent band the company had never held.
FY25 was the price of it: Rs 5 crore of capex, borrowings at Rs 14.04 crore, free cash flow at minus Rs 6.39 crore.
FY26 collected the bill, delivering Rs 80.45 crore of revenue, Rs 12.67 crore of operating cash against Rs 11.06 crore of operating profit, and debt cut to Rs 4.00 crore.
Then June 2026 printed the biggest quarter in company history, revenue up 59.6 percent and profit up 102 percent, because the new capacity is running while the interest bill shrinks.
Two lines spoil the party.
Margin in that record quarter was 11.96 percent against 18.79 percent in March, so the growth is volume bought with price, not pricing power earned.
And on 19 December 2025 shareholders voted the managing director up to Rs 21 lakh a month plus 1 percent of profits, Rs 2.52 crore of fixed salary against Rs 5.68 crore of earnings, contracted for three years.
At Rs 151 the market pays 12.8 times trailing for a real niche, a repaired balance sheet, a qualification moat that has never shown up in margin, and a promoter who has taken more at every opportunity.
This is looking like a turnaround and the Cashflow to Netprofit is good over 1.5.. I am long on it. Disclaimer - I might be invested. I might sell anytime or buy and sell anytime now or in the future. This is just for tracking and learning. Techno-funda case with turnaround as the theme.  Long
Long