 Long
Long
 Long
Long
 Long
Long
Macpower CNC Machines (MACPOWER): Momentum BreakoutOverview:
Macpower CNC Machines Ltd. (NSE: MACPOWER) delivered a stellar performance, surging +9.52% to close at ₹2,104.50. The stock has successfully broken out of a multi-week consolidation base above the crucial ₹2,007 pivot level, backed by strong buying volume.
Technical Highlights:
Price Action: The daily chart indicates aggressive buyer participation, pushing prices near the day's high of ₹2,149.
Trend & Moving Averages: The medium-term uptrend remains robust, with prices trading firmly above major moving average lines.
Volume Profile: Expansion in volume confirms institutional interest entering the industrial manufacturing and machine tool space.
Trade Setup / Levels to Watch:
Pivot / Support Zone: ₹2,000 – ₹2,050 (acting as immediate demand support)
Upside Targets: ₹2,250 – ₹2,350
Stop Loss / Risk Management: Protect below ₹1,930 to mitigate downside risk.
Disclaimer: This analysis is for educational purposes only and does not constitute financial advice. Always perform your own due diligence before trading.  Long
Long
 Long
Long
 Long
Long
 Long
Long
 Long
Long
 Long
Long
WENDT India Ltd – Positional Swing Analysis (4H Chart)Technical View
WENDT India has finally shown signs of strength after a prolonged corrective phase. The stock has reclaimed its short-term moving averages and is attempting to break above a major resistance zone around ₹8,100–₹8,250, where sellers have repeatedly emerged.
The recent rally is supported by improving price structure and a pickup in momentum. If buyers sustain above the current breakout area with volume, the stock could enter a fresh medium-term uptrend.
Chart Structure
✅ Higher Highs & Higher Lows forming
✅ Price trading above 9 EMA, 21 EMA & 50 EMA
✅ Strong momentum after base formation
✅ Volume expansion near breakout
⚠️ Needs sustained closing above resistance for confirmation
Positional Trading Setup
Buy Zone
₹8,150 – ₹8,300
Support Levels
₹8,100 (Immediate)
₹7,700 (Strong Swing Support)
₹7,200 (Major Positional Support)
Resistance / Targets
🎯 Target 1: ₹9,100
🎯 Target 2: ₹10,250
🎯 Target 3: ₹11,500 (Long-term positional)
Stop Loss
Weekly Close below ₹7,700
Risk : Reward
Current Risk: ~6-7%
Potential Upside:
Target 1 → ~10%
Target 2 → ~24%
Target 3 → ~40%+
A favorable setup if the breakout sustains with above-average volume.  Long
Long
 Short
Short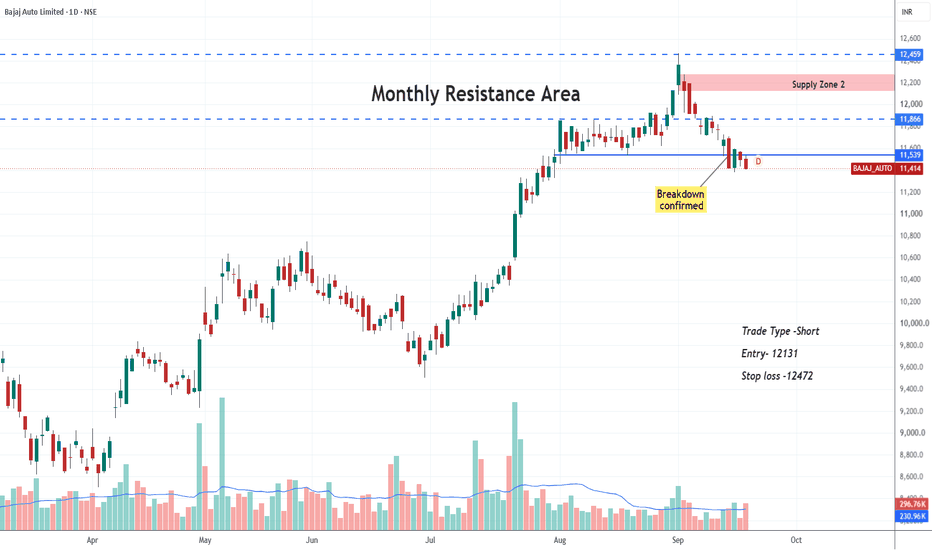
 Short
Short
 Long
Long
 Long
Long
 Long
Long
Chart Structure & Price Action JINDALSTELTrend Flip & Re-Test: Following a multi-month decline from the top (~1,300–1,400 zone) down toward the low near 980–1,020, the price bounced back to reclaim the Supertrend indicator (green shaded support area at 1,049.0). The price action shows a breakout above initial resistance followed by a downward pull to re-test the trend line before attempting a higher-high move.
Momentum Oscillator: The lower pane shows Williams %R (26) breaking above its lower downtrend line with an annotated "Early-stage bullish momentum" signal sitting near -60.18, suggesting that oversold conditions have cleared and bullish momentum is recovering.
Key Levels Annotated:
Current Price: ~1,126.0
Buy Level: Above 1,153.2 – 1,164.5
Stop Loss: 1,118.0 (Conservative) / 1,084.1 / 1,049.0 (Weekly low / Supertrend level)
Target 1: 1,164.5 / 1,196.4
Target 2: 1,196.4
Target 3: 1,244.1
Confirmation Needed: Entry is contingent on price sustaining above the 1,153.2–1,164.5 region to confirm that the trend re-test holds.
Risk Management: A breach below 1,084.1 invalids the bullish swing bias, sending price back into the Supertrend support zone at 1,049.0.
Disclaimer: aliceblueonline.com Chart Structure & Price Action JINDALSTELTrend Flip & Re-Test: Following a multi-month decline from the top (~1,300–1,400 zone) down toward the low near 980–1,020, the price bounced back to reclaim the Supertrend indicator (green shaded support area at 1,049.0). The price action shows a breakout above initial resistance followed by a downward pull to re-test the trend line before attempting a higher-high move.
Momentum Oscillator: The lower pane shows Williams %R (26) breaking above its lower downtrend line with an annotated "Early-stage bullish momentum" signal sitting near -60.18, suggesting that oversold conditions have cleared and bullish momentum is recovering.
Key Levels Annotated:
Current Price: ~1,126.0
Buy Level: Above 1,153.2 – 1,164.5
Stop Loss: 1,118.0 (Conservative) / 1,084.1 / 1,049.0 (Weekly low / Supertrend level)
Target 1: 1,164.5 / 1,196.4
Target 2: 1,196.4
Target 3: 1,244.1
Confirmation Needed: Entry is contingent on price sustaining above the 1,153.2–1,164.5 region to confirm that the trend re-test holds.
Risk Management: A breach below 1,084.1 invalids the bullish swing bias, sending price back into the Supertrend support zone at 1,049.0.
Disclaimer: aliceblueonline.com JSW Infra: Fundamentals Meet a Breakout SetupJSW Infrastructure continues to build a strong long-term growth profile through expansion of its port, cargo-handling and logistics operations. The company has also been strengthening its balance sheet to support its expansion plans, while institutional participation has increased significantly.
Fundamental Analysis
JSW Infrastructure operates in an asset-intensive industry with high entry barriers, and its financial profile reflects the benefits of scale. The company currently maintains an operating profit margin of around 48% and a net profit margin of approximately 27%. ROE stands around 14%, while ROCE is approximately 12.7%, indicating that the business continues to generate reasonable returns on the capital employed.
The long-term growth record is notable. The company's five-year net profit growth is above 400%, while operating cash flow has also increased substantially over the same period. Revenue growth remains healthy, supported by increasing cargo volumes and capacity expansion.
The latest operating numbers remain constructive. Q1 FY27 cargo volume increased to approximately 31 MT from 29.4 MT YoY, while revenue from operations increased to around ₹1,208 crore from ₹1,086 crore in the corresponding period. Operating EBITDA increased to approximately ₹601 crore, although the EBITDA margin moderated to around 49.8%.
The recent earnings picture is therefore mixed: operational growth remains intact, but PAT growth has temporarily lagged revenue and operating-profit growth.
Balance Sheet
JSW Infrastructure's leverage remains manageable. Total debt-to-equity is around 0.59x, while long-term debt-to-equity is approximately 0.55x. Interest coverage is around 7.7x, providing a reasonable cushion against interest costs.
The company's FY26 net debt-to-equity was approximately 0.27x, while net debt to operating EBITDA was around 1.19x. These levels indicate that the company has taken on additional debt for expansion, but leverage remains within a manageable range.
The company also raised approximately ₹6,555 crore through a QIP in June 2026, providing additional capital for future expansion.
Institutional Holding
One of the most notable developments in the fundamental story is the sharp increase in institutional ownership.
Institutional holding increased from approximately 9.4% in March 2026 to 20.4% in June 2026.
Within this:
FII holding: 6.9% → 11.2%
Mutual Fund holding: 2.1% → 8.7%
DII holding: approximately 2.5% → 9.2%
This represents a substantial increase in institutional participation.
Promoter holding declined from approximately 83.6% to 73.9% during the same period. However, this change needs to be viewed alongside the June 2026 QIP and the resulting increase in the company's equity base rather than being interpreted simply as promoter selling.
Valuation
The major fundamental consideration is valuation.
JSW Infrastructure trades at approximately 51x trailing earnings, around 6.7x book value, with EV/EBITDA in the high-teens. These ratios indicate that the market is assigning a significant premium to the company's future growth prospects.
Therefore, the fundamental equation is clear:
Strong business growth + improving institutional participation + manageable leverage
versus
Premium valuation + recent moderation in PAT growth.
For the valuation to remain supported over the longer term, continued revenue growth, improving earnings, disciplined capital allocation and healthy returns on incremental capital will be important
Technical Analysis
The long-term daily chart presents an interesting Cup & Handle formation.
The stock recovered from the ₹220–₹250 region and gradually moved back toward the ₹350–₹360 area, forming the cup. The subsequent consolidation around the ₹310–₹360 region represents the handle portion of the pattern.
The stock closed around ₹348.25 on September 18, 2026, after trading as high as approximately ₹356.25, with volume of around 25.41 million shares.
The price is therefore approaching an important long-term resistance zone.
Key Technical Levels
The chart identifies ₹350–₹367 as the major yearly resistance region.
Resistance
₹367 — Major breakout level
A sustained daily close above ₹367 would represent a breakout from the major resistance zone and would provide technical confirmation of the Cup & Handle structure.
The next chart-based resistance levels are:
₹396 → ₹420 → ₹465
These represent the successive upside levels marked on the chart.
Support / Reversal Zone
The ₹310–₹330 region is the key reversal and support zone.
This area becomes important because it represents the lower boundary of the recent handle/consolidation structure.
A sustained breakdown below this zone would weaken the present Cup & Handle setup and indicate that the breakout structure requires reassessment.
Cup & Handle Structure
The technical structure can therefore be visualised as:
₹310–₹330 → Reversal / Support Zone
₹350–₹367 → Major Resistance / Breakout Zone
₹367 → Breakout Confirmation
₹396 → First Major Resistance
₹420 → Next Resistance
₹465 → Higher Resistance
The most important technical confirmation would come from a sustained close above ₹367 accompanied by strong volume and improving momentum indicators.
Conclusion
JSW Infrastructure presents an interesting techno-fundamental setup. Fundamentally, the company has strong operating margins, substantial long-term earnings growth, manageable leverage and a significant increase in institutional participation. The QIP has also strengthened the capital base for future expansion.
At the same time, the valuation remains demanding, while recent PAT growth has moderated. Therefore, future earnings growth will be important in validating the current valuation.
Technically, the stock has developed a large Cup & Handle structure and is approaching the crucial ₹350–₹367 yearly resistance zone. Momentum indicators such as RSI, MACD and ADX should be monitored alongside volume for confirmation.
The key technical trigger remains ₹367. A sustained breakout above this level would place ₹396, ₹420 and ₹465 as the next chart-based resistance levels, while ₹310–₹330 remains the major structural support/reversal zone.
Disclaimer: aliceblueonline.com APARINDS - Pole & Flag BreakoutAPAR Industries is one of India's largest manufacturers of conductors, cables, and specialty transformer oils — a direct beneficiary of India's accelerating power transmission and grid modernisation capex cycle.
📊 Key Numbers (TTM / Latest):
Revenue: ₹24,389 Cr (+24% YoY)
Net Profit: ₹1,182 Cr (+34% YoY)
Q1 FY27 PAT: ₹467 Cr (+77.8% YoY) ← accelerating
ROCE: ~29.8% | ROE: ~18.1%
Operating Margin: 8.85% (expanding)
Conductor Order Book: ₹10,190 Cr (strong revenue visibility)
💰 Valuation:
TTM P/E: ~63x (elevated vs. 5Y avg of ~37x)
PEG: ~1.9x — growth is priced in, but earnings trajectory justifies the premium
🏦 Ownership (Constructive):
Promoter: 55.42% | Zero Pledge ✅
Mutual Funds: 22.28% (+2.76% YoY)
FII: 11.36% (+2.30% YoY) — rising
Total Institutional: 36.24% (+5.4pp YoY) — smart money accumulating
⚠️ Risk: High valuation leaves little room for an earnings miss. Monitor operating cash flow vs. profit growth and working capital as scale increases.
📈 TECHNICAL SETUP — Daily Chart
Pattern: Pole & Flag (Bullish Continuation)
CMP: ₹18,858 | +5.94% breakout today on elevated volume (271.8K)
The stock formed a strong impulse pole in late July–early August, followed by a consolidating flag channel drifting slightly lower through August–September. Today's breakout above the upper flag boundary on high volume is the confirmation signal.
🎯 Targets:
R1: ₹20,000 (first resistance / round number)
R2: ₹21,150 (prior swing resistance)
R3: ₹23,130 (pole projection / extended target)
🛡️ Support & Stop:
Flag Base / Stop Loss: ₹17,075
Reversal Zone (strong demand): ₹16,015 – ₹17,075
Invalidation: Sustained close below ₹16,015
🔑 SUMMARY
Fundamentally strong business (ROCE ~30%, PAT +77% in Q1 FY27, rising institutional ownership) breaking out technically from a classic Pole & Flag on strong volume. The convergence of quality fundamentals and a clean chart setup makes this a high-conviction idea for positional traders.
Watch ₹20,000 closely — how price reacts at R1 will signal whether this breakout has legs for R2 and R3.
Disclaimer: aliceblueonline.com  Long
Long


