Long
Long
Maruti Suzuki: Reversal Signs Emerging on Daily ChartMaruti Suzuki: Reversal Signs Emerging on Daily Chart
Maruti Suzuki India Ltd. – Technical View
CMP: ₹13,824
Stop Loss: ₹13,170
Targets: ₹14,570 | ₹15,440
Maruti Suzuki is showing encouraging signs of a potential trend reversal on the daily chart. The price structure resembles a Cup & Handle, Double Rounding Bottom, or even a Volatility Contraction Pattern (VCP)—all of which are considered constructive bullish formations when confirmed by a breakout.
From a broader perspective, the stock appears well-positioned for a fresh upside move if buying momentum continues. Additionally, declining crude oil prices could act as a supportive macro factor for the automobile sector, potentially benefiting Maruti through lower input and logistics costs, subject to broader market conditions.
Risk Management
Maintain strict stop-loss discipline.
Control position sizing.
Avoid overexposure in a volatile market.
Pyramiding can be considered only after a sustained move above key resistance levels with confirmation of trend continuation.
Consider partial profit booking near Target 1 and trail the stop loss thereafter.
⚠️ Be cautious in volatile markets. Maintain strict stop-loss discipline, control position sizing, avoid aggressive pyramiding, and do not overexpose capital.
⚠️ Clarification:
This is an independent analysis based purely on technical and market study. No part of Religare is involved in this view or recommendation.
📝 Important:
I am not responsible for any loss or profit incurred. I am not taking any fees for these views—just sharing my analysis for educational and informational purposes.
📉 Disclaimer:
Not SEBI-registered. Please do your own research or consult a financial advisor before taking any investment decision.  Long
Long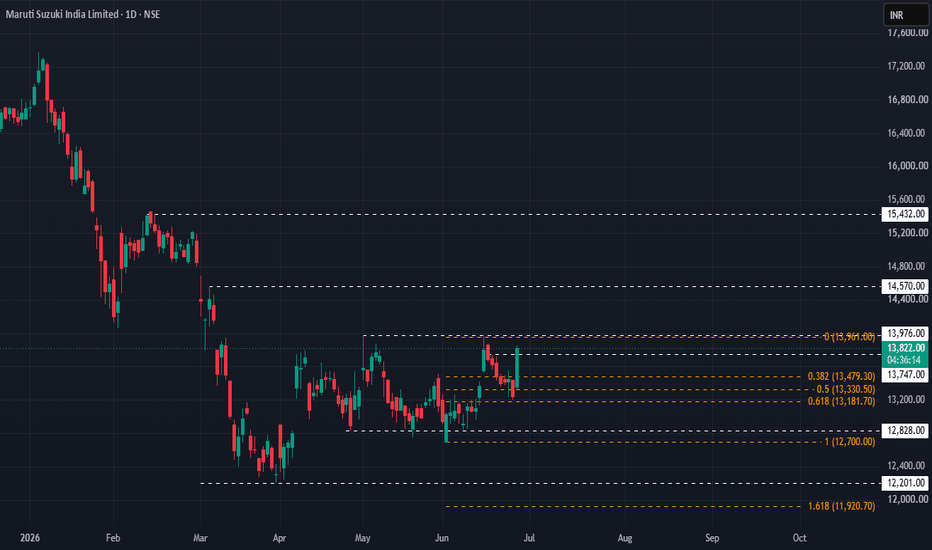
 Long
Long
 Long
Long
 Long
Long
Strides Pharma 🎯 STOCK TO WATCH
WEEKLY R4 MOMENTUM BREAKOUT SETUP
₹1,181 → ₹1,459 → ₹1,798
A pharma momentum + improving earnings setup appearing on my Weekly R4 Momentum Breakout Scanner.
💊 STRIDES PHARMA SCIENCE LTD
NSE: STAR
(Formerly known as Strides Shasun)
📌 TRADE LEVELS
🟢 Buy Zone: ₹1,181
🟠 Breakout Zone: ₹1,181
🔴 Stop Loss: ₹931
🎯 Target 1: ₹1,459
🚀 Target 2: ₹1,798
🔥 WHY STRIDES?
• Strong Q1 FY27 growth — Revenue ₹1,265 Cr, up 13% YoY.
• PAT surged 57.5% YoY to ₹156.9 Cr.
• Ex-US markets grew 17% YoY, becoming an important growth engine.
• Profitability improving — EBITDA was about ₹230 Cr in Q1 FY27.
• USFDA EIR received for its flagship Bengaluru facility, closing the May 2026 inspection.
• Net debt/EBITDA improved to 1.52x, according to the company's Q1 commentary.
👀 WHY IT CAUGHT MY ATTENTION
📈 ₹1,181 is the key technical trigger.
📈 Stock is trading close to its 52-week high of ₹1,231.
📈 Momentum has strengthened significantly.
📈 Earnings growth is supporting the technical setup.
📈 Regulatory overhang at the Bengaluru facility has recently been addressed.
⚠️ IMPORTANT
This is a high-risk momentum setup. Q1 revenue declined sequentially by 4.39%, while operating profit also eased QoQ, so continued execution and margin performance need monitoring.
Risk Defined. Reward Visible.
⚠️ This content is for educational purposes only and not investment advice. Please do your own due diligence before making any investment decisions.
© 20K Microcap Investing | R4 Momentum Desk
#StridesPharma #STAR #PharmaStocks #MomentumStocks #BreakoutStocks #IndianStocks #R4Momentum #StockToWatch  Long
Long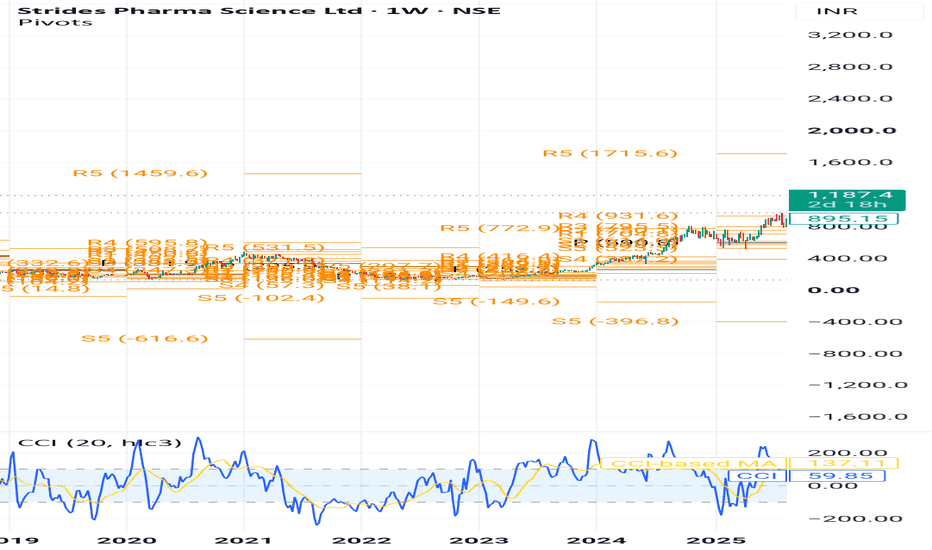
Mishra Dhatu Nigam limited 🛡️ STOCK TO WATCH 🛡️
₹476 → ₹709 → ₹1,157 👀
A defence materials + aerospace/space + strategic alloys + momentum setup appearing on my Weekly R4 Momentum Breakout Scanner.
Mishra Dhatu Nigam Ltd. (MIDHANI)
📌 Buy Zone: ₹476
📌 Breakout Zone: ₹476
🛑 Stop Loss: ₹346
🎯 Target 1: ₹709
🎯 Target 2: ₹1,157
Why MIDHANI?
🛡️ Strategic defence materials: MIDHANI manufactures superalloys, titanium alloys and special steels used across aerospace, defence, space, atomic energy and naval applications.
🚀 Aerospace & space opportunity: The company supplies titanium and superalloy products for indigenous aero-engine programmes and critical materials for Indian Navy and space applications.
📈 Strong Q1 FY27 revenue growth: Q1 FY27 revenue reached ₹239.49 Cr, up 40.46% YoY, while consolidated PAT rose approximately 27% YoY to ₹16.47 Cr.
📋 Large order visibility: The order book stood at around ₹2,329 Cr as of July 1, 2026, providing substantial revenue visibility relative to the quarterly revenue base.
🏭 Capacity & technology expansion: MIDHANI has been investing in new facilities and capabilities, including titanium production, superalloy castings, aerospace fasteners and titanium fabricated structures.
🔥 Weekly R4 Momentum Breakout: ₹476 is the key technical level on my scanner. Sustained strength above this zone could open the path towards ₹709 and potentially ₹1,157.
Why It Caught My Attention
✅ Strategic defence-materials business
✅ Aerospace & space exposure
✅ Q1 revenue +40% YoY
✅ Q1 PAT +27% YoY
✅ ₹2,329 Cr order-book visibility
✅ Titanium & superalloy capabilities
🔥 Weekly R4 Momentum Breakout
⚠️ IMPORTANT
This is not a low-risk defence compounder.
The Q1 headline growth was strong, but earnings remain lumpy. Revenue fell sharply QoQ from ₹552.75 Cr to ₹239.49 Cr, while operating profit declined 68% QoQ. EBITDA margin also came under pressure.
Management expects margins to recover as LPG and raw-material volatility normalise, but this remains an important factor to monitor.
The ₹1,157 target is a high-end technical/momentum scenario, not a guaranteed fundamental valuation.
Risk Defined. Reward Visible.
📢 Disclaimer: This content is for educational purposes only and not investment advice. Please do your own due diligence before making any investment decisions.
© 20K Microcap Investing | R4 Momentum Desk
#MIDHANI #MishraDhatuNigam #DefenceStocks #DefenceIndia #AerospaceStocks #SpaceStocks #Titanium #SpecialAlloys #SmallCapStocks #MomentumStocks #BreakoutStocks #StockMarketIndia #IndianStocks #StocksToWatch #R4Breakout #MomentumInvesting #20KMicrocap  Long
Long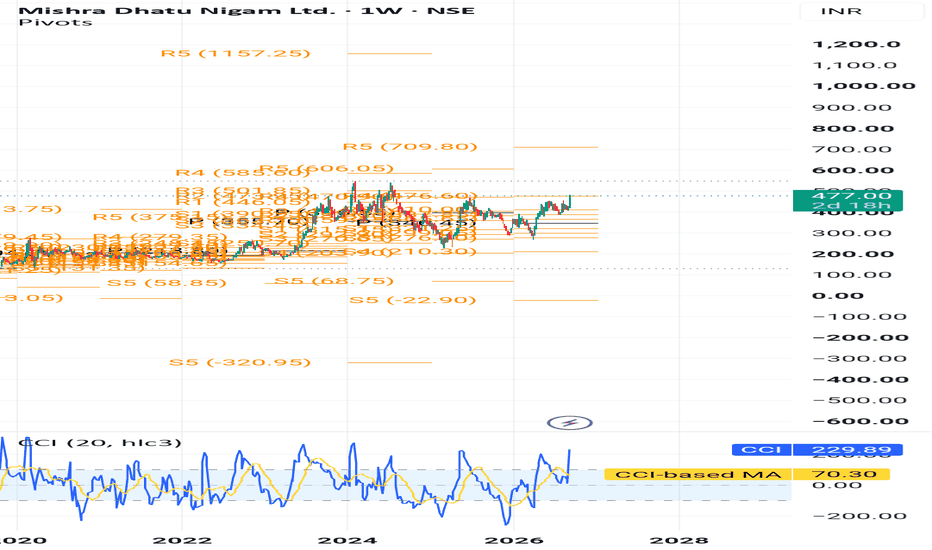
 Long
Long
 Long
Long
 Long
Long
 Long
Long
 Long
Long
 Long
Long
 Long
Long
 Long
Long
 Long
Long
 Long
Long
 Long
Long
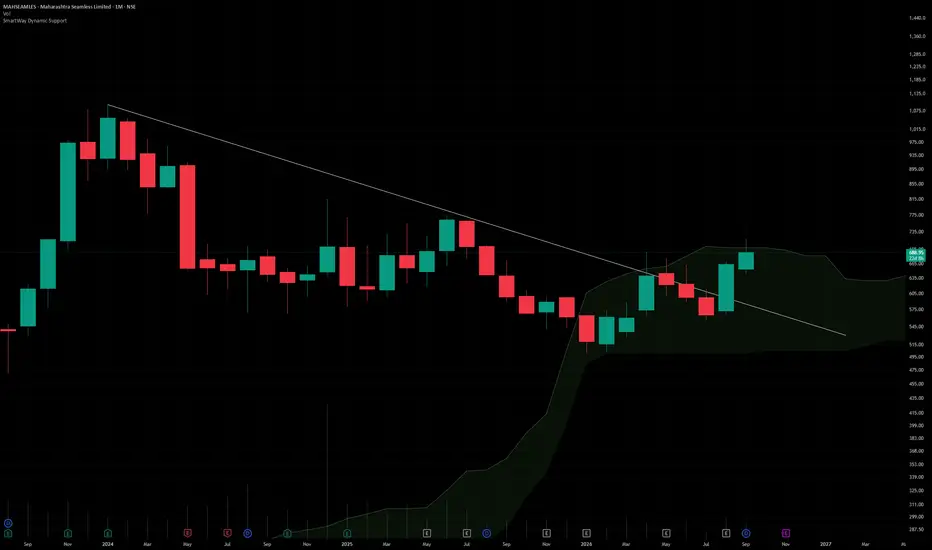
MAHARASHTRA SEAMLESS## Maharashtra Seamless Ltd. (CMP ₹689.00, NSE: MAHSCO)
**The SmartWay Research Desk | 8 September 2026**
A Mumbai‑based steel pipe## Maharashtra Seamless Ltd. (CMP ₹689.00, NSE: MAHSCOOTER)
**The SmartWay Research Desk | 8 September 2026**
A Mumbai‑based steel pipe manufacturer, incorporated in 1988. Maharashtra Seamless Ltd. is India’s largest producer of **seamless pipes, ERW pipes, and coated pipes**, catering to industries such as oil & gas, power, automotive, and infrastructure. The company is part of the DP Jindal Group and has manufacturing facilities in Maharashtra and Haryana.
**Promoter Holding (Jun 2026):** **DP Jindal Group (Jindal Family) — ~63.2% stake (no pledges)**
---
### FY22–FY26 Snapshot
- **Revenue Growth:** FY26 revenue ₹5,842 Cr vs ₹5,112 Cr in FY25 (+14.3% YoY). → **Good**
- **Net Profit:** FY26 PAT ₹812 Cr vs ₹702 Cr in FY25 (+15.7% YoY). → **Good**
- **Operating Margin:** FY26 EBITDA ₹1,412 Cr, margin 24.2% vs 23.5% last year (+70 bps). → **Good**
- **Equity Capital:** Stable, face value ₹5. → **Good**
- **Dividend Policy:** Dividend ₹6.00/share declared for FY26. → **Good**
- **Asset Building:** Investments in **capacity expansion, coated pipes, and offshore projects**. → **Good**
- **Sales:** Strong demand from **oil & gas and infra sectors**. → **Good**
- **Expense:** Raw material cost pressures (steel, alloys) remain. → **Neutral/Good**
- **EPS:** FY26 EPS ₹26.25 vs ₹22.40 last year (+17.2%). → **Good**
---
### Institutional Interest & Ownership Trends (Jun 2026)
- **Promoter Holding:** ~63.2% (no pledges)
- **FII Holding:** ~12.8%
- **DII Holding:** ~14.6%
- **Retail & Others:** ~9.4%
---
### Strategic Moves & Innovations
- Expansion in **seamless and ERW pipe capacity**.
- Focus on **oil & gas exploration and offshore projects**.
- Partnerships with **global energy companies for supply contracts**.
- Diversification into **coated pipes and specialized industrial products**.
---
### Cash Flow & Balance Sheet Strength
- Market cap ~₹11,200 Cr.
- Debt‑to‑equity ratio ~0.42 (moderate leverage).
- Book value per share ₹182.00; P/B ~3.8.
- EPS (TTM) ₹26.25; P/E ~26.2.
---
### Risk Factors
- Moderate‑high **P/E ratio ~26.2**, valuations slightly expensive.
- Dependence on **oil & gas demand cycles**.
- Exposure to **commodity price volatility (steel, alloys)**.
- Competition from Ratnamani Metals, Welspun Corp, and Jindal SAW.
---
### Investor Takeaway
Maharashtra Seamless has delivered **robust FY26 performance**, supported by demand in oil & gas, infra projects, and coated pipe expansion. With strong promoter backing (Jindal Family, 63.2% stake), dividend payouts, and leadership in seamless pipes, the company remains a **mid‑cap steel & infra play**. At CMP ₹689.00, valuations are **moderately expensive (P/E ~26.2, P/B ~3.8)**, reflecting growth expectations with manageable risks.  Long
Long
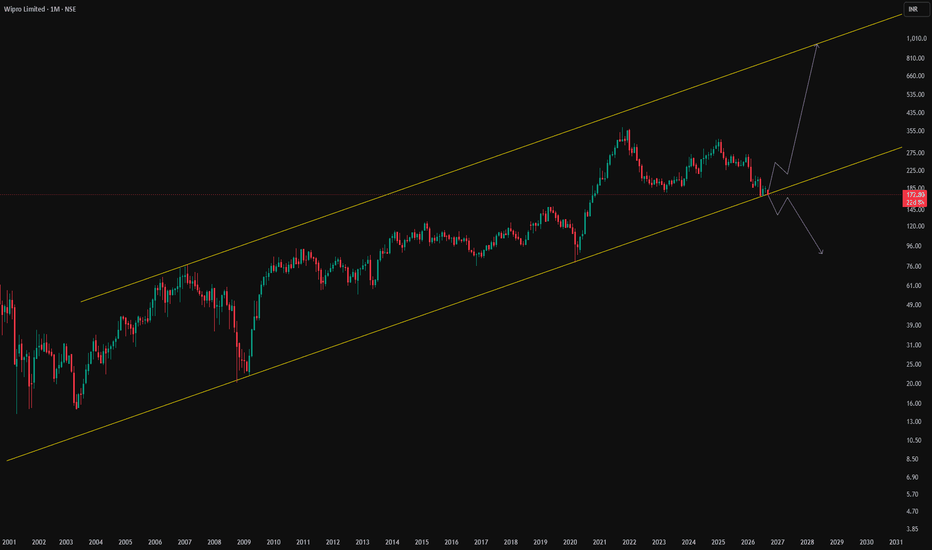
WIPRO – Long-Term Channel Support Bounce?Wipro Limited is currently approaching an important zone within a long-term rising price channel on the monthly timeframe. The broader chart structure continues to show a long-term upward trajectory, with the lower boundary of the channel acting as a significant historical support area.
The recent corrective movement has brought the price closer to this rising support zone. If the channel structure continues to remain valid and buyers defend this region, the stock could witness a potential upside movement in the coming months.
The projected path on the chart represents only a possible technical scenario. Price may experience volatility, consolidation, or further corrections before any meaningful directional move develops.
Technical View
Long-term rising channel remains the primary structure.
Price is approaching the lower boundary/support region of the channel.
Historical channel support could become an important area to watch.
A successful hold and reversal from this zone may open the possibility of an upside move.
This is strictly a long-term chart-pattern observation, not a short-term trading call.
About the Company
Wipro Limited is a global AI-powered technology services and consulting company. Its business spans technology consulting, cloud and infrastructure services, cybersecurity, engineering, data and analytics, application development, business process services, and AI-led digital transformation solutions. The company also operates an IT Products segment offering third-party computing, storage, networking, security and software products.
Disclaimer
This analysis is based solely on long-term technical chart patterns and price structure. It does not consider fundamentals, financial results, valuations, news, corporate developments, or macroeconomic factors. The projected movement is only a possible scenario and is not guaranteed. Markets involve risk, and price can move in either direction. This is not investment advice or a recommendation to buy or sell any security. Please conduct your own research before making investment decisions.  Long
Long