SBINSBIN — Revised Trade Assessment | Qty 5,000
The trade setup remains strong, but with 5,000 shares the capital deployment and downside become materially larger. The MTF structure is still bullish across all timeframes.
1. Setup Strength — 🟢 8.7/10
HTF: Yearly / Half-Yearly / Quarterly → UP
MTF: Monthly / Weekly / Daily → UP
ITF: 240M / 180M / 60M → UP
HTF Average: 794
MTF Average: 1,011
ITF Average: 1,035
Average Entry: 1,037
The strongest signal is that all 9 timeframes are bullish.
2. Entry Zone
Entry 1: 1,039
Entry 2: 1,034
Average: 1,037
The entry is almost exactly around the ITF demand average of 1,035, which makes the entry technically attractive.
Gann Position
Held above the Gann Low 950
Crossed the Gann Upward Move 970
Established itself well above the Gann trigger
MTF + ITF trends are simultaneously UP
So the Gann signal is bullish and confirmed by the MTF structure.
Trade View
🟢 GANN: BULLISH
🟢 MTF: BULLISH
🟢 ITF: BULLISH
🟢 Demand: SUPPORTIVE
🟢 RR: ~5:1
Daily demand is 1,023–1,034, while ITF demand is 1,030–1,039.
So 1,034–1,039 is the key execution zone.
Don't chase significantly above this zone.
3. Risk / Reward
Entry: 1,037
SL: 1,000
Risk: 37 points
Target: 1,225
Reward: 188 points
Gross RR: 5.08:1
The raw RR is excellent.
There is also a major intermediate resistance at 1,121, so I would manage the position around this level rather than simply waiting blindly for 1,225.
4. 5,000-Share Position
At an average entry of ₹1,037:
Gross position value = ₹5.185 Mn
For 5,000 shares:
Buy value = ₹5,185,000
Gross profit at 1,225 = ₹940,000
Gross loss at 1,000 = ₹185,000
So the trade has approximately:
Upside = +18.1%
Downside = -3.57%
5. MTF Capital
At 25% capital requirement:
Required capital ≈ ₹1.296 Mn
The leverage is therefore significant.
Your capital structure is roughly:
Position value: ₹5.185 Mn
Own/MTF capital: ₹1.296 Mn
Financed amount: ₹3.889 Mn
This makes financing cost an important part of the actual return calculation.
6. Net Profit Calculation Needs Attention
Your table shows:
Gross profit = ₹940,000
Brokerage/tax = ₹25,404
Net profit = ₹914,596
Interest = ₹123,826
Final net profit = ₹790,770
7. Key Price Map
1,000 → SL / major support
1,034–1,039 → 🔵 Ideal entry / ITF demand
1,067 → Weekly proximal resistance
1,121 → Last High / major checkpoint
1,225 → 🎯 Primary target
1,234 → Trend High
1,535 → Long-term positional target
Final Verdict
🟢 SBIN BUY — 8.7/10
The 5,000-share quantity is acceptable from a technical RR perspective, because the setup offers approximately 5:1 gross RR.
But I would structure it as:
Buy 1: 2,500 @ ~1,039
Buy 2: 2,500 @ ~1,034
Average: ~1,037
SL: 1,000
Checkpoint: 1,121
Primary Target: 1,225
Most important: don't increase quantity merely because the RR looks attractive. With 5,000 shares, every ₹10 move = ₹50,000 P/L. The position should therefore be sized based on your maximum acceptable loss, not only on the 25% MTF capital requirement.  Long
Long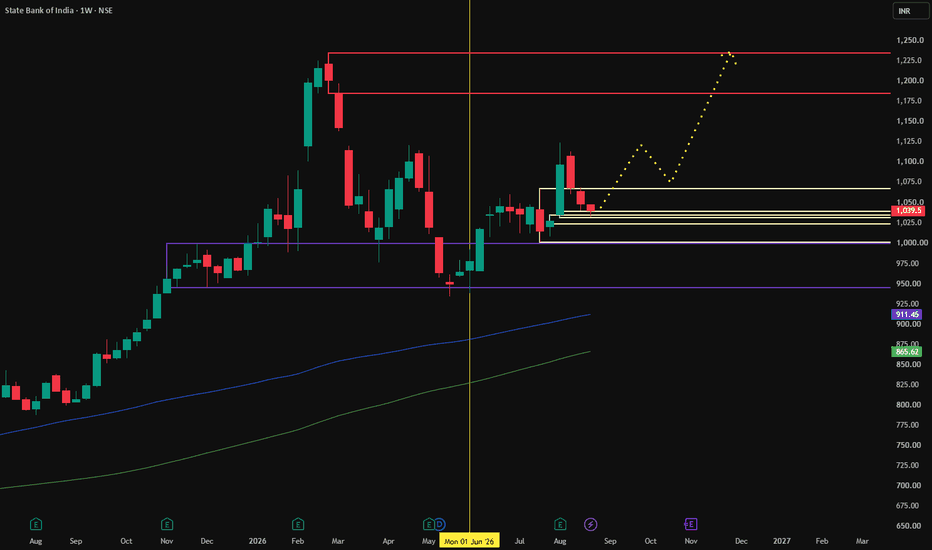
 Long
Long
 Long
Long
 Long
Long
Redington💻 STOCK TO WATCH 💻
₹360 → ₹515 👀
A technology-distribution and digital-infrastructure play appearing on my Weekly R4 Breakout Scanner.
Redington Ltd.
📌 Buy Zone: ₹360
📌 Breakout Zone: ₹359
🛑 Stop Loss: ₹301
🎯 Target: ₹515
Why Redington?
🌐 Technology supply-chain leader: Redington operates across IT distribution, mobility, cloud, cybersecurity and technology solutions, giving it exposure to multiple digital-growth segments.
🚀 Strong Q1 FY27 growth: Consolidated revenue reached ₹34,922 Cr, up 34.6% YoY, while PAT rose 76.6% YoY to ₹486 Cr.
🇮🇳 India growth engine: India revenue increased 63% YoY, supported by enterprise infrastructure, premium mobility, cloud and software demand.
☁️ Cloud + AI infrastructure opportunity: The company executed around ₹1,000 Cr of large data-centre deals during Q1, while Cloud & Software grew strongly.
📈 Profit acceleration: Q1 FY27 PBT more than doubled YoY, rising 100.7%, while operating profit increased sharply.
📊 Weekly Camarilla R4 Breakout Setup
Why It Caught My Attention
✅ 34%+ Q1 revenue growth
✅ 76%+ PAT growth
✅ 63% India revenue growth
✅ Strong cloud & software momentum
✅ AI/data-centre infrastructure exposure
✅ Broad-based business growth
✅ Weekly R4 Momentum Breakout
⚠️ High Risk – High Reward Setup. Always follow strict stop-loss and disciplined position sizing.
📢 Disclaimer: This content is for educational purposes only and not investment advice. Please do your own due diligence before making any investment decisions.
Risk Defined. Reward Visible.
© 20K Microcap Investing | R4 Momentum Desk
#Redington #RedingtonIndia #ITStocks #TechnologyStocks #AIStocks #DataCentre #CloudComputing #DigitalInfrastructure #StockMarketIndia #IndianStocks #StocksToWatch #R4Breakout #MomentumInvesting #20KMicrocap  Long
Long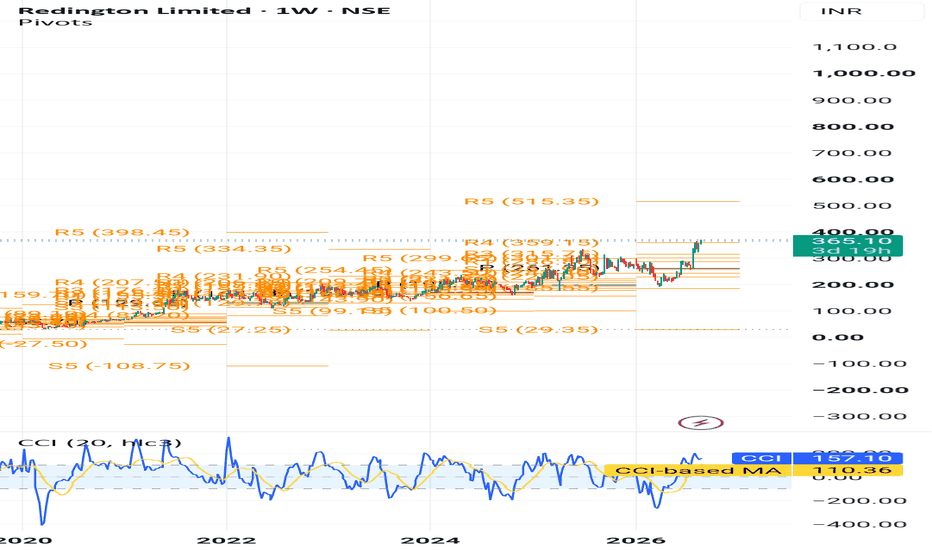
Fine Organic🧪 STOCK TO WATCH 🧪
₹5,265–₹5,275 → ₹7,870 → ₹12,170 👀
A specialty-chemicals leader appearing on my Weekly R4 Breakout Scanner.
Fine Organic Industries Ltd.
📌 Buy Zone: ₹5,265–₹5,275
📌 Breakout Zone: ₹5,264
🛑 Stop Loss: ₹4,339
🎯 Target 1: ₹7,870
🎯 Target 2: ₹12,170
Why Fine Organic?
🧪 Specialty additives leader: Fine Organic is a major producer of oleochemical-based specialty additives used across food, plastics, rubbers, paints, inks, cosmetics, coatings and lubricants.
📈 Strong Q1 FY27 growth: Consolidated revenue from operations reached ₹694.2 Cr, up around 18% YoY.
🚀 Operating leverage: Q1 FY27 EBITDA rose 42.4% YoY to ₹176 Cr, with EBITDA margin improving to 25.3% from 21.0%.
💰 Profit growth: Consolidated PAT increased approximately 18% YoY to ₹138.1 Cr.
🌍 Strong export franchise: Exports contributed approximately 60% of Q1 FY27 revenue, giving the company significant exposure to global demand.
📊 Weekly Camarilla R4 Breakout Setup
Why It Caught My Attention
✅ Strong Q1 FY27 revenue growth
✅ 42%+ EBITDA growth
✅ Expanding operating margins
✅ ~60% revenue from exports
✅ Niche specialty-chemicals portfolio
✅ Multiple end-market exposures
✅ Weekly R4 Momentum Breakout
⚠️ High Risk – High Reward Setup. Always follow strict stop-loss and disciplined position sizing.
📢 Disclaimer: This content is for educational purposes only and not investment advice. Please do your own due diligence before making any investment decisions.
Risk Defined. Reward Visible.
© 20K Microcap Investing | R4 Momentum Desk
#FineOrganic #FineOrganicIndustries #SpecialtyChemicals #ChemicalStocks #SpecialtyChemicalsIndia #ExportStocks #Manufacturing #StockMarketIndia #IndianStocks #StocksToWatch #R4Breakout #MomentumInvesting #20KMicrocap  Long
Long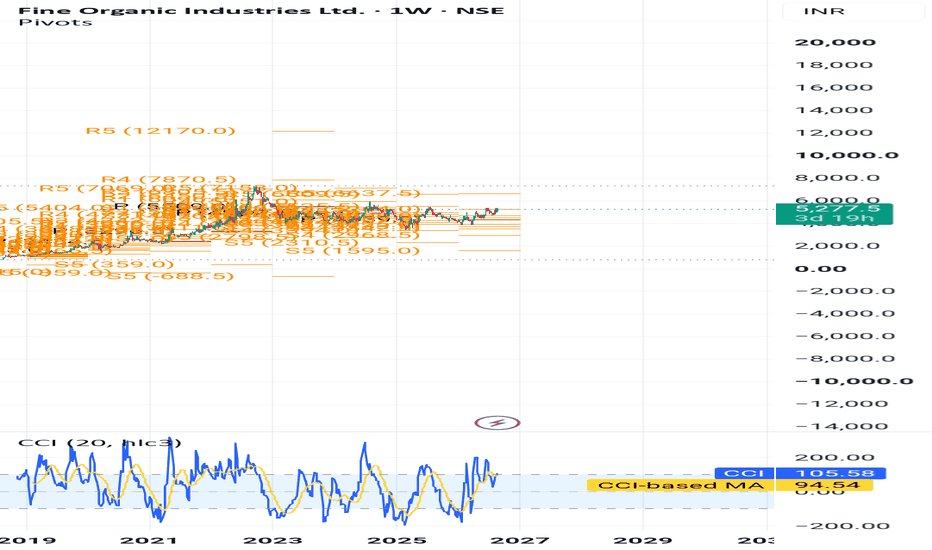
 Long
Long
 Long
Long
 Long
Long
 Long
Long
 Long
Long
 Long
Long
 Long
Long
 Long
Long
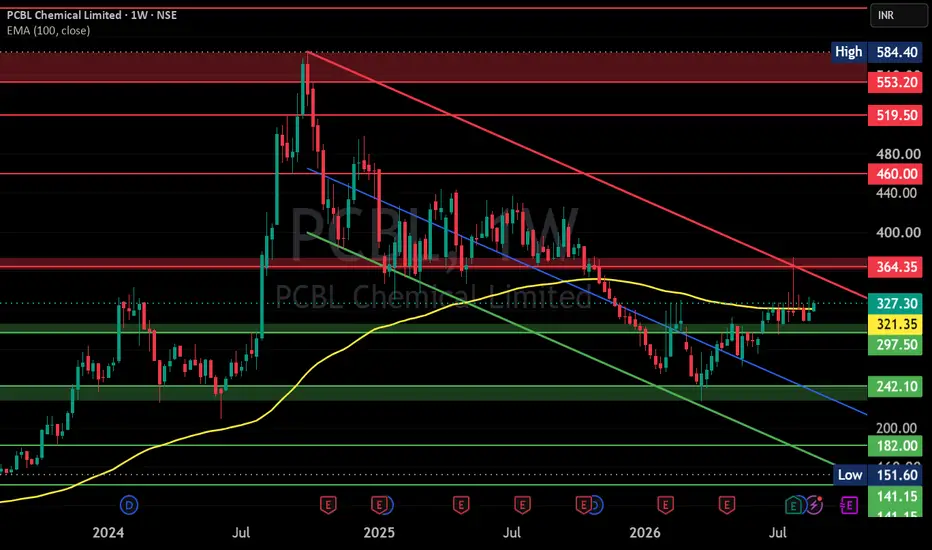
PCBL CHEMICALS S/R
Support and Resistance Levels:
Support Levels: These are price points (green line/shade) where a downward trend may be halted due to a concentration of buying interest. Imagine them as a safety net where buyers step in, preventing further decline.
Resistance Levels: Conversely, resistance levels (red line/shade) are where upward trends might stall due to increased selling interest. They act like a ceiling where sellers come in to push prices down.
Breakouts:
Bullish Breakout: When the price moves above resistance, it often indicates strong buying interest and the potential for a continued uptrend. Traders may view this as a signal to buy or hold.
Bearish Breakout: When the price falls below support, it can signal strong selling interest and the potential for a continued downtrend. Traders might see this as a cue to sell or avoid buying.
MA Ribbon (EMA 20, EMA 50, EMA 100, EMA 200) :
Above EMA: If the stock price is above the EMA, it suggests a potential uptrend or bullish momentum.
Below EMA: If the stock price is below the EMA, it indicates a potential downtrend or bearish momentum.
Trendline: A trendline is a straight line drawn on a chart to represent the general direction of a data point set.
Uptrend Line: Drawn by connecting the lows in an upward trend. Indicates that the price is moving higher over time. Acts as a support level, where prices tend to bounce upward.
Downtrend Line: Drawn by connecting the highs in a downward trend. Indicates that the price is moving lower over time. It acts as a resistance level, where prices tend to drop.
Disclaimer:
I am not SEBI registered. The information provided here is for learning purposes only and should not be interpreted as financial advice. Consider the broader market context and consult with a qualified financial advisor before making investment decisions.  Long
Long
LATENTVIEW S/R
Support and Resistance Levels:
Support Levels: These are price points (green line/shade) where a downward trend may be halted due to a concentration of buying interest. Imagine them as a safety net where buyers step in, preventing further decline.
Resistance Levels: Conversely, resistance levels (red line/shade) are where upward trends might stall due to increased selling interest. They act like a ceiling where sellers come in to push prices down.
Breakouts:
Bullish Breakout: When the price moves above resistance, it often indicates strong buying interest and the potential for a continued uptrend. Traders may view this as a signal to buy or hold.
Bearish Breakout: When the price falls below support, it can signal strong selling interest and the potential for a continued downtrend. Traders might see this as a cue to sell or avoid buying.
MA Ribbon (EMA 20, EMA 50, EMA 100, EMA 200) :
Above EMA: If the stock price is above the EMA, it suggests a potential uptrend or bullish momentum.
Below EMA: If the stock price is below the EMA, it indicates a potential downtrend or bearish momentum.
Trendline: A trendline is a straight line drawn on a chart to represent the general direction of a data point set.
Uptrend Line: Drawn by connecting the lows in an upward trend. Indicates that the price is moving higher over time. Acts as a support level, where prices tend to bounce upward.
Downtrend Line: Drawn by connecting the highs in a downward trend. Indicates that the price is moving lower over time. It acts as a resistance level, where prices tend to drop.
Disclaimer:
I am not SEBI registered. The information provided here is for learning purposes only and should not be interpreted as financial advice. Consider the broader market context and consult with a qualified financial advisor before making investment decisions. VMM S/R
Support and Resistance Levels:
Support Levels: These are price points (green line/shade) where a downward trend may be halted due to a concentration of buying interest. Imagine them as a safety net where buyers step in, preventing further decline.
Resistance Levels: Conversely, resistance levels (red line/shade) are where upward trends might stall due to increased selling interest. They act like a ceiling where sellers come in to push prices down.
Breakouts:
Bullish Breakout: When the price moves above resistance, it often indicates strong buying interest and the potential for a continued uptrend. Traders may view this as a signal to buy or hold.
Bearish Breakout: When the price falls below support, it can signal strong selling interest and the potential for a continued downtrend. Traders might see this as a cue to sell or avoid buying.
MA Ribbon (EMA 20, EMA 50, EMA 100, EMA 200) :
Above EMA: If the stock price is above the EMA, it suggests a potential uptrend or bullish momentum.
Below EMA: If the stock price is below the EMA, it indicates a potential downtrend or bearish momentum.
Trendline: A trendline is a straight line drawn on a chart to represent the general direction of a data point set.
Uptrend Line: Drawn by connecting the lows in an upward trend. Indicates that the price is moving higher over time. Acts as a support level, where prices tend to bounce upward.
Downtrend Line: Drawn by connecting the highs in a downward trend. Indicates that the price is moving lower over time. It acts as a resistance level, where prices tend to drop.
Disclaimer:
I am not SEBI registered. The information provided here is for learning purposes only and should not be interpreted as financial advice. Consider the broader market context and consult with a qualified financial advisor before making investment decisions. KIMS S/R
Support and Resistance Levels:
Support Levels: These are price points (green line/shade) where a downward trend may be halted due to a concentration of buying interest. Imagine them as a safety net where buyers step in, preventing further decline.
Resistance Levels: Conversely, resistance levels (red line/shade) are where upward trends might stall due to increased selling interest. They act like a ceiling where sellers come in to push prices down.
Breakouts:
Bullish Breakout: When the price moves above resistance, it often indicates strong buying interest and the potential for a continued uptrend. Traders may view this as a signal to buy or hold.
Bearish Breakout: When the price falls below support, it can signal strong selling interest and the potential for a continued downtrend. Traders might see this as a cue to sell or avoid buying.
MA Ribbon (EMA 20, EMA 50, EMA 100, EMA 200) :
Above EMA: If the stock price is above the EMA, it suggests a potential uptrend or bullish momentum.
Below EMA: If the stock price is below the EMA, it indicates a potential downtrend or bearish momentum.
Trendline: A trendline is a straight line drawn on a chart to represent the general direction of a data point set.
Uptrend Line: Drawn by connecting the lows in an upward trend. Indicates that the price is moving higher over time. Acts as a support level, where prices tend to bounce upward.
Downtrend Line: Drawn by connecting the highs in a downward trend. Indicates that the price is moving lower over time. It acts as a resistance level, where prices tend to drop.
Disclaimer:
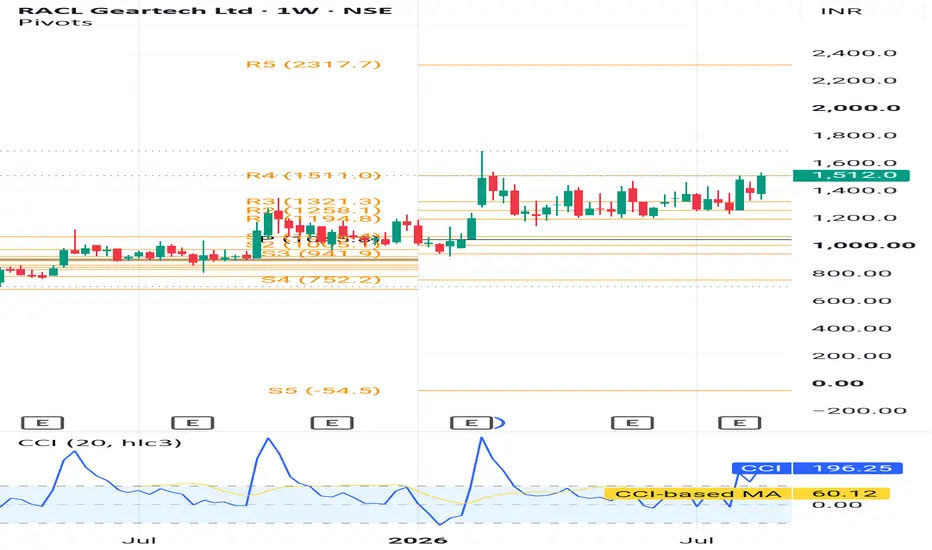
I am not SEBI registered. The information provided here is for learning purposes only and should not be interpreted as financial advice. Consider the broader market context and consult with a qualified financial advisor before making investment decisions. RACL Geartech⚙️ STOCK TO WATCH ⚙️
₹1,511 → ₹2,317 👀
A precision automotive-components player appearing on my Weekly R4 Breakout Scanner.
RACL Geartech Ltd.
📌 Buy Zone: ₹1,511
📌 Breakout Zone: ₹1,511
🛑 Stop Loss: ₹1,144
🎯 Target: ₹2,317
Why RACL Geartech?
⚙️ Precision auto-component player: RACL manufactures gears and transmission components for two-wheelers, three-wheelers and four-wheelers.
🌍 Strong export exposure: In Q1 FY27, international revenue was about ₹86.95 Cr, with Germany and Austria among the largest overseas markets.
📈 Strong Q1 growth: Consolidated revenue rose 31.5% YoY to ₹132.35 Cr, while operating profit jumped 69.7% YoY.
💰 Profitability improvement: Q1 FY27 PBT increased 49.3% YoY, while PAT grew 7.8% YoY.
🚗 Global automotive opportunity: Its international customer base provides exposure to global auto-component demand and precision-engineering applications.
📊 Weekly Camarilla R4 Breakout Setup
Why It Caught My Attention
✅ Strong Q1 revenue growth
✅ 69%+ YoY operating-profit growth
✅ Significant export exposure
✅ Precision engineering & auto-component theme
✅ Global customer base
✅ Weekly R4 Momentum Breakout
⚠️ High Risk – High Reward Setup. Always follow strict stop-loss and disciplined position sizing.
📢 Disclaimer: This content is for educational purposes only and not investment advice. Please do your own due diligence before making any investment decisions.
Risk Defined. Reward Visible.
© 20K Microcap Investing | R4 Momentum Desk
#RACLGeartech #RACLGEAR #AutoComponents #AutoAncillary #EngineeringStocks #AutomotiveStocks #ExportStocks #StockMarketIndia #IndianStocks #StocksToWatch #R4Breakout #MomentumInvesting #20KMicrocap  Long
Long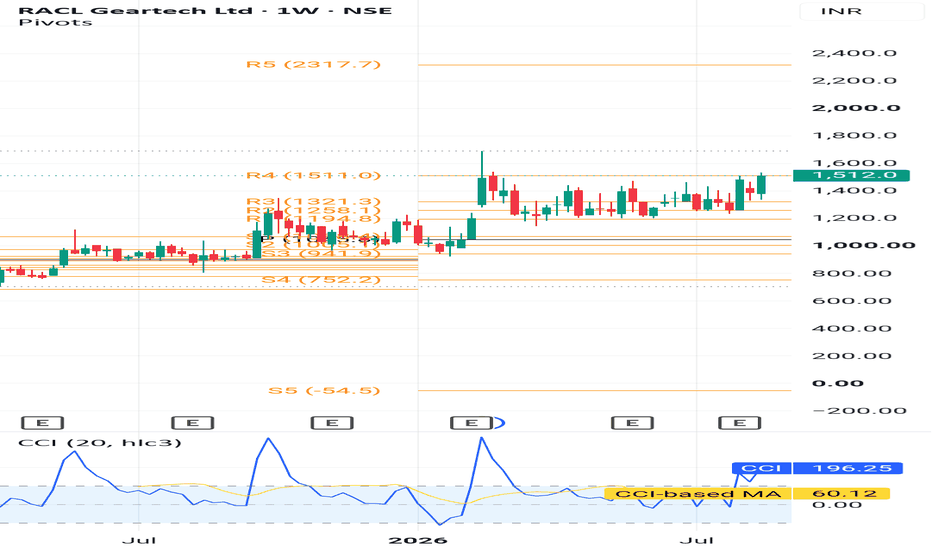
Voltamp Transformer⚡ STOCK TO WATCH ⚡
₹10,500–₹10,800 → ₹14,804 → ₹18,299 → ₹23,761 👀
A leading power-transformer manufacturer appearing on my Weekly R4 Breakout Scanner.
Voltamp Transformers Ltd.
📌 Buy Zone: ₹10,500–₹10,800
📌 Breakout Zone: ₹10,335
🛑 Stop Loss: ₹8,156
🎯 Target 1: ₹14,804
🎯 Target 2: ₹18,299
🎯 Target 3: ₹23,761
Why Voltamp Transformers?
⚡ Power infrastructure play: Voltamp manufactures power and distribution transformers and is positioned to benefit from India's expanding electricity and transmission infrastructure.
🏭 Capacity expansion: Its new power-transformer manufacturing facility was scheduled to become operational from July 2026, supporting additional capacity.
📈 Strong demand environment: The company has highlighted sustained investment in power infrastructure and healthy demand for transformers from utilities.
💰 Healthy order visibility: The company has previously reported strong order intake and revenue visibility, reflecting robust demand for its products.
🚀 Fresh capex: In July 2026, the board approved ₹90 crore capex for a 2,300 MVA facility, adding another potential growth catalyst.
📊 Weekly Camarilla R4 Breakout Setup
Why It Caught My Attention
✅ Power infrastructure & transformer theme
✅ Strong industry demand
✅ Capacity expansion underway
✅ Fresh ₹90 Cr capex catalyst
✅ Healthy order visibility
✅ Potential beneficiary of India's power-capex cycle
✅ Weekly R4 Momentum Breakout
⚠️ High Risk – High Reward Setup. Always follow strict stop-loss and disciplined position sizing.
📢 Disclaimer: This content is for educational purposes only and not investment advice. Please do your own due diligence before making any investment decisions.
Risk Defined. Reward Visible.
© 20K Microcap Investing | R4 Momentum Desk
#VoltampTransformers #Voltamp #TransformerStocks #PowerStocks #PowerInfrastructure #CapitalGoods #InfrastructureStocks #StockMarketIndia #IndianStocks #StocksToWatch #R4Breakout #MomentumInvesting #20KMicrocap  Long
Long