Long
Long
 Long
Long
 Long
Long
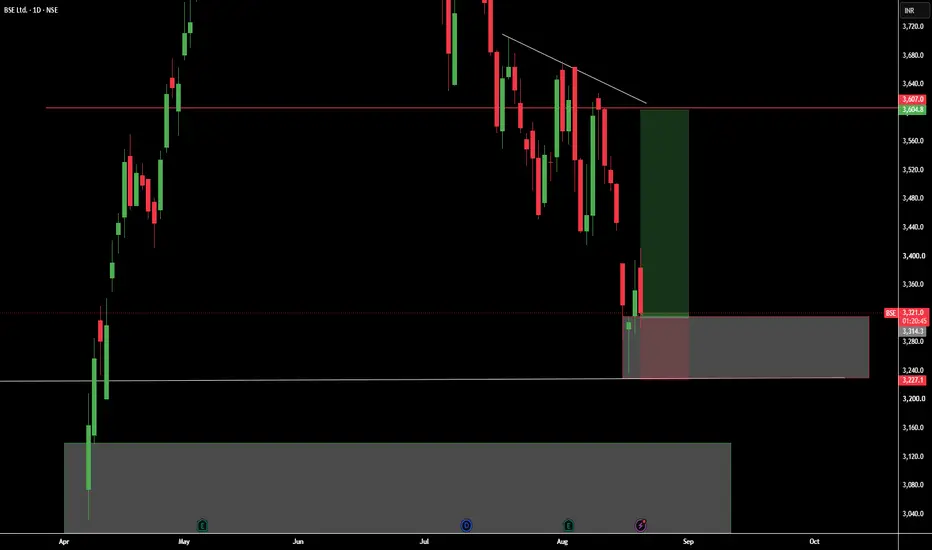
BSEBSE Trade Verdict: 🟢 Bullish, but entry is the key
Overall score: 7.5/10
The strongest signal is that Yearly → Half-Yearly → Quarterly → Monthly → Weekly → Daily → Intraday are all UP. That gives the trade strong multi-timeframe alignment.
Structure
HTF Average: 2,618
MTF Average: 2,801
ITF Average: 2,632
Trade Points Average: 2,684
Entry-1: 3,227
Entry-2: 3,032
Average Entry: 3,130
SL: 2,537
Target: 5,090
Position economics
For 1,000 shares:
Capital: ₹31.295 lakh
Gross profit at ₹5,090: ₹19.60 lakh
Transaction cost: ₹15,340
Net profit: ₹19.45 lakh
Gross loss at SL: ₹5.925 lakh
Net loss: ₹6.078 lakh
This gives a very attractive payoff provided the stop is respected.
Entry quality
₹3,227 Entry-1
🟡 Reasonable technically, but you are buying near the upper part of the demand structure.
₹3,032 Entry-2
🟢 Better — this aligns directly with the monthly proximal level and yearly/half-yearly proximal level.
₹2,800–₹2,850
🟢🟢 This is the most interesting zone from your own model because it is close to:
MTF Average: ₹2,801
ITF Proximal: ₹2,834
Quarterly Average: ₹2,802
₹2,800–₹2,850 is the strongest confluence zone.
Target map
I would manage the trade through these levels:
₹3,571 — Gann Confirmation
⬇️
₹4,218 — Recent High
⬇️
₹4,446 — Trend High
⬇️
₹5,090 — Main Target
⬇️
₹5,669 — Position Target
The ₹4,218–₹4,446 zone is particularly important. Once BSE reaches this zone, the trade has already generated substantial profit, so I would reassess momentum before holding everything for ₹5,090/₹5,669.
Final view
Parameter Verdict
Multi-TF Trend 🟢 Excellent
Demand Alignment 🟢 Strong
Entry ₹3,227 🟡 Moderate
Entry ₹3,032 🟢 Good
₹2,800–2,850 Zone 🟢🟢 Strongest
SL ₹2,537 🟢 Logical
Target ₹5,090 🟢 Attractive
Position Target ₹5,669 🟡 Higher-risk extension
RR 3.3 🟢 Correct
Net RR 3.2 🟢 Good
Overall 🟢 7.5/10
Bottom line: The trade structure is good; the entry is the only concern. I would prefer not to chase ₹3,227 with the full quantity. The setup becomes much more attractive if the average entry can be brought toward ₹2,850–₹3,000, while ₹2,537 remains the hard structural invalidation.  Long
Long
 Long
Long
 Long
Long
 Long
Long
 Long
Long
 Long
Long
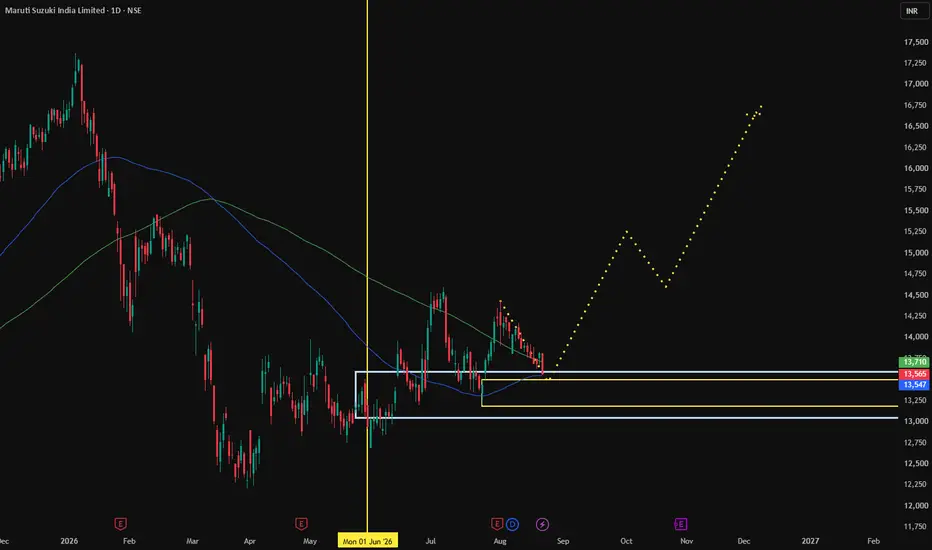
MARUTIMaruti — MTF Trade Assessment
Overall setup: BULLISH, but entry needs discipline.
Trend: UP across HTF, MTF and ITF — strong alignment.
HTF support zone: 10,921–13,534 average range.
MTF support: 12,805–13,514.
ITF support: 13,197–13,495.
Key trade zone: 13,197–13,495.
Entry-1: 13,961 — breakout/strength entry.
Entry-2: 13,495 — preferred pullback entry.
Planned average: 13,495.
SL: 13,197 → risk 298 points/share.
Target: 16,297 → reward 2,802 points/share.
RR: 4.7:1 before financing/costs.
Risk–Reward View
Your calculation indicates:
Quantity: 400 shares
Buy value: ₹53.98 lakh
Capital at 35%: ₹18.89 lakh
Gross profit at target: ₹11.21 lakh
Net profit after transaction costs: ~₹10.94 lakh
Net loss at SL: ~₹1.46 lakh
Net RR: 7.51:1 based on your stated capital allocation.
Critical Observation
The 13,197 level is the most important defensive level because it is simultaneously:
Daily/ITF proximal support
Daily distal support
Your SL
Last-low reference
So the trade remains structurally strong above 13,197.
However, 13,961 is close to the recent high of 14,598, so buying the full quantity at 13,961 creates a less attractive entry than accumulating around 13,495.
Trade Quality
Trend: 🟢 Strong bullish
MTF alignment: 🟢 Excellent
Support confirmation: 🟢 Strong
Entry quality: 🟢 Better at 13,495
SL clarity: 🟢 Clear
RR: 🟢 Very attractive
Overextension risk: 🟡 Moderate above 13,961
Overall: 8.5/10
Best structure: 13,495 entry → 13,197 SL → 16,297 target.  Long
Long
AGI Greenpac Ltd. — Positional SetupBased on the daily chart you shared, AGI Greenpac is showing a constructive recovery structure. The stock has moved from the ₹500 area into a higher-high/higher-low sequence and is now trading around ₹753.60, after a strong +5.89% session.
The important point is that the stock is approaching the ₹760–765 breakout zone. I would not treat the current candle alone as confirmation; the quality of the breakout and volume will matter.
1. Technical structure
Current price: ₹753.60
From your chart:
Immediate resistance: ₹760–765
Breakout confirmation: Daily close above ₹765 with strong volume
First upside zone: ₹800–820
Second target: ₹850–875
Major resistance: ₹900–920
Longer-term resistance: ₹950–1,000
Near support: ₹720–725
Important support: ₹690–700
Major positional invalidation zone: ₹650–670
The moving averages on the chart are also improving. Price is trading above the short/medium-term averages, and the averages have started turning upward.
2. Positional trade setup
Parameter Setup
Current price ₹753.60
Aggressive entry ₹755–765
Safer entry Above ₹765 on daily closing basis
Breakout confirmation ₹765+ with volume
Stop loss ₹700
Conservative SL ₹680
Target 1 ₹800–820
Target 2 ₹850–875
Target 3 ₹900–920
Extended target ₹950–1,000
Holding period 4–12 weeks*
*Holding period depends on price action; it is not a fixed expiry.
3. My preferred strategy
I would not chase a large position at ₹753–760 simply because today's candle is strong.
The cleaner setup is:
Scenario A — Breakout
If AGI closes above ₹765 with substantially higher volume:
Entry: ₹765–775
SL: ₹700
T1: ₹820
T2: ₹875
T3: ₹920+
A breakout followed by a successful retest of ₹760–765 would be even better.
Scenario B — Pullback
If the stock fails to cross ₹765 and comes back toward ₹715–725, watch for bullish price action.
That provides a better risk/reward opportunity, provided ₹700 holds.
4. Risk/reward
Using ₹765 as the breakout entry and ₹700 as the stop:
Risk ≈ ₹65/share
Target ₹820 → reward ≈ ₹55
Target ₹875 → reward ≈ ₹110
Target ₹920 → reward ≈ ₹155
Therefore, ₹820 alone doesn't provide an exceptional risk/reward after a breakout. The trade becomes more attractive if:
You get a pullback entry around ₹715–725, or
The breakout is very strong and ₹765 becomes support, allowing the stop to be tightened.
This is important—don't take a positional trade just because a chart "looks bullish." The entry price has to make sense.  Long
Long
 Long
Long
 Long
Long
 Long
Long
 Short
Short
 Long
Long
 Long
Long
 Long
Long
 Long
Long
Long 
DATAPATTNS is showing a bullish move at an ascending channelNSE:DATAPATTNS has been in a sustained bullish trend for several months and has recently found support at the lower boundary of its ascending channel on the daily timeframe , reinforcing the likelihood of continued upward momentum.
Additionally, the sectoral index , NSE:NIFTY_IND_DEFENCE , has retested its all-time-high with a morning star pattern , providing further confirmation of relative strength among the sectors and supporting the top-down approach.
The Daily RSI(14) at 47.51 is also indicating a bullish reversal signaling a potential formation of a higher low with a fresh leg up . The stock has currently tested its 50-day EMA with a hammer and a support at its previous broken resistance (Change in polarity) reinforcing the bullish setup.
With a move above 4355 , NSE:DATAPATTNS could potentially move towards 4660. Consider entering above the high of the hammer with a stoploss at 3800 on a daily closing basis.
Key Support Levels: 4230,4140,3800.
Targets: 4660,4930.5
Disclaimer:
Investments in the securities market are subject to market risks, read all related documents carefully before investing. Securities quoted here are exemplary, not recommendatory. I am not a SEBI registered financial advisor, please consult your financial advisor before investing. Please note that I do not guarantee any assured returns for the securities quoted here.
Stay updated with my latest trading ideas and market analysis by following me on TradingView.
Hari Narayan N
Chartered Market Technician (CMT – All 3 Levels Cleared)
 Long
Long
IIFL FINANCE LTD S/R
Support and Resistance Levels:
Support Levels: These are price points (green line/shade) where a downward trend may be halted due to a concentration of buying interest. Imagine them as a safety net where buyers step in, preventing further decline.
Resistance Levels: Conversely, resistance levels (red line/shade) are where upward trends might stall due to increased selling interest. They act like a ceiling where sellers come in to push prices down.
Breakouts:
Bullish Breakout: When the price moves above resistance, it often indicates strong buying interest and the potential for a continued uptrend. Traders may view this as a signal to buy or hold.
Bearish Breakout: When the price falls below support, it can signal strong selling interest and the potential for a continued downtrend. Traders might see this as a cue to sell or avoid buying.
MA Ribbon (EMA 20, EMA 50, EMA 100, EMA 200) :
Above EMA: If the stock price is above the EMA, it suggests a potential uptrend or bullish momentum.
Below EMA: If the stock price is below the EMA, it indicates a potential downtrend or bearish momentum.
Trendline: A trendline is a straight line drawn on a chart to represent the general direction of a data point set.
Uptrend Line: Drawn by connecting the lows in an upward trend. Indicates that the price is moving higher over time. Acts as a support level, where prices tend to bounce upward.
Downtrend Line: Drawn by connecting the highs in a downward trend. Indicates that the price is moving lower over time. It acts as a resistance level, where prices tend to drop.
Disclaimer:
I am not SEBI registered. The information provided here is for learning purposes only and should not be interpreted as financial advice. Consider the broader market context and consult with a qualified financial advisor before making investment decisions.