Indo Rama🧵 STOCK TO WATCH 🧵
₹72 → ₹113 → ₹210 👀
A polyester turnaround + margin improvement + momentum setup appearing on my Weekly R4 Momentum Breakout Scanner.
Indo Rama Synthetics (India) Ltd.
📌 Buy Zone: ₹72
📌 Breakout Zone: ₹72
🛑 Stop Loss: ₹48
🎯 Target 1: ₹113
🎯 Target 2: ₹210
Why Indo Rama Synthetics?
🧵 Integrated polyester player: Indo Rama is one of India's major dedicated polyester manufacturers, with products including PSF, POY, DTY, FDY, polyester chips and PET resin. Its Butibori facility has capacity of 6.72 lakh tonnes per annum.
📈 Major FY26 earnings improvement: Consolidated FY26 EBITDA jumped to ₹368.25 Cr from ₹207.99 Cr, while PAT increased sharply to ₹150.21 Cr from ₹1.40 Cr in FY25.
💰 Margin improvement: FY26 performance reflected substantial improvement in operating profitability, with the company attributing the improvement to operational-cost rationalisation and better margins.
🏭 Large integrated manufacturing base: The company operates an integrated manufacturing complex at Butibori, near Nagpur, providing scale and operational integration across its polyester portfolio.
🌍 Global footprint: Indo Rama has a presence across multiple international markets and benefits from technical collaborations with companies from Japan, Germany and the USA.
🔥 Weekly R4 Momentum Breakout: ₹72 is the key level on my scanner. Sustained momentum around this zone could open the path towards ₹113 and potentially the much higher ₹210 scenario.
Why It Caught My Attention
✅ Large integrated polyester manufacturing base
✅ 6.72 lakh TPA production capacity
✅ Strong FY26 EBITDA improvement
✅ Sharp turnaround in FY26 profitability
✅ Product diversification across polyester & PET resin
✅ Global market presence
🔥 Weekly R4 Momentum Breakout
⚠️ IMPORTANT
This is not a simple revenue-growth story.
Q1 FY27 revenue actually declined 28.3% YoY to ₹936.64 Cr, partly impacted by volume pressure related to geopolitical issues in West Asia. However, EBITDA increased 7.75% YoY to ₹108.04 Cr, while PAT rose 20.83% to ₹63.74 Cr, showing the importance of margins and product mix.
The polyester industry is also cyclical and sensitive to raw-material prices, spreads, demand and global trade conditions.
Therefore, ₹48 remains the key risk-management level.
The ₹113 and ₹210 levels are technical/momentum targets, not guaranteed fundamental valuations.
Risk Defined. Reward Visible.
📢 Disclaimer: This content is for educational purposes only and not investment advice. Please do your own due diligence before making any investment decisions.
© 20K Microcap Investing | R4 Momentum Desk
#IndoRama #IndoRamaSynthetics #PolyesterStocks #TextileStocks #TurnaroundStocks #SmallCapStocks #MomentumStocks #BreakoutStocks #StockMarketIndia #IndianStocks #StocksToWatch #R4Breakout #MomentumInvesting #20KMicrocap  Long
Long
Lancor Holdings 🏗️ STOCK TO WATCH 🏗️
₹35–37 → ₹70 → ₹99 👀
A real-estate turnaround + earnings improvement + momentum setup appearing on my Weekly R4 Momentum Breakout Scanner.
Lancor Holdings Ltd.
📌 Buy Zone: ₹35–37
📌 Breakout Zone: ₹34
🛑 Stop Loss: ₹26
🎯 Target 1: ₹70
🎯 Target 2: ₹99
Why Lancor Holdings?
🏠 Chennai-focused real-estate play: Lancor is a real-estate developer with projects across Chennai, including residential developments, senior living and plotted developments.
📈 Strong Q1 FY27 performance: Q1 FY27 total income was ₹63.78 Cr, up 51.2% YoY, while PAT jumped to ₹17.25 Cr from just ₹0.12 Cr in Q1 FY26.
💰 Operating improvement: Q1 FY27 operating profit was around ₹7.32 Cr, up 34% YoY, with operating margin at approximately 16.4%.
🏗️ Project pipeline: The company has multiple ongoing/marketed developments across Chennai, giving it exposure to the city's residential and plotted-development demand.
🔄 Earnings turnaround angle: The sharp improvement in quarterly profitability makes Lancor an interesting turnaround/real-estate momentum candidate, although quarterly numbers can be lumpy for developers.
🔥 Weekly R4 Momentum Breakout: ₹34–35 is the key technical zone on my scanner. Sustained strength above this area could open the path towards ₹70 and potentially ₹99.
Why It Caught My Attention
✅ Chennai real-estate exposure
✅ 51% YoY Q1 revenue growth
✅ Sharp improvement in profitability
✅ Operating profit growth
✅ Multiple projects across Chennai
✅ Turnaround + momentum character
🔥 Weekly R4 Momentum Breakout
⚠️ IMPORTANT
This is a high-risk small-cap real-estate setup.
Real-estate earnings can be lumpy and project-dependent, while execution, approvals, collections, construction costs and leverage can materially affect future results.
The Q1 FY27 PAT improvement is significant, but it should not automatically be extrapolated into future quarters. The ₹70 and ₹99 levels are technical/momentum targets, not guaranteed fundamental valuations.
₹26 remains the key risk-management level.
Risk Defined. Reward Visible.
📢 Disclaimer: This content is for educational purposes only and not investment advice. Please do your own due diligence before making any investment decisions.
© 20K Microcap Investing | R4 Momentum Desk
#LancorHoldings #LANCORHOL #RealEstateStocks #ChennaiRealEstate #SmallCapStocks #TurnaroundStocks #MomentumStocks #BreakoutStocks #StockMarketIndia #IndianStocks #StocksToWatch #R4Breakout #MomentumInvesting #20KMicrocap  Long
Long
 Long
Long
 Long
Long
 Long
Long
ARVIND: Two month base at highs after a strong Stage 2 legStock spent most of 2025 in a Stage 4 decline. Price under falling averages from August through January, a long slow grind with no reason to be involved.
The base started forming in February. Price came off the lows, then spent about three months building sideways right around the long term average, roughly from February to early May. That average flattened out underneath and eventually turned up. This is the part people find boring, but it is where everything gets set.
The breakout came in early May with the biggest volume bar on the chart. Price left the base and did not look back, running most of the way through May and June without giving anything meaningful back. Every dip found the short term average and held.
Since early July it has been building the second base at the highs. Two months of sideways movement, the rising average working through the range, and price holding the lower boundary each time it gets tested.
Today closed down 2.5% but it is still inside the range. Nothing broken.
That is the whole method. Wait for the trend to turn, then buy each base as it resolves. First base gives you the big move, second base gives you a lower risk continuation entry.
Valid while the base low holds. Close back under it and I stand aside.
Not a recommendation, just sharing what I am watching.  Long
Long
APCOTEXIND: Second base setting up after a big Stage 2 moveStock spent September through April going nowhere useful. Slow Stage 4 drift, price under a falling long term average, a downtrend line capping it, and a final flush down in April. Nothing to trade there.
That April low was the turn. Price came back hard, cleared the long term average and the downtrend line in early May, and moved into Stage 2.
Then it built the first base. A long one, roughly three months through May, June and July, wide and choppy while the rising average worked its way up from underneath. Boring to hold, but that is where the setup gets built.
It broke out at the end of July with a gap and the biggest volume bar on the chart. That kind of volume is not retail, that is size coming in.
Since then it has been building the second base right above the gap. About six weeks sideways, holding the rising short term average on each dip, range tightening into the right edge.
Today closed down 2.3% but still inside the base. Nothing broken.
This is the pattern I keep repeating. Wait for the trend to turn, then trade each base as it resolves. You do not need to guess anything. The structure tells you when to act and when to leave it alone.
Valid while the base low holds. A close back under it and the setup is done.
Not a recommendation, just sharing what I am watching.  Long
Long
STOVEKRAFT: Two month base at highs, now resolvingLook at the left side of this chart. Stock topped in early November and then fell for five straight months. Averages pointing down, a clean trendline off that high rejecting every bounce, price making lower lows all the way into April. That is Stage 4 and there is no trade in it.
March is where it changed. Huge volume came in on the low, price stopped going down, and by April it was building a base.
That base ran through April and May, sitting just under the long term average while the short term average turned up beneath it. Six weeks of nothing. Then it broke in early June, took out the downtrend line and the long term average together, and ran hard.
Since July the stock has been building its second base. Two months sideways at the highs, holding the rising short term average on every pullback, and the range has been tightening. Volume came in on the August low and again on the recent push at the top of the range.
Now it is at the top edge of that base.
The point of this approach is that you do not need to catch the bottom. The first base was the hard one because nothing was confirmed yet. This one sits above a proven trend with rising averages underneath, so the risk is defined and the structure is doing the work.
Today closed lower but still inside the range. Nothing broken yet. Valid while the base low holds. If it closes back under that, I am out and I wait.
Not a recommendation, just sharing what I am watching.  Long
Long
SPORTKING: Four bases, four breakouts, still goingThis one has been a textbook case since February.
Stock was in a long Stage 4 decline from September through January. Falling averages, a clean downtrend line capping every bounce, price grinding to lower lows. Nothing to do for months.
The bottom came in late January. Price turned up hard, broke the downtrend line and cleared the long term average in a single move in February. That was the Stage 4 to Stage 2 handover, and it happened fast.
Since then it has done the same thing four times.
First base in February and March, sitting right on top of the long term average it had just reclaimed. Broke out in April.
Second base in April and May, tight, holding the rising short term average. Broke out in late May.
Third base through June and July, wider and longer, price chopping sideways while the average caught up from below. Broke out at the end of July on a big volume bar.
Fourth base through August, again holding the same rising average, tightening up into the right edge.
Four consolidations, four resolutions higher, and price never once broke the short term average through the whole advance. Stock has more than doubled and it has never gone vertical. That is what makes it tradeable.
This is the whole approach. Wait for Stage 2 to confirm, then buy each base as it resolves. You are not predicting anything, you are following a structure that is already working.
Watching the fourth base now. Valid as long as the base low holds. A close back inside the August range and the structure is damaged.
Not a recommendation, just sharing what I am watching.  Long
Long
SOTL: Third base breaking out in a clean Stage 2 uptrendThis one is one of the cleanest structures on my screen right now.
Stock was drifting lower from December through April. Nothing dramatic, just a slow Stage 4 grind with the averages sloping down and price making lower lows into the April bottom.
Turn came in late April. Price got back above the short term average and then pushed straight through the long term average in early May on a volume spike. That was the Stage 4 to Stage 2 handover.
After that it has been the same pattern three times over.
First base in May, tight and short, right on top of the long term average. Broke out at the start of June with the biggest volume bar on the chart.
Second base through June and July, much wider, price chopping around while the rising average caught up from underneath. Broke out in early August, again on volume.
Third base through August, price holding above the same rising average, tightening up. Now it is pushing out of that range with another big volume bar at the start of September.
Three bases, three breakouts, each one higher than the last, and every consolidation held the short term average. That is what a healthy Stage 2 looks like. Nothing vertical, nothing forced, just pause and continue.
I am tracking this for the third base resolution. Structure stays valid as long as price holds the base low. If it closes back inside the August range, the move is damaged and I step aside.
Not a recommendation, just sharing what I am watching.  Long
Long
BEPL: Stage 2 confirmed, second base breaking outStock was in a proper Stage 4 decline through the second half of 2025. Falling averages, lower highs, price under everything. Nothing to do.
Bottom came in March 2026. Price stopped making new lows, then pushed back above the short term average in April. That was the first sign.
Then it built the first base. Long one, roughly three months, sideways while the averages caught up and turned higher. Broke out in July with a big gap and the heaviest volume on the chart. That volume is the part that matters, that was real buying.
Since then it has been building the second base right above the breakout point. Tight, holding the rising average on every dip. Now it is pushing at the top of that range.
Same idea as always. Wait for Stage 2 to be confirmed, then buy the resolution of each base while the structure holds. You are not calling the top or the bottom, just following what is already working.
Today closed weak but still inside the base. Nothing broken. It stays valid as long as it holds the base low.
Not a recommendation, just sharing what I am watching.  Long
Long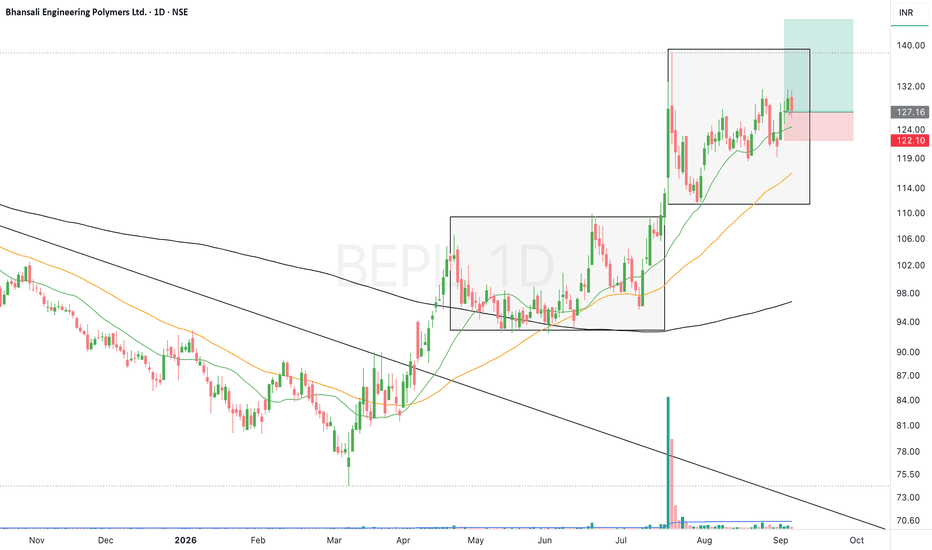
 Long
Long
 Long
Long
RELIANCE INDUSTRIES — BIG BREAKOUT SETUP Technical Rationale | Daily Time Frame
Reliance Industries is currently approaching a major resistance zone near ₹1,340, formed by connecting the key resistance levels of 5 Jan 2026 & 7 May 2026.
Time Cycle:
The stock has completed nearly 109–110 days of range-bound consolidation, making the current setup technically significant.
Volume Confirmation:
A massive volume of approximately 31M shares was generated near the bottom, followed by a continuous upside move — indicating strong buying participation.
Key Levels:
Major Support: ₹1,290–₹1,300
Breakout Zone: ₹1,340–₹1,350
Target Zone: ₹1,424–₹1,440
Potential Upside: ~6%
Why This Setup Is Important?
109–110 days consolidation completed
Strong volume near the bottom
Continuous recovery after volume accumulation
Stock approaching major resistance
Breakout with volume can trigger a strong upside move
Key Trigger: A decisive breakout and sustained move above ₹1,350 with strong volume can confirm the setup.
Stay Alert. Breakout confirmation is the key!
Educational analysis only. Trade with proper confirmation and  Long
Long
 Education
 Long
Long
 Long
Long
 Long
Long


