UPL Core Setup: ₹607 Liquidity SweepHere is the complete breakdown of the trade setup shown in your TradingView chart:
## **Chart Overview**
* **Instrument:** UPL (NSE)
* **Timeframe:** 15-Minute Chart
* **Current Price:** **₹611.60** (+0.45%)
## **Technical Analysis & Structure**
* **Smart Money Concepts (SMC):** The setup highlights a **Change of Character (CHoCH)** followed by a **Break of Structure (BOS)** around the ₹603–₹607 support zone, indicating that sellers lost control and buyers stepped in.
* **Buy Signal:** A green **BUY** signal was generated following the structural breakout and retest near **₹607.20**.
## **Trade Parameters & Math**
| Parameter | Level | Point Value |
|---|---|---|
| **Entry Price** | **₹607.20** | — |
| **Stop Loss (SL)** | **₹603.00** | **₹4.20** risk (0.69%) |
| **Target (TP)** | **₹630.65** | **₹23.45** reward (3.86%) |
| **Current Price** | **₹611.60** | **+₹4.40** profit active |
### **Risk-to-Reward Ratio (R:R)**
* **Risk:** ₹4.20 per share
* **Potential Reward:** ₹23.45 per share
* **Verdict:** A high R:R setup. Risking ₹1 yields a potential return of ₹5.58.
## **Current Position Status**
* **In Profit:** The price is actively trading at **₹611.60**, holding **+4.40 points** above the entry level.
* **Key Resistance Ahead:** The top target around **₹630–₹632** aligns with the long-term moving average (red line running across the upper panel), making it a logical area to lock in gains or take partial profits.
Review and plan for 23rd July 2026 Nifty future and banknifty future analysis and intraday plan.
Results- NestleInd, Srf, Indusindbk.
This video is for information/education purpose only. you are 100% responsible for any actions you take by reading/viewing this post.
please consult your financial advisor before taking any action.
----Vinaykumar hiremath, CMT
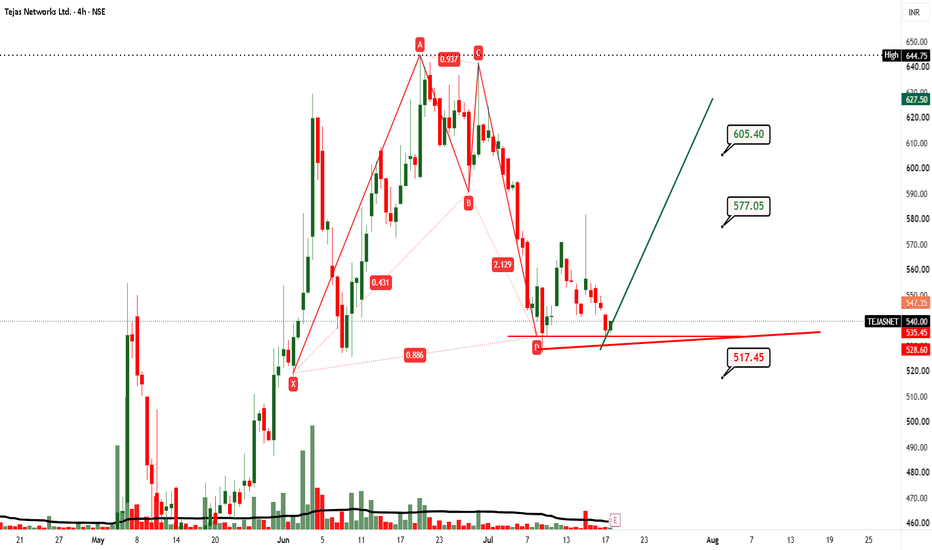
TEJASNET 4HR
Bullish Bat
Strong Potential Reversal Zone as price initially when touched Point D it given good reaction and hit target1 now price again came in the zone now its reversal
Price need to follow Accelerted TREND LINE i.e green line and hit targets else if price breaks PRIMARY TREN D LINE i.e exit trade with small loss before SL
POTENTIAL BUY
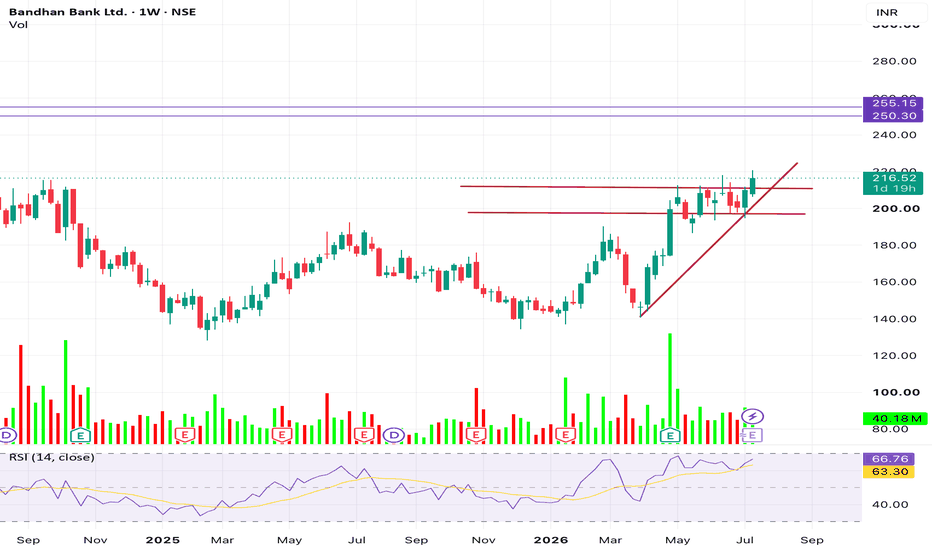
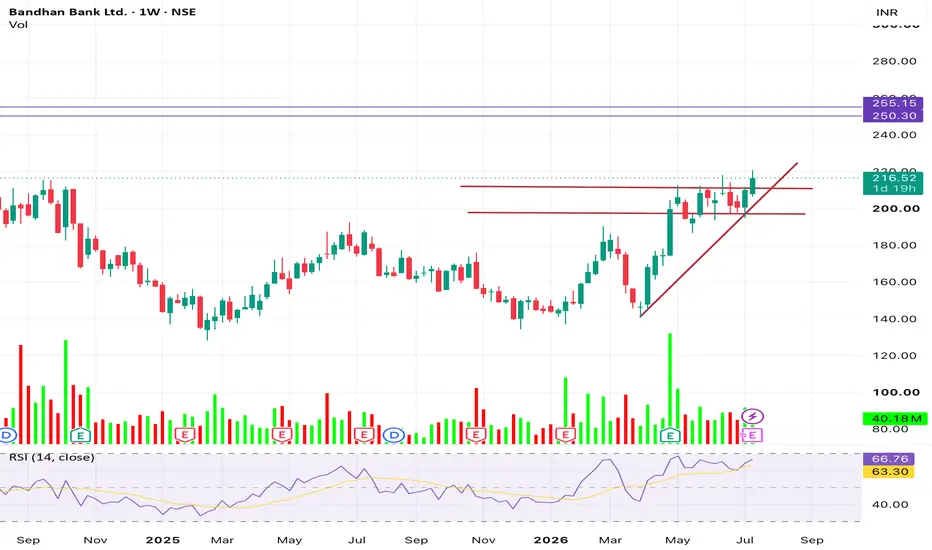
Bandhan Bank Breakout: Multi-Year Base Signals Strong Bullish ReBandhan Bank is displaying one of the strongest bullish structures on the weekly chart, with price decisively reclaiming the ₹200–210 resistance zone after months of accumulation. The breakout follows a prolonged base formation, indicating a potential shift from a corrective phase to a sustained uptrend.
The stock is now trading above key moving resistance levels while maintaining a series of higher highs and higher lows, confirming strengthening momentum. Rising volumes during the advance reinforce institutional participation, adding credibility to the breakout.
A sustained move above ₹218–220 could trigger the next leg of the rally toward the ₹250–255 zone, which marks the next major higher-timeframe resistance. As long as the stock holds above ₹200, the breakout remains intact, making Bandhan Bank a strong bullish candidate for medium-term investors.
Senco Gold Nears Breakout: Can ₹408 Trigger the Next Rally?Senco Gold continues to benefit from the structural shift from unorganized to organized jewellery players, expansion in showroom network, and increasing contribution from higher-margin diamond and studded jewellery. The company is targeting 20-25% revenue growth in FY27, although management expects profit margins to normalize after an exceptional FY26 performance.
Key Financial Ratios
P/E Ratio: ~10.6x
Price-to-Book: ~2.4x
Operating Margin: ~11.5%
EPS (FY26): ₹35.47
Book Value Per Share: ₹155
The stock trades at reasonable valuations compared with other listed jewellery peers despite strong earnings growth.
Financial Strength
✔ Strong revenue growth driven by festive demand and showroom expansion.
✔ Improving product mix through higher contribution from diamonds and studded jewellery.
✔ Beneficiary of long-term organized jewellery sector growth.
✔ Strong earnings momentum in FY26 with significant profit expansion.
✔ Continued expansion plans support long-term growth visibility.
Risks
❌ High dependence on gold prices and consumer sentiment.
❌ Margin normalization expected after exceptional FY26 profitability.
❌ Volume growth may moderate if gold prices remain elevated.
Technical Outlook
The stock has formed a strong base around the ₹320-360 region and has recently bounced sharply, indicating accumulation at lower levels.
Key Technical Levels
📌 Major Breakout Level: ₹408
A decisive close above this level could trigger fresh momentum buying.
📌 Immediate Resistance (R1): ₹455
📌 Major Resistance (R2): ₹500
📌 Long-Term Resistance (R3): ₹560
📌 Reversal Zone: ₹355 – ₹366
The highlighted reversal zone acts as an important demand area. As long as the stock sustains above this zone, the bullish structure remains intact.
Techno-Fundamental View
The combination of:
✔ Improving earnings trajectory
✔ Reasonable valuations compared with peers
✔ Strong industry tailwinds from formalization of jewellery demand
✔ Expansion-led growth strategy
✔ Emerging technical breakout setup above ₹408
Fundamental Ratings (Out of 5)
Business Strength: 4.0
Financial Stability: 3.8
Profitability: 4.0
Valuation: 4.0
Growth Potential: 4.3
Overall Techno-Fundamental Rating: 4.0/5
Disclaimer: aliceblueonline.com
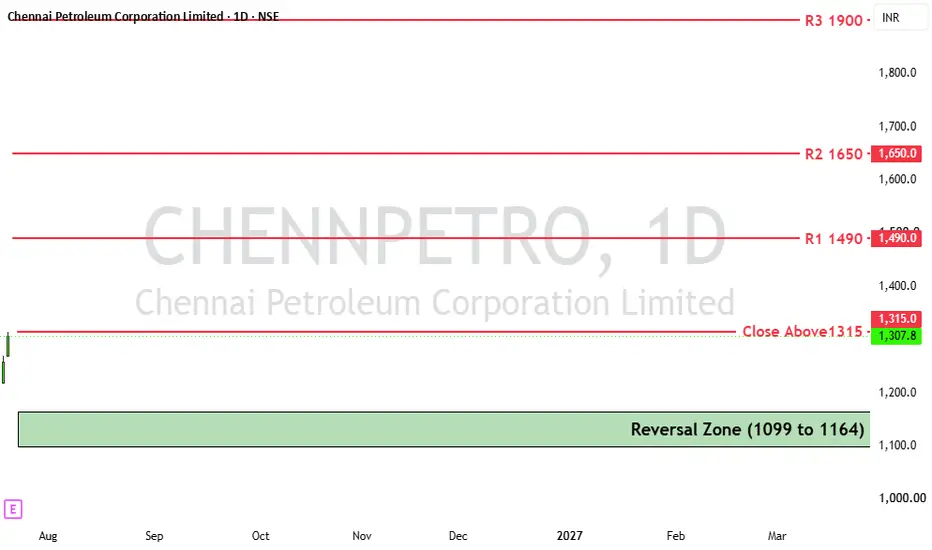
CPCL Breaks Into New Highs: More Upside Ahead?Chennai Petroleum Corporation Ltd. (CPCL) has entered a strong bullish phase after delivering a decisive breakout above its previous all-time high zone near ₹1,315. The stock closed at ₹1,307.80 (+3.95%), indicating strong buying momentum and renewed investor interest in the PSU refining space.
The breakout is particularly significant because it is supported not only by price action but also by robust financial performance, making CPCL an attractive techno-fundamental opportunity.
Fundamental Strength
Valuation & Profitability
P/E Ratio: ~5.4x (significantly below market average)
Price-to-Book: ~1.5x
ROE: ~32%
ROCE: ~32%
Dividend Yield: ~1.2%
The company continues to trade at inexpensive valuations despite delivering strong earnings and maintaining superior return ratios.
Balance Sheet & Financial Stability
Strong cash generation and improving liquidity.
Debt levels remain manageable compared to historical levels.
Healthy operating cash flows support future expansion and capex requirements.
CPCL's recent Navratna status enhances operational flexibility and growth prospects.
Fundamental Rating (Out of 5)
Business Strength: 4.0
Financial Stability: 4.0
Profitability: 4.5
Valuation: 4.5
Growth Potential: 3.5
Overall Fundamental Rating: 4.1/5
Technical Outlook
The stock has been forming a series of higher highs and higher lows, indicating a well-established uptrend. The recent breakout above the previous lifetime high confirms continuation of bullish momentum.
Key Technical Levels
📌 Major Breakout Level: ₹1,315
A decisive close above this zone can trigger fresh momentum buying.
📌 Immediate Resistance (R1): ₹1,490
📌 Major Resistance (R2): ₹1,650
📌 Reversal Accumulation Zone: ₹1,099 – ₹1,164
The highlighted green zone acts as a strong demand area. Any correction towards this region may attract long-term investors and positional traders.
ANISHFNK21
Follow
Disclaimer
The information and publications are not meant to be, and do not constitute, financial, investment, trading, or other types of advice or recommendations supplied or endorsed by TradingView. Read more in the Terms of Use.
Disclaimer: aliceblueonline.com
Kirloskar Pneumatic: Next Multibagger?Kirloskar Pneumatic Co. Ltd. continues to stand out as a fundamentally strong industrial engineering company, backed by a debt-free balance sheet, healthy cash flows, and consistently high return ratios. The company benefits from growing demand across industrial, infrastructure, oil & gas, and manufacturing sectors, positioning it well for long-term growth.
Fundamental Analysis & Ratings
Revenue Growth: 4.5/5 – Consistent revenue growth driven by industrial capex and infrastructure demand.
Profit Growth: 4.5/5 – Healthy earnings growth with improving profitability.
Operating Margin: 4.5/5 – Stable margins reflecting efficient cost management.
Return on Equity (ROE): 5/5 – Excellent shareholder returns of over 21%.
Return on Capital Employed (ROCE): 5/5 – Strong capital efficiency above 25%.
Balance Sheet Strength: 5/5 – Debt-free with a robust net cash position.
Cash Flow Generation: 5/5 – Strong operating and free cash flow supporting future expansion.
Liquidity: 5/5 – Healthy current ratio and strong cash reserves.
Debt Management: 5/5 – Virtually debt-free, minimizing financial risk.
Dividend Quality: 3.5/5 – Consistent dividend payout with room for future growth.
Management Efficiency: 5/5 – Disciplined capital allocation and strong operational execution.
Valuation: 3/5 – Premium valuation (P/E ~48x), which limits the margin of safety.
Overall Ratings
Financial Strength: 5/5
Profitability: 5/5
Balance Sheet: 5/5
Cash Flow: 5/5
Business Quality: 4.8/5
Growth Potential: 4.5/5
Valuation: 3/5
Technical Structure: 4.5/5
Technical Levels
Immediate Support: Yearly Breakout Level
Major Reversal Zone: ₹1,565 – ₹1,672
Resistance 1: ₹2,025
Resistance 2: ₹2,370
Resistance 3: ₹2,830
Resistance 4: ₹3,230
Overall Fundamental Rating: 4.7/5
Investment View
Kirloskar Pneumatic remains a high-quality engineering company with exceptional financial strength and a constructive long-term technical setup. The stock is currently testing its Yearly Breakout Level, while the ₹1,565–₹1,672 Reversal Zone serves as a key accumulation area for long-term investors. A sustained move above ₹2,025 could revive bullish momentum toward higher resistance levels. Although valuations remain expensive, the company's robust fundamentals continue to support a Bullish long-term outlook, making corrections an opportunity for gradual accumulation.
Disclaimer: aliceblueonline.com
Daily Consolidation at Key Fibonacci Support Zone [Educational]📊 Styrenix Performance Materials Ltd (STYRENIX) - Daily (1D) Chart Analysis
This post is shared for EDUCATIONAL PURPOSES ONLY to analyze daily Fibonacci structures and moving average setups. It is not financial or investment advice.
🟢 Technical Observations:
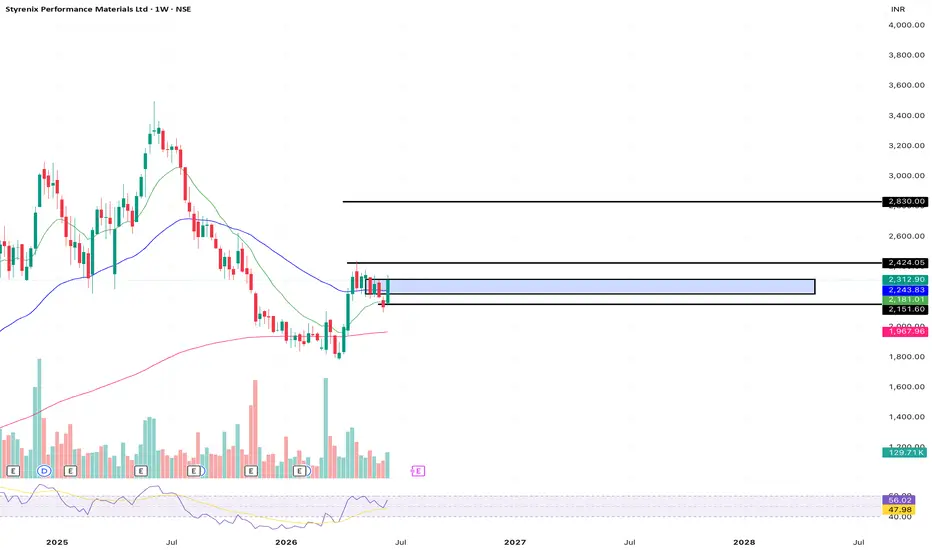
1. Reclaimed Support Floor: On the daily timeframe, STYRENIX has established strong baseline support at the 50.00% Fibonacci level (2,095.50).
2. Moving Average Crossover: The short-term moving averages (blue and red lines) have compressed and are beginning to curl upward underneath the current price of 2,312.90, signaling a potential shift in short-term momentum.
3. Consolidation Zone: The price is currently tightly consolidating between the 50% Fib support (2,095.50) and the immediate overhead 38.2% Fib resistance (2,424.10). A daily close above 2,424.10 could trigger an aggressive breakout move.
🎯 Educational Swing Setup (Daily View):
• Entry Zone: 2,220.00 – 2,315.00 (Accumulating within this consolidation pocket provides a tight, low-risk entry relative to the recent swing low).
• Target 1: 2,424.00 (Immediate 38.2% Fibonacci Retracement barrier)
• Target 2: 2,830.00 (23.6% Fibonacci level / previous major structural peak)
• Invalidation / Stop-Loss: 2,150.00 (A daily close below the moving average cluster and the 50% Fib level invalidates this immediate reversal setup).
• Expected Duration: 5 to 15 Trading Days (Short-to-medium daily swing)
⚠️ Risk Management:
Keep a close eye on the daily volume. An expansion of green volume bars will confirm if institutional buyers are stepping in to break past the 2,424 resistance level. Always size your positions appropriately!
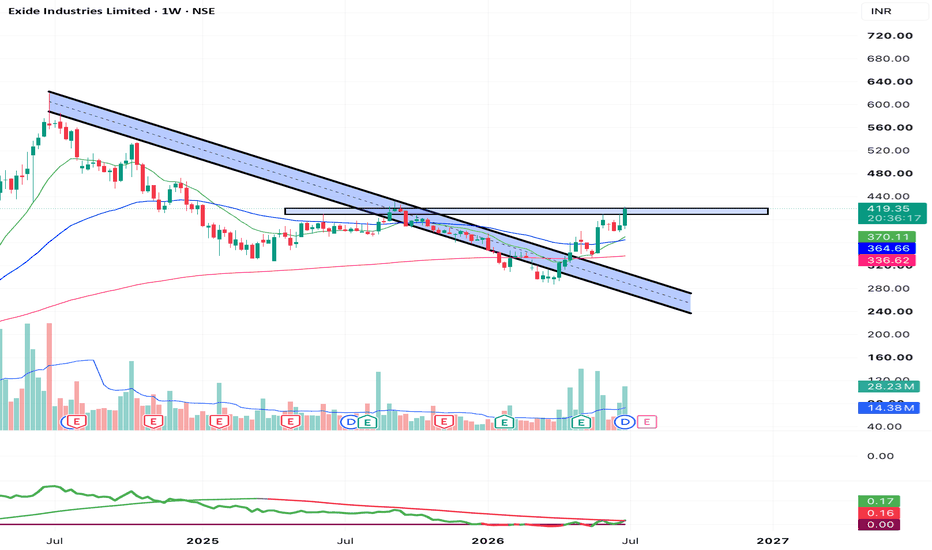
EXIDEIND: Massive Daily Channel Breakout with Explosive Volume 📊 Exide Industries Limited (EXIDEIND) - Daily (1D) Chart Analysis
This post is shared for EDUCATIONAL PURPOSES ONLY to analyze macro channel breakouts, horizontal supply flips, and volume confirmation. It is not financial or investment advice.
🟢 Technical Observations:
1. Macro Channel Breakout: On the daily chart, EXIDEIND has decisively broken out from a major multi-month descending channel pattern that has capped price growth since mid-2024.
2. Horizontal Resistance Flip: The explosive green candle has cleanly cleared the immediate horizontal resistance block built around 391.00 - 400.00. This old supply zone is now expected to act as rock-solid foundational support.
3. Huge Volume Surge: The breakout is validated by a massive volume bar of 21.06 million, far exceeding the 30-day average volume of 4.22 million. This indicates a high conviction influx of institutional/bulk buyer accumulation.
4. Moving Average Shift: The price has aggressively forced its way above both the short-term and medium-term exponential moving averages, turning the overall trend bias powerfully bullish.
🎯 Educational Swing Setup:
• Entry Zone: 395.00 – 419.35 (Entering parts near current levels, or looking for minor intraday pullbacks or retests toward the 400.00 breakout flip zone for an optimal risk-to-reward ratio).
• Target 1: 460.00 (Near-term structural target approaching previous macro swing peaks)
• Target 2: 500.00 (Major psychological round-number target)
• Invalidation / Stop-Loss: 370.00 (A definitive daily close back below the moving average support cluster and inside the channel boundaries invalidates this momentum breakout wave).
• Expected Duration: 2 to 4 Weeks (Daily swing view)
⚠️ Risk Management:
Since the stock has put on an impressive +7.43% vertical rally today, minor short-term consolidation or a brief retest of the 400 line is standard behavior. Keep position sizing disciplined and do not over-leverage!
DATAPATTNS is showing a bullish move at an ascending channelNSE:DATAPATTNS has been in a sustained bullish trend for several months and has recently found support at the lower boundary of its ascending channel on the daily timeframe , reinforcing the likelihood of continued upward momentum.
Additionally, the sectoral index , NSE:NIFTY_IND_DEFENCE , has retested its all-time-high with a morning star pattern , providing further confirmation of relative strength among the sectors and supporting the top-down approach.
The Daily RSI(14) at 47.51 is also indicating a bullish reversal signaling a potential formation of a higher low with a fresh leg up . The stock has currently tested its 50-day EMA with a hammer and a support at its previous broken resistance (Change in polarity) reinforcing the bullish setup.
With a move above 4355 , NSE:DATAPATTNS could potentially move towards 4660. Consider entering above the high of the hammer with a stoploss at 3800 on a daily closing basis.
Key Support Levels: 4230,4140,3800.
Targets: 4660,4930.5
Disclaimer:
Investments in the securities market are subject to market risks, read all related documents carefully before investing. Securities quoted here are exemplary, not recommendatory. I am not a SEBI registered financial advisor, please consult your financial advisor before investing. Please note that I do not guarantee any assured returns for the securities quoted here.
Stay updated with my latest trading ideas and market analysis by following me on TradingView.
Hari Narayan N
Chartered Market Technician (CMT – All 3 Levels Cleared)
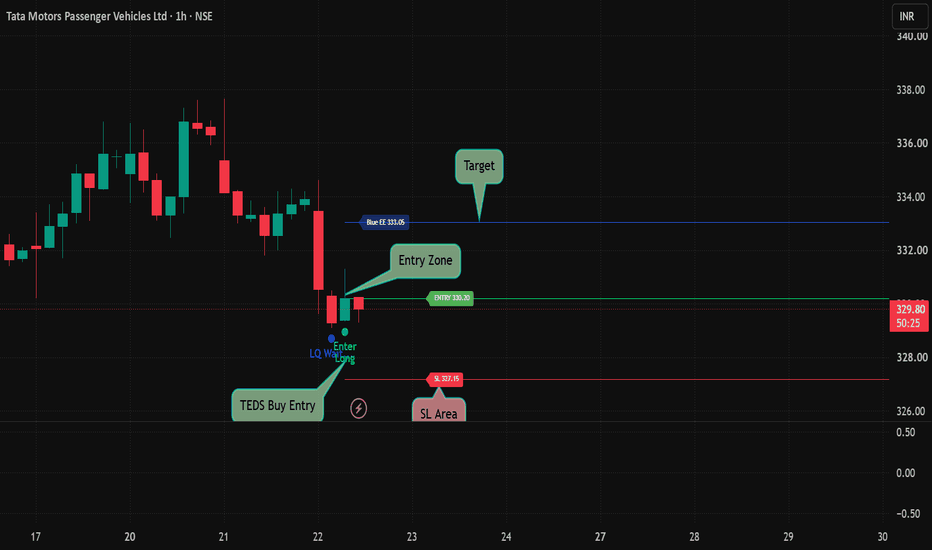
TEDS Intraday Analysis | TMPV long Setup | 22 July 26One of the most common mistakes in intraday trading is assuming that every sharp decline is immediately followed by a strong reversal.
The TEDS (Trend Exhaustion Detection System) is designed to remove guesswork by waiting for confirmation before planning a trade.
Chart Observation
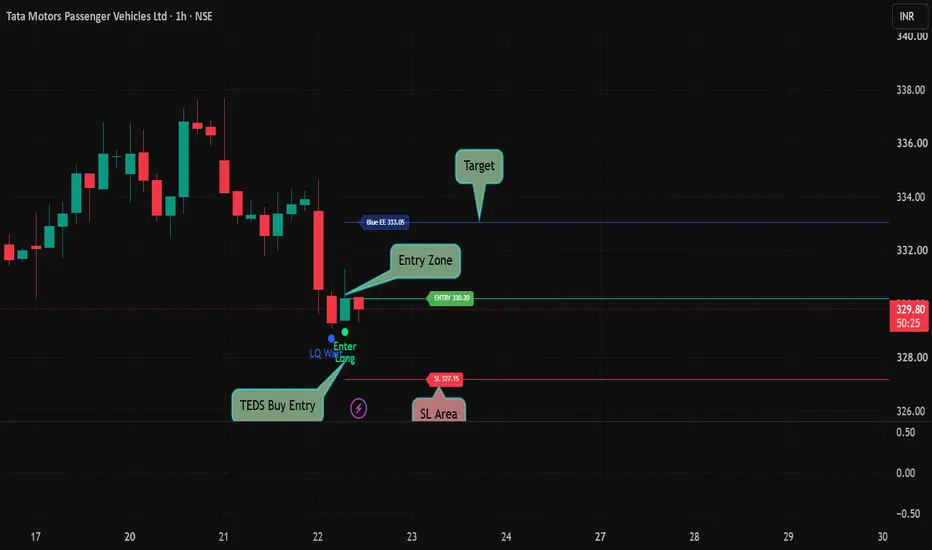
🔹 Following the recent decline, the framework first entered a Long Queue, indicating that the market required further confirmation before considering a long position.
🔹 Once the predefined conditions aligned, TEDS generated a Buy Entry and established a structured Entry Zone.
🔹 Before planning the trade, the framework also defined the Stop Loss Area and the first Target Level, ensuring that risk and reward were evaluated before execution—not after.
A disciplined trader should always ask:
• Has the market confirmed the setup?
• Is my entry based on a structured framework rather than the first green candle?
• Is my downside risk clearly defined?
• Do I have a complete trade plan before entering the market?
Trading success doesn't come from predicting every reversal. It comes from consistently following a repeatable process with patience and discipline.
Trade with a Framework. Not with Emotions.
Disclaimer: This chart is shared for educational purposes only to explain a structured trading framework and market behaviour. It is not investment advice or a recommendation to buy or sell any security or financial instrument. Please conduct your own analysis and apply appropriate risk management before making any trading decisions.
Gap Fill - Keep An Eye - ASTRAL📊 Script: ASTRAL
📊 Sector: Capital Goods
📊 Industry: Plastic Products - Industrial
Key highlights: 💡⚡
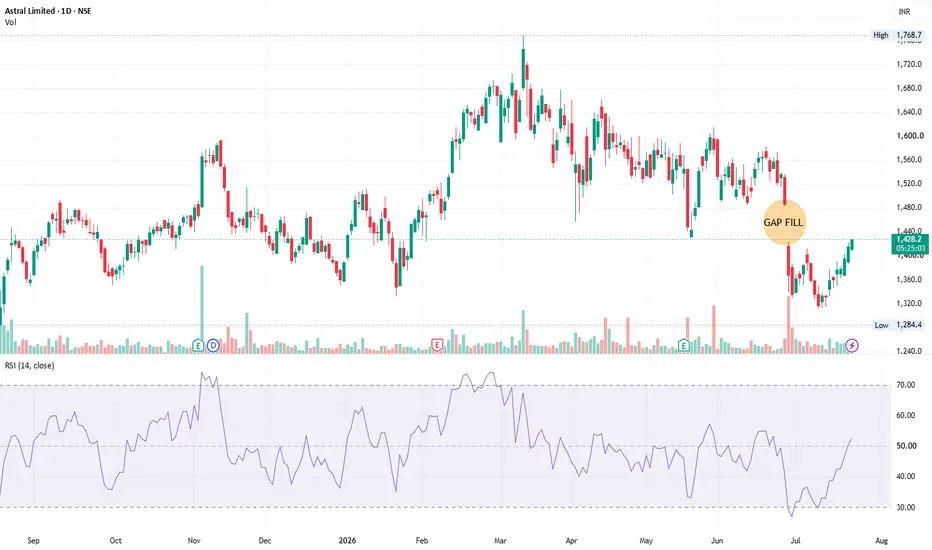
📈 Script is about to fill the gap keep an eye on it, we may see some good rally.
📈 One can go for Swing Trade.
BUY ONLY ABOVE 1427
⏱️ C.M.P 📑💰- 1425
🟢 Target 🎯🏆 - 1480+
⚠️ Important: Always maintain your Risk & Reward Ratio.
✅Like and follow to never miss a new idea!✅
Disclaimer: I am not SEBI Registered Advisor. My posts are purely for training and educational purposes.
Eat🍜 Sleep😴 TradingView📈 Repeat 🔁
Happy learning with trading. Cheers!🥂
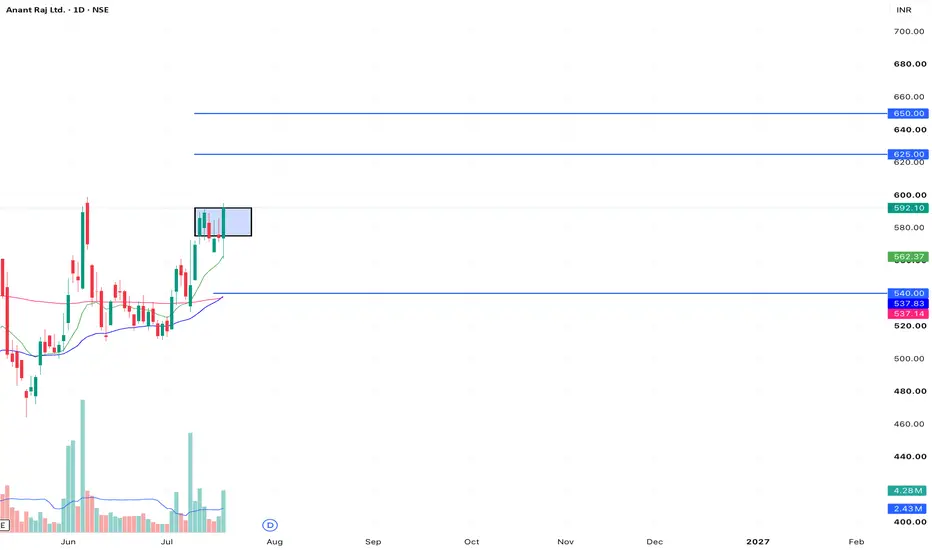
ANANTRAJ: 1H Local Range Breakout with Bullish EMA 📊 Anant Raj Limited (ANANTRAJ) - 1-Hour (1H) Chart Analysis
This post is shared for EDUCATIONAL PURPOSES ONLY to analyze short-term structural breakouts, volume expansions, and moving average fanning structures. It is not financial or investment advice.
🎯 Educational Swing Setup:
• Entry Zone: 575.00 – 592.10 (Accumulating safely within this fresh breakout extension, or maximizing risk-to-reward by tracking minor 1H pullbacks toward the 9-EMA support band).
• Target 1: 625.00 (Near-term structural resistance target zone)
• Target 2: 650.00 (Major psychological milestone target)
• Invalidation / Stop-Loss: 540.00 (A definitive hourly close below the pink long-term moving average baseline completely invalidates this breakout acceleration setup).
• Expected Duration: 4 to 10 Trading Days (Short-term hourly swing view)
⚠️ Risk Management:
Since the price has just put on a sharp vertical breakout drive, look for volume continuation to validate institutional backing over the subsequent sessions. Maintain highly disciplined position sizing!
AUBANKTechnical Note: Let the market come to your zones and show its hand. Trade safely and manage your risk! Always wait for your own confirmations before entering the market.
Risk Disclaimer: This analysis is for educational purposes only and does not constitute financial advice. Always practice proper risk and position sizing. The market is supreme; no one can make a 100% accurate prediction. Stop Loss Must if you want to be a profitable Trader.
MARKET VIEW:-
Current Bias: BEARISH
Preferred Strategy: – SELL ON RISE .... Wait for Confirmation
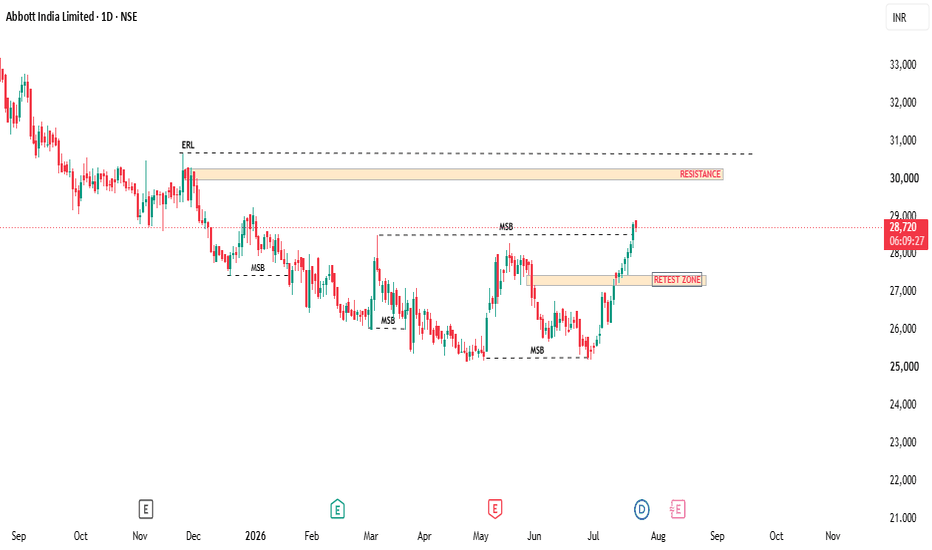
ABBOTINDIATechnical Note: Let the market come to your zones and show its hand. Trade safely and manage your risk! Always wait for your own confirmations before entering the market.
Risk Disclaimer: This analysis is for educational purposes only and does not constitute financial advice. Always practice proper risk and position sizing. The market is supreme; no one can make a 100% accurate prediction. Stop Loss Must if you want to be a profitable Trader.
MARKET VIEW:-
Current Bias: BULLISH
Preferred Strategy: – SELL ON RISE .... Wait for Confirmation