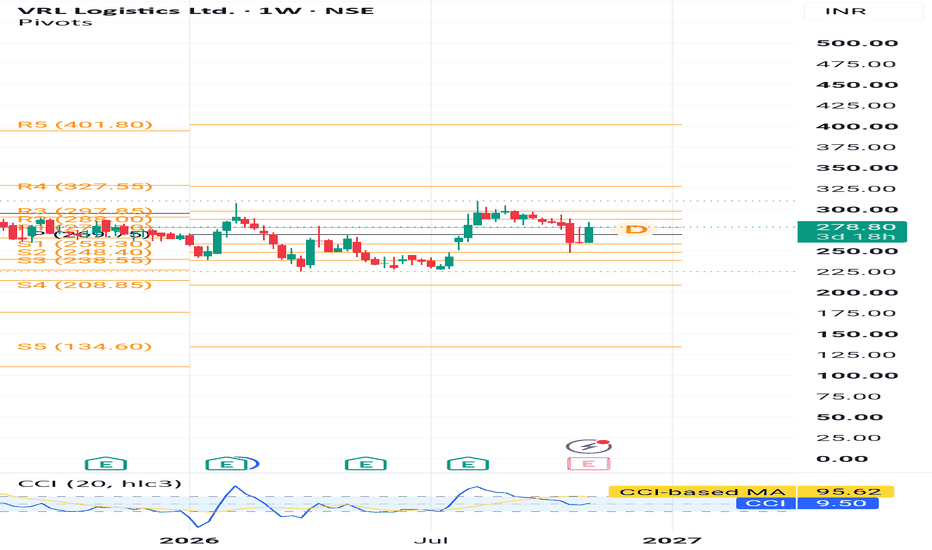
VRL Logistics 🚀 VRL LOGISTICS: 17.6% UPSIDE POTENTIAL — REVERSAL WATCH
VRL Logistics Ltd. (NSE: VRLLOG)
🟢 Buy Zone: ₹278
📍 Pivot: ₹269
🛑 Stop Loss: ₹258
🎯 Target: ₹327
📊 TRADE MATH
- Risk: ₹20/share
- Potential Reward: ₹49/share
- Risk:Reward: 1:2.45
- Potential Upside: 17.63%
#VRLLogistics #VRLLOG #SwingTrading #StockMarketIndia #BreakoutStocks
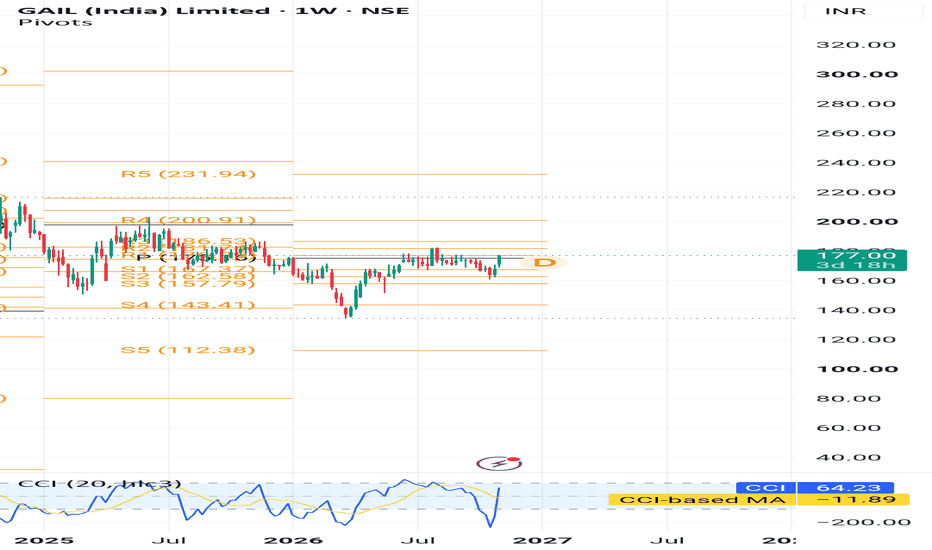
Gail Limited🚀 GAIL: 13% UPSIDE POTENTIAL — ENERGY SECTOR BREAKOUT
GAIL (India) Ltd. (NSE: GAIL)
🟢 Buy Zone: ₹177
📍 Pivot: ₹175
🛑 Stop Loss: ₹162
🎯 Target: ₹200
🔍 WHY IT CAUGHT MY ATTENTION
- Trend: Price above 20/50/100/200-day SMAs
- RSI: 75.7 — strong momentum
- MACD: +2.64 — bullish momentum.
- ADX: 34.4 — strong trend strength.
📊 TRADE MATH
- Risk: ₹15/share
- Potential Reward: ₹23/share
- Risk:Reward: 1:1.53
- Potential Upside: 12.99%
#GAIL #GAILIndia #SwingTrading #StockMarketIndia #BreakoutSt
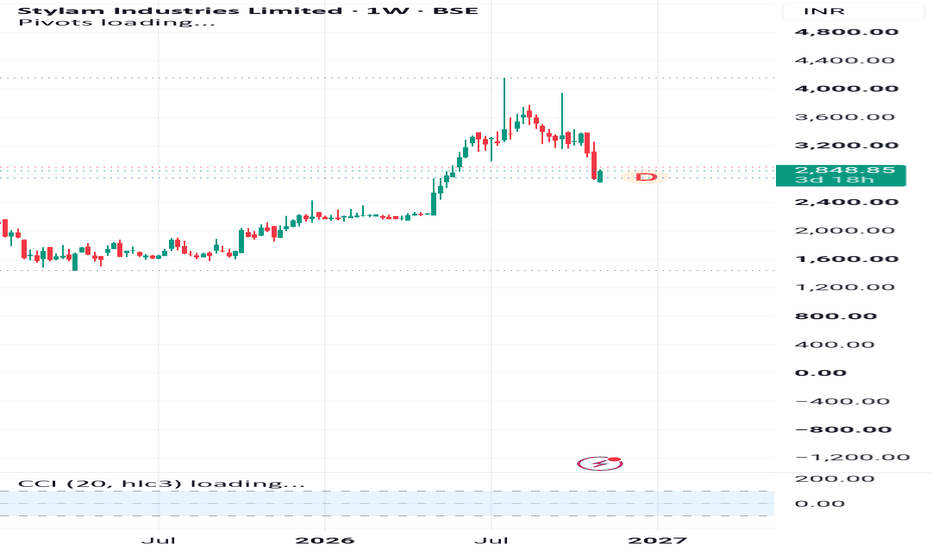
Stylam Industries ₹2,772 BREAKOUT — ₹4,320 ON THE RADAR?
STYLAM INDUSTRIES | WEEKLY R4 BREAKOUT SETUP
NSE: STYLAMIND
📌 Buy Zone: ₹2,780–2,800
🚀 Breakout: ₹2,772
🛑 Stop Loss: ₹2,137
🎯 Target 1: ₹4,320
Risk Defined. Reward Visible.
Not a recommendation. For educational purposes only. Do your own research and follow your risk management.
© 20K MICROCAP INVESTING | R4 MOMENTUM DESK
#StylamIndustries #STYLAMIND #StockToWatch #BreakoutStocks #SwingTrading #IndianStocks #MomentumStocks #R4Momentum #20KMicroca
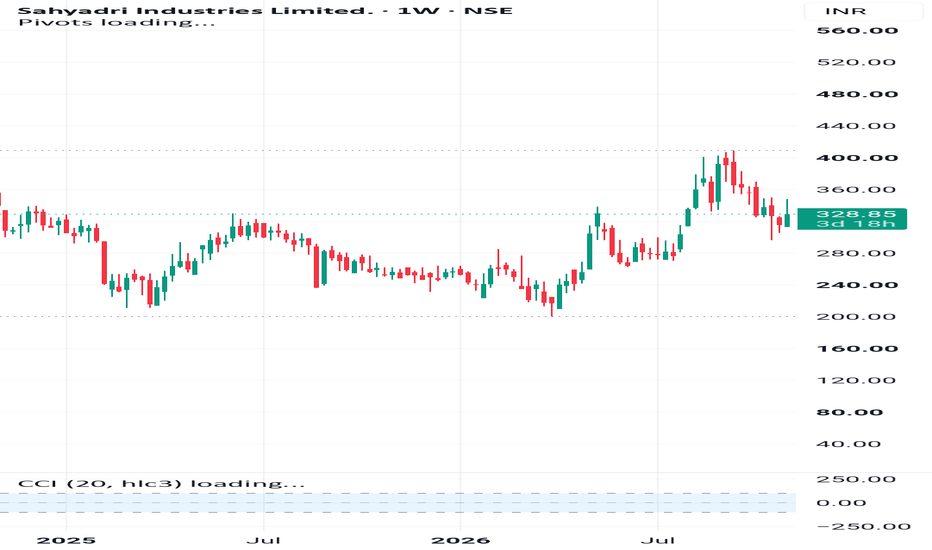
Sahyadri Industries 🔥 ₹320 BREAKOUT — ₹609 ON THE RADAR?
SAHYADRI INDUSTRIES | WEEKLY R4 BREAKOUT SETUP
NSE: SAHYADRI
📌 Buy Zone: ₹320–325
🚀 Breakout: ₹320
🛑 Stop Loss: ₹233
🎯 Target: ₹609
Risk Defined. Reward Visible.
Not a recommendation. For educational purposes only. Do your own research before investing.
© 20K MICROCAP INVESTING | R4 MOMENTUM DESK
#SahyadriIndustries #SAHYADRI #StockToWatch #BreakoutStocks #SwingTrading #IndianStocks #MomentumStocks #R4Momentum #20KMicrocapInvesting
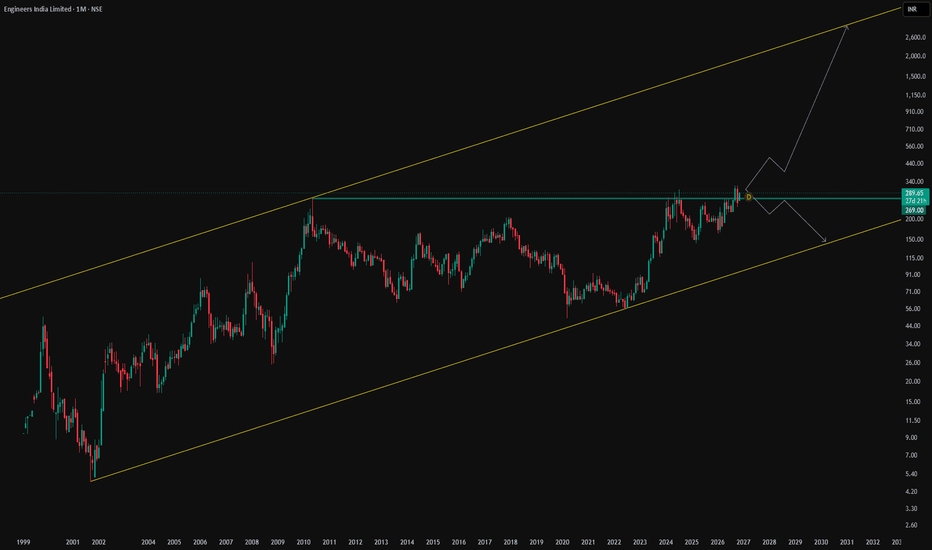
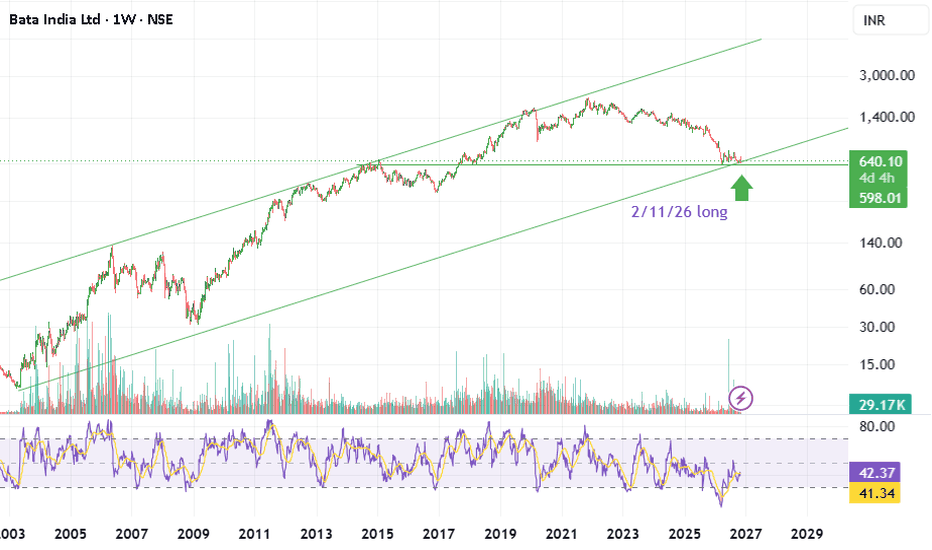
Engineers India: Long-Term Breakout PotentialEngineers India Limited appears to be approaching a significant technical inflection point on the monthly chart.
The long-term chart structure indicates a potential breakout from a multi-decade ascending channel, with the possibility of a substantial upward expansion over the coming months and years.
📈 Technical Analysis
• Multi-Decade Ascending Channel: The stock has been moving within a broad rising channel since its early trading history, indicating a long-term bullish structure.
• Major
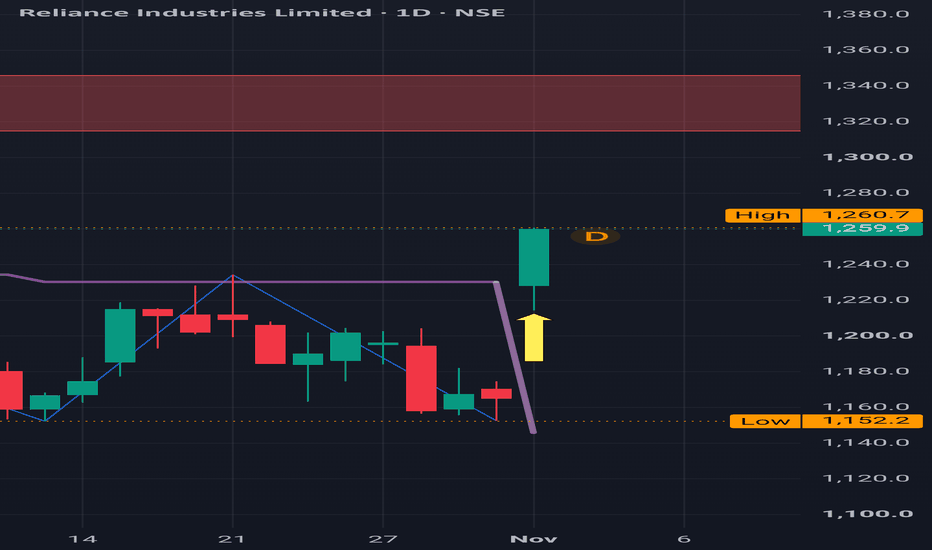
Reliance Inds: Buy Triggered Reliance Inds: Buy Triggered
Although a Buy triggered, be mindful of Major Red Band Resistances
Daily Time Frame
(This is not a buy or sell recommendation.Perform your own due diligence. The market is subject to risks. This is my personal view, and it is only for educational purposes.)
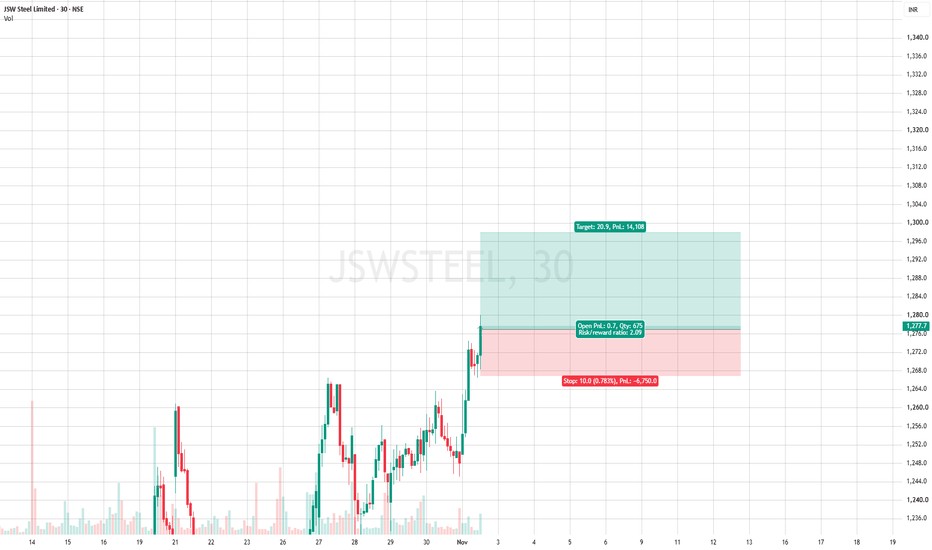
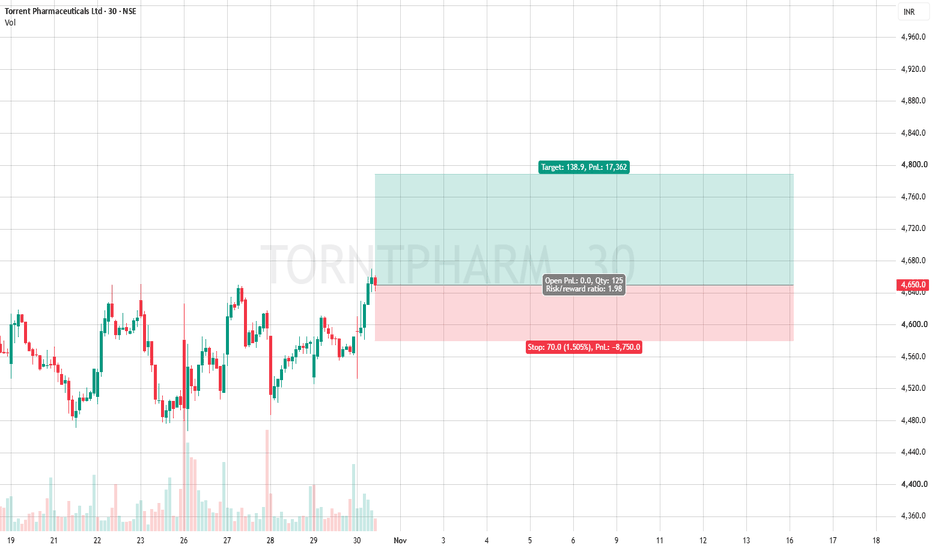
SL @ 6750 TP @ 14108Strategy Execution : Trade calls are provided based on trendline setups.
Quantity : F&O lot sizes.
Stop-Loss : Strictly follow the specified stop-loss levels. A stop-loss is considered triggered only after a 15-minute candle closes beyond the level.
Position Sizing : Limit exposure to a maximum of two open positions at a time.
Important Note : Do not risk more than 2% of your capital per trade.
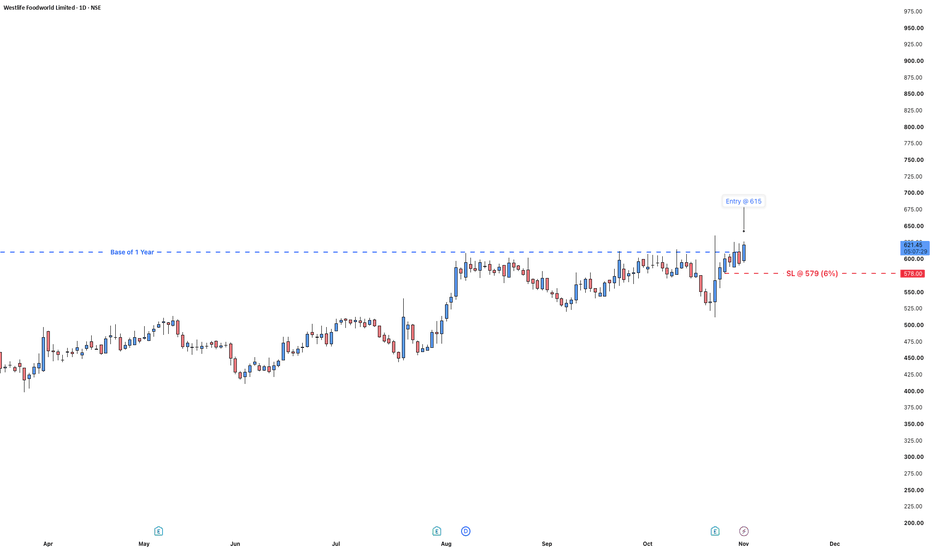
Sl @ 8750 TP @ 17362Strategy Execution : Trade calls are provided based on trendline setups.
Quantity : Determined by F&O lot sizes.
Stop-Loss : Strictly follow the specified stop-loss levels. A stop-loss is considered triggered only after a 15-minute candle closes beyond the level.
Position Sizing : Limit exposure to a maximum of two open positions at a time.
Important Note : Do not risk more than 2% of your capital per trade.
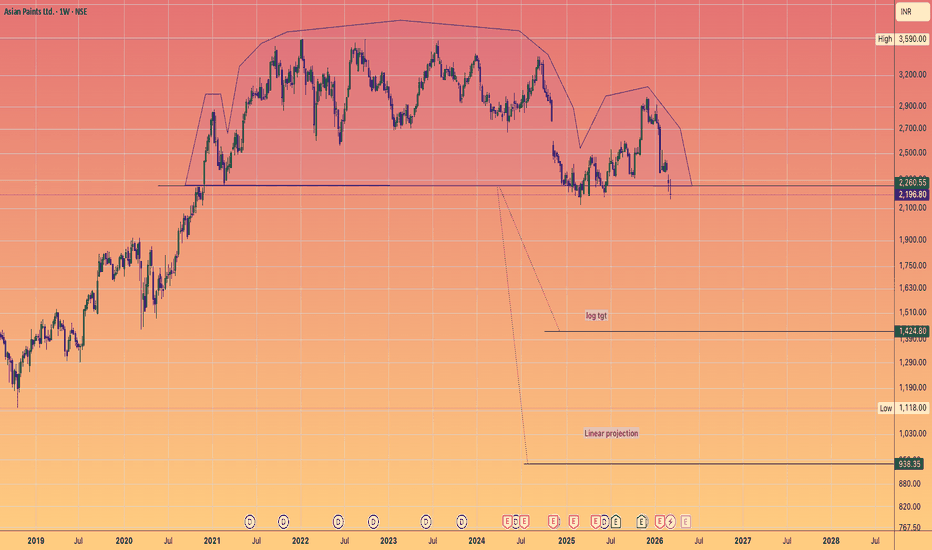
Asian Paints: Breakdown toward ₹938🎨🎨🎨
The Technical Setup: A 5-Year Head & Shoulders Top
The Neckline Snap: The crucial support zone at ₹2,700–₹2,800—which held the stock up for years—has been decisively broken.
The Breakdown: We are currently seeing a "retest and reject" move. The price is sliding down the right shoulder with increasing momentum.
The Targets: * Log Target: ₹1,424 (A massive mean-reversion move).
Linear Projection: ₹938 (The ultimate "worst-case" capitulation zone).
Why the "Paints" Narrative is Fading (B
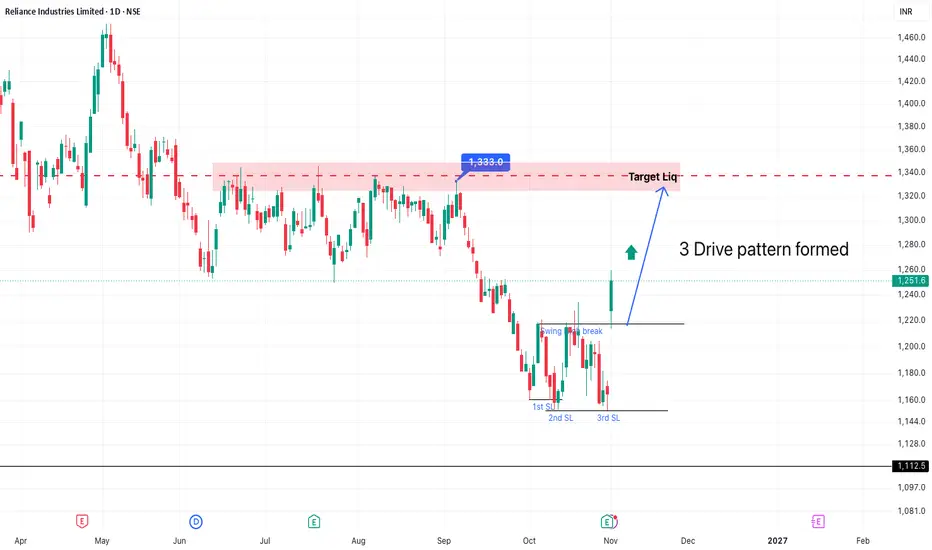
3-Drive Pattern — Harmonic Trading Strategy3-Drive Pattern — Harmonic Trading Strategy
The 3-Drive Pattern is an advanced harmonic reversal pattern used in technical analysis to identify potential trend exhaustion and reversal zones. It is based on Fibonacci ratios, symmetry, and three consecutive drives toward a final Potential Reversal Zone (PRZ).


10
1. Basic Structure
A Bullish 3-Drive looks like:
O → X → A → B → C → D
Price makes three progressively structured drives downward, with Fibonacci extensions defining each drive.
T
ABB India: Could double...⚡ 🏭 📈 🔋 🚀
1. The Macro Setup: The Hunt Volatility Funnel
Look at the weekly chart.
NSE:ABB has spent over two years carving out a massive, highly symmetrical Hunt Volatility Funnel
@TheCryptoSniper
The Compression: After hitting macro resistance near 9,027 in mid-2024, the price underwent a deep, necessary cooling-off period.
The Squeeze: Throughout 2025 and early 2026, the price action compressed significantly, trapping liquidity within narrowing boundaries.
The Breakout Trigger: We ar
Risk @ 9000 Target @ 17700Strategy Execution : Trade calls are provided based on trendline setups.
Quantity : Determined by F&O lot sizes.
Stop-Loss : Strictly follow the specified stop-loss levels. A stop-loss is considered triggered only after a 15-minute candle closes beyond the level.
Position Sizing : Limit exposure to a maximum of two open positions at a time.
Important Note : Do not risk more than 2% of your capital per trade.
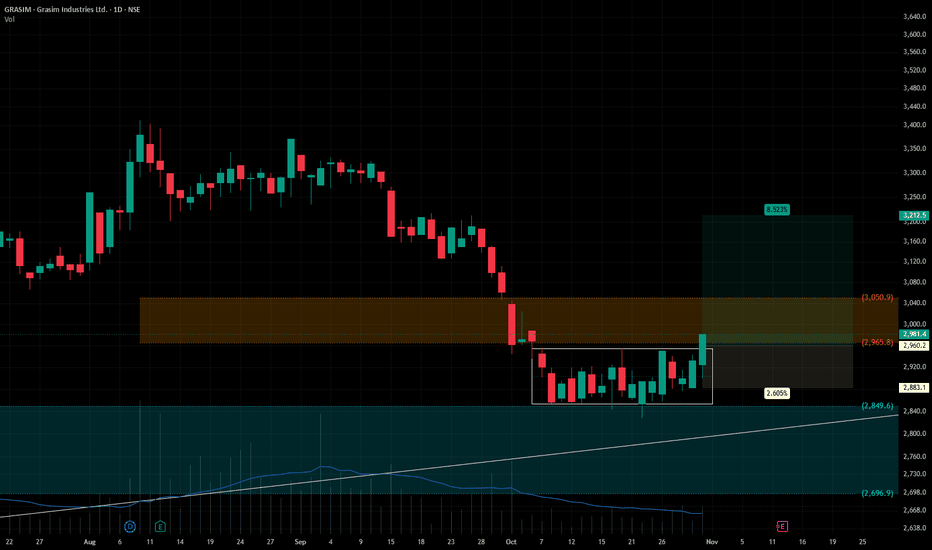
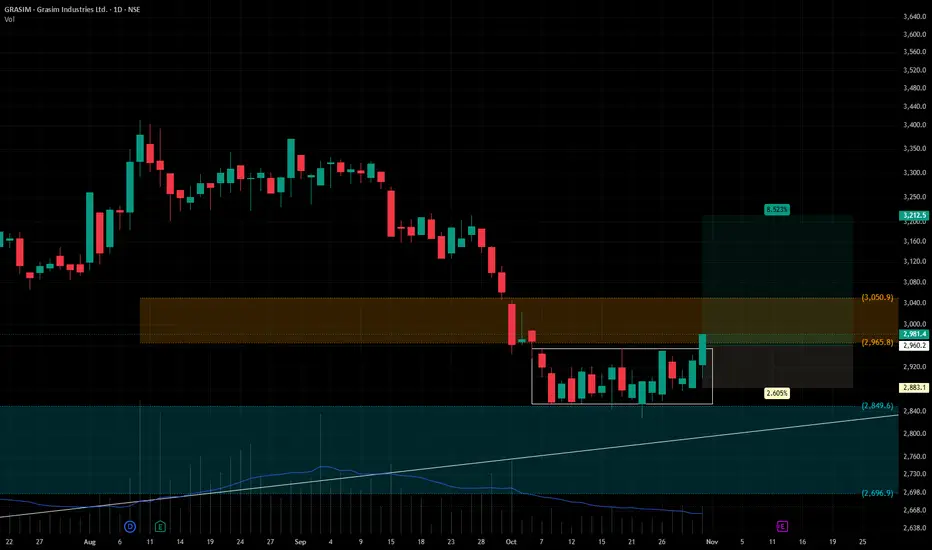
GRASIMGrasim Industries Ltd. (CMP ₹2,982.00, NSE: GRASIM)
The SmartWay Research Desk | 30 October 2026
A Mumbai‑based diversified manufacturing company, incorporated in 1947. Grasim Industries Ltd., the flagship company of the Aditya Birla Group, operates across cement, chemicals, viscose staple fibre (VSF), paints, financial services, and textiles. Through its holdings in UltraTech Cement and Aditya Birla Capital, Grasim has established itself as one of India's most diversified industrial conglo
HFCL - Understanding the price structure.HFCL | Daily Chart Analysis
Long-Term Structure Positive
Short-Term Correction
HFCL is a good example of a stock respecting a rising channel for several months.
The upper trendline is acting as supply, while the lower trendline is attracting demand.
The next opportunity could develop near the lower boundary, provided buyers defend that zone.
Remember:
In a rising channel, we don't need to chase price near resistance. The better risk-reward opportunities often develop closer to support.
📈