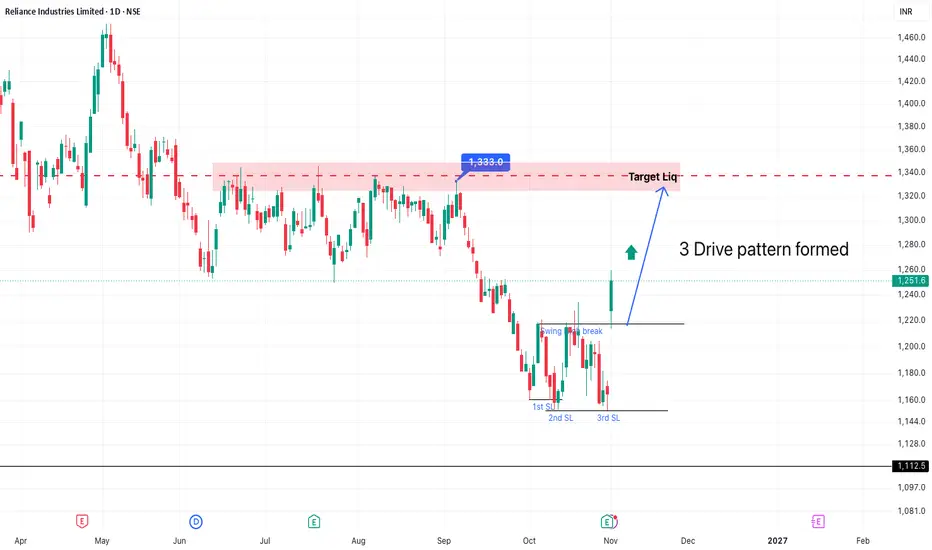
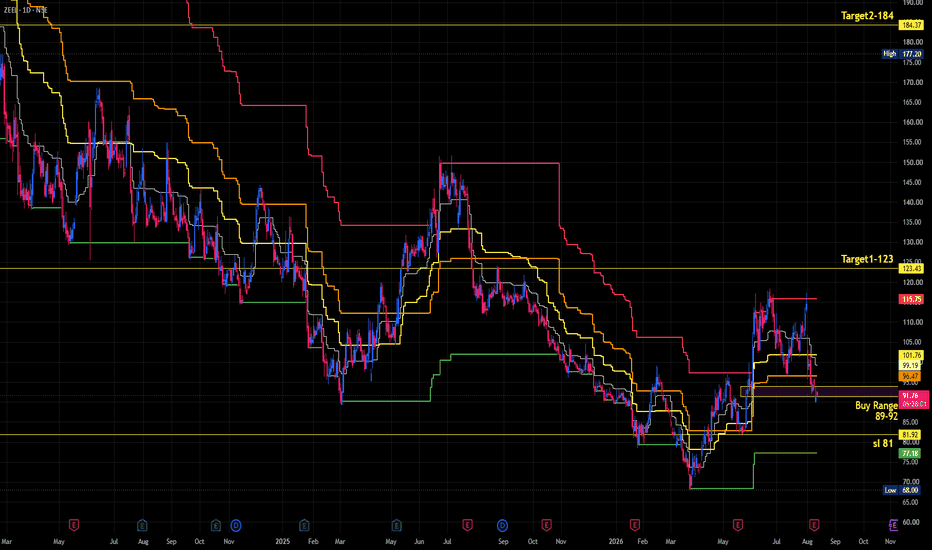
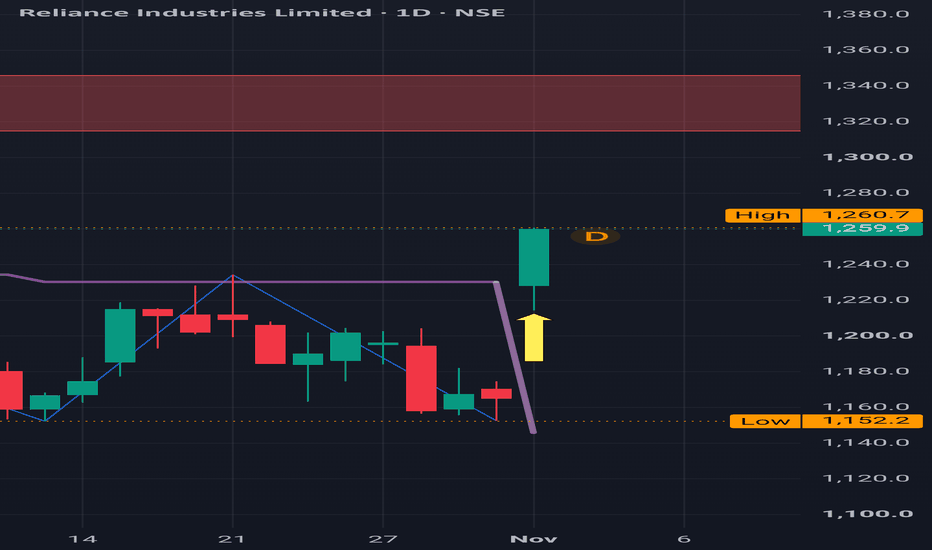
Reliance Inds: Buy Triggered Reliance Inds: Buy Triggered
Although a Buy triggered, be mindful of Major Red Band Resistances
Daily Time Frame
(This is not a buy or sell recommendation.Perform your own due diligence. The market is subject to risks. This is my personal view, and it is only for educational purposes.)
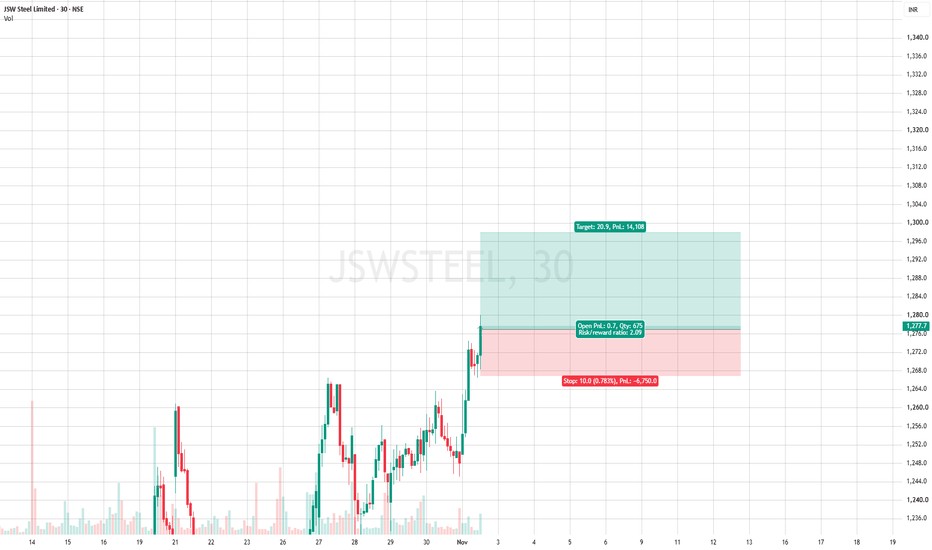
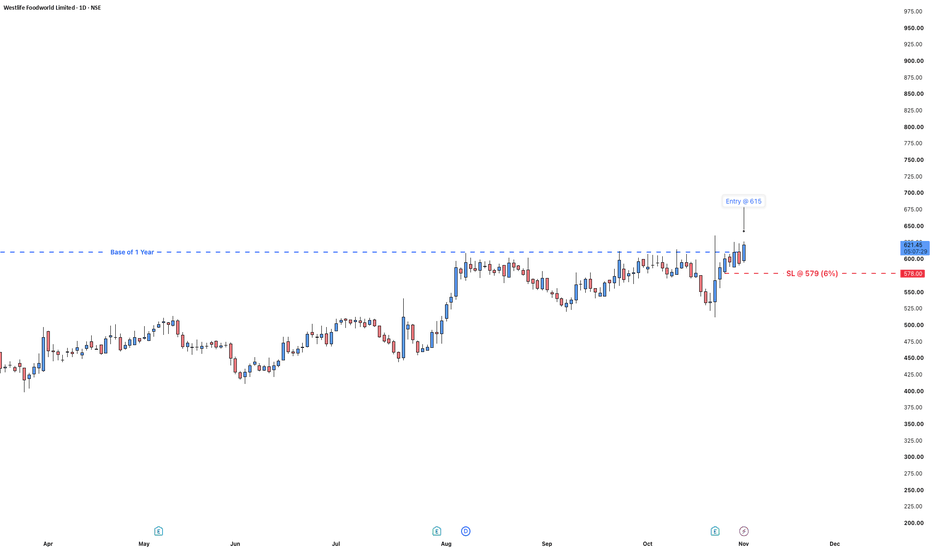
SL @ 6750 TP @ 14108Strategy Execution : Trade calls are provided based on trendline setups.
Quantity : F&O lot sizes.
Stop-Loss : Strictly follow the specified stop-loss levels. A stop-loss is considered triggered only after a 15-minute candle closes beyond the level.
Position Sizing : Limit exposure to a maximum of two open positions at a time.
Important Note : Do not risk more than 2% of your capital per trade.
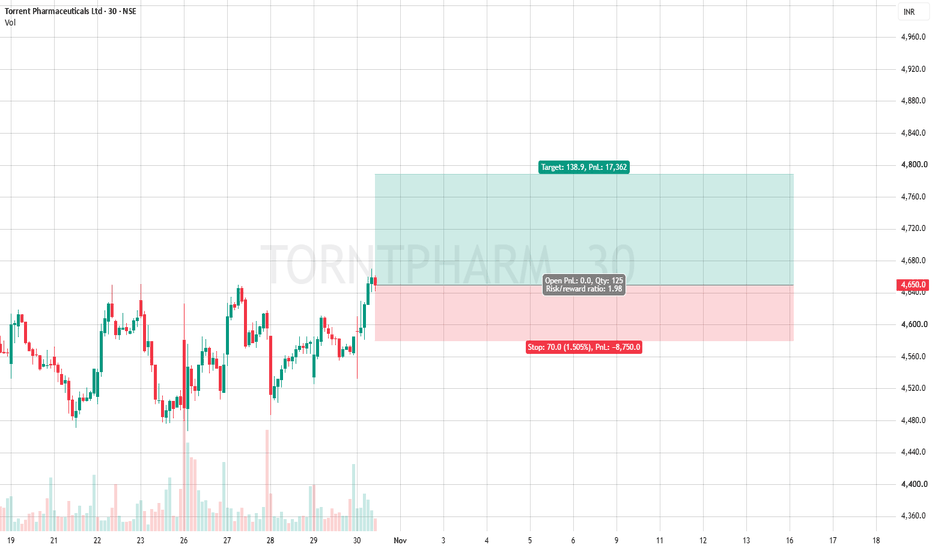
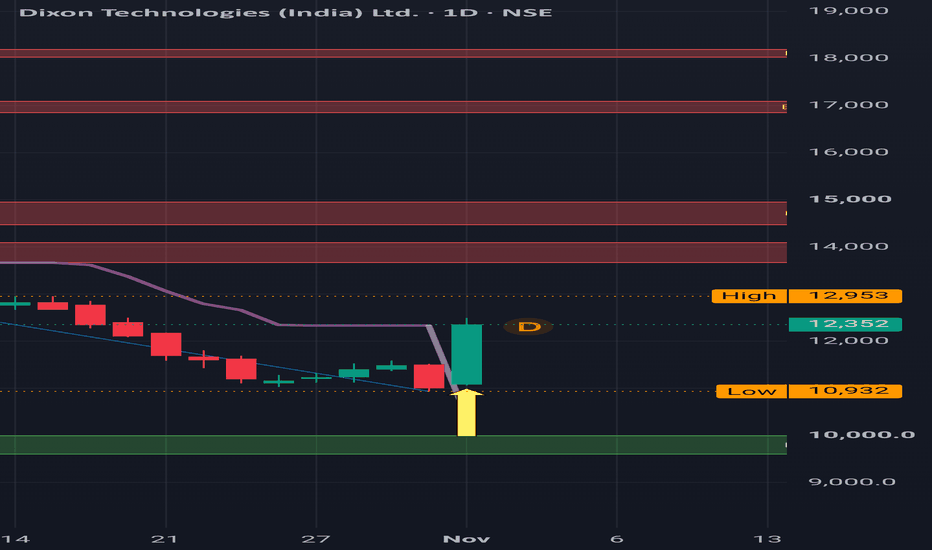
Sl @ 8750 TP @ 17362Strategy Execution : Trade calls are provided based on trendline setups.
Quantity : Determined by F&O lot sizes.
Stop-Loss : Strictly follow the specified stop-loss levels. A stop-loss is considered triggered only after a 15-minute candle closes beyond the level.
Position Sizing : Limit exposure to a maximum of two open positions at a time.
Important Note : Do not risk more than 2% of your capital per trade.
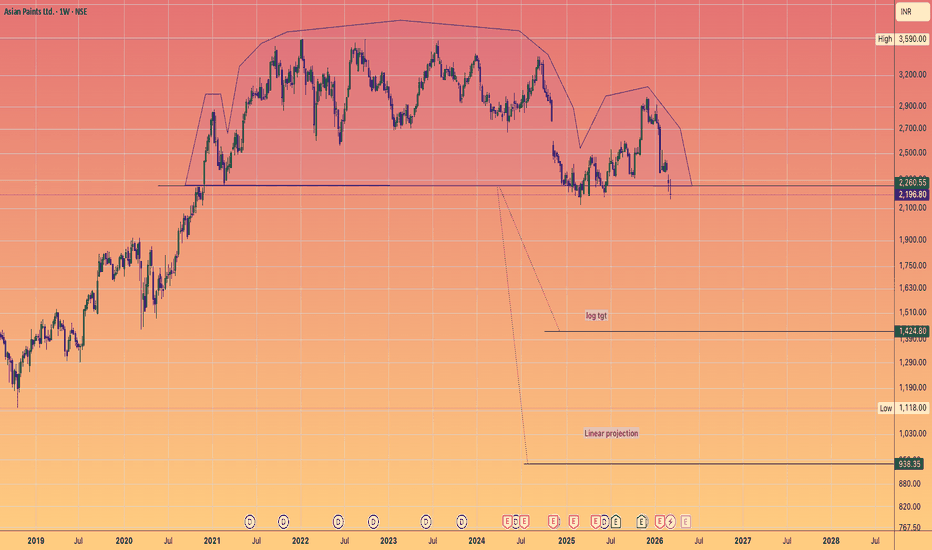
Asian Paints: Breakdown toward ₹938🎨🎨🎨
The Technical Setup: A 5-Year Head & Shoulders Top
The Neckline Snap: The crucial support zone at ₹2,700–₹2,800—which held the stock up for years—has been decisively broken.
The Breakdown: We are currently seeing a "retest and reject" move. The price is sliding down the right shoulder with increasing momentum.
The Targets: * Log Target: ₹1,424 (A massive mean-reversion move).
Linear Projection: ₹938 (The ultimate "worst-case" capitulation zone).
Why the "Paints" Narrative is Fading (B
3-Drive Pattern — Harmonic Trading Strategy3-Drive Pattern — Harmonic Trading Strategy
The 3-Drive Pattern is an advanced harmonic reversal pattern used in technical analysis to identify potential trend exhaustion and reversal zones. It is based on Fibonacci ratios, symmetry, and three consecutive drives toward a final Potential Reversal Zone (PRZ).


10
1. Basic Structure
A Bullish 3-Drive looks like:
O → X → A → B → C → D
Price makes three progressively structured drives downward, with Fibonacci extensions defining each drive.
T
ABB India: Could double...⚡ 🏭 📈 🔋 🚀
1. The Macro Setup: The Hunt Volatility Funnel
Look at the weekly chart.
NSE:ABB has spent over two years carving out a massive, highly symmetrical Hunt Volatility Funnel
@TheCryptoSniper
The Compression: After hitting macro resistance near 9,027 in mid-2024, the price underwent a deep, necessary cooling-off period.
The Squeeze: Throughout 2025 and early 2026, the price action compressed significantly, trapping liquidity within narrowing boundaries.
The Breakout Trigger: We ar
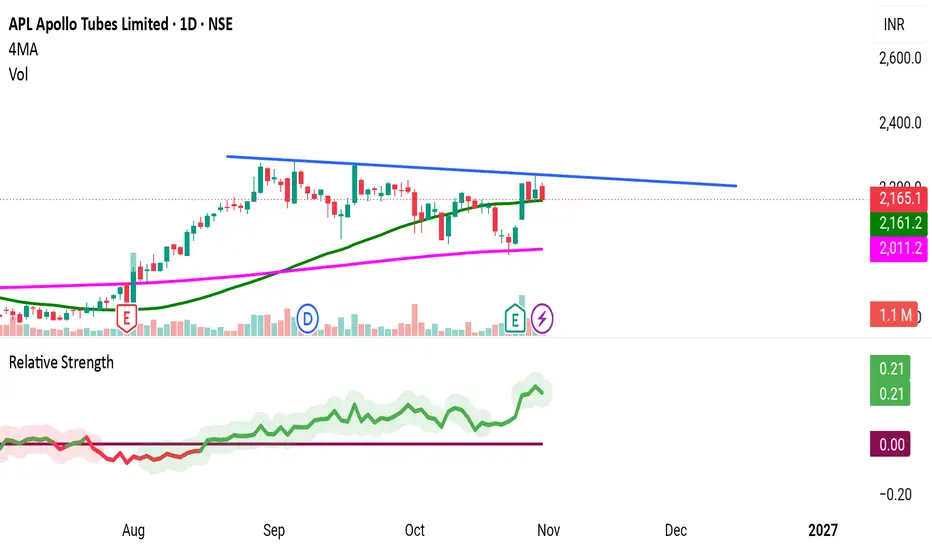
Risk @ 9000 Target @ 17700Strategy Execution : Trade calls are provided based on trendline setups.
Quantity : Determined by F&O lot sizes.
Stop-Loss : Strictly follow the specified stop-loss levels. A stop-loss is considered triggered only after a 15-minute candle closes beyond the level.
Position Sizing : Limit exposure to a maximum of two open positions at a time.
Important Note : Do not risk more than 2% of your capital per trade.
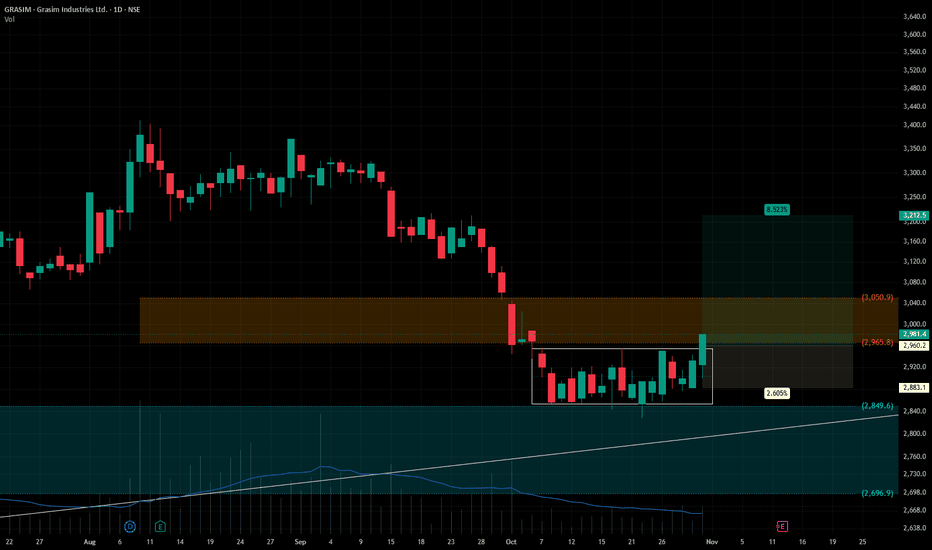
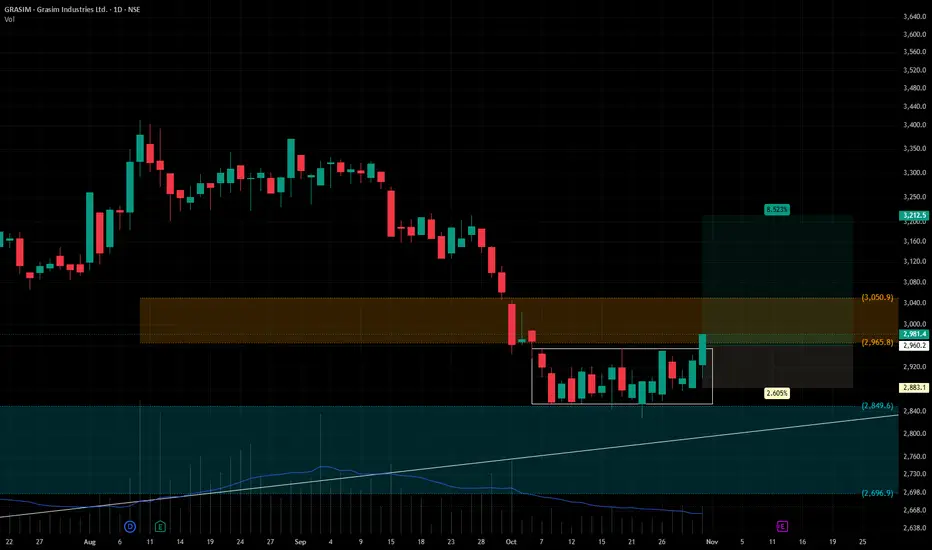
GRASIMGrasim Industries Ltd. (CMP ₹2,982.00, NSE: GRASIM)
The SmartWay Research Desk | 30 October 2026
A Mumbai‑based diversified manufacturing company, incorporated in 1947. Grasim Industries Ltd., the flagship company of the Aditya Birla Group, operates across cement, chemicals, viscose staple fibre (VSF), paints, financial services, and textiles. Through its holdings in UltraTech Cement and Aditya Birla Capital, Grasim has established itself as one of India's most diversified industrial conglo
HFCL - Understanding the price structure.HFCL | Daily Chart Analysis
Long-Term Structure Positive
Short-Term Correction
HFCL is a good example of a stock respecting a rising channel for several months.
The upper trendline is acting as supply, while the lower trendline is attracting demand.
The next opportunity could develop near the lower boundary, provided buyers defend that zone.
Remember:
In a rising channel, we don't need to chase price near resistance. The better risk-reward opportunities often develop closer to support.
📈
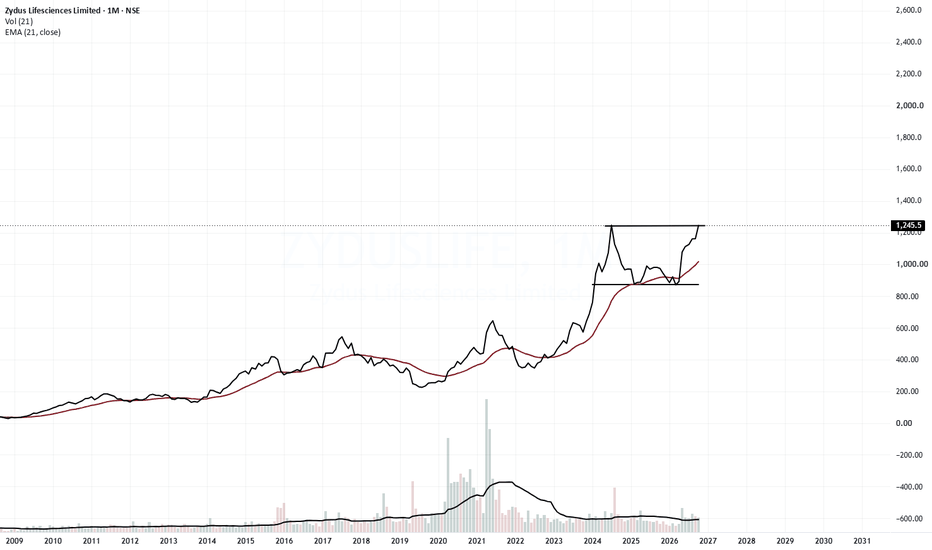
Another Pharma stock near breakoutZydus Lifesciences is another gem from Pharma sector ready for next round of bull run.
Stock is ready for the monthly breakout. It is also making 52 week high as well and heading for all time high.
Stock's volume and delivery quantity both are increasing.
Stock is outperforming the broader index, almost up 40% in last 6 months.
Pharma sector is already outperforming the broader index by huge margin.
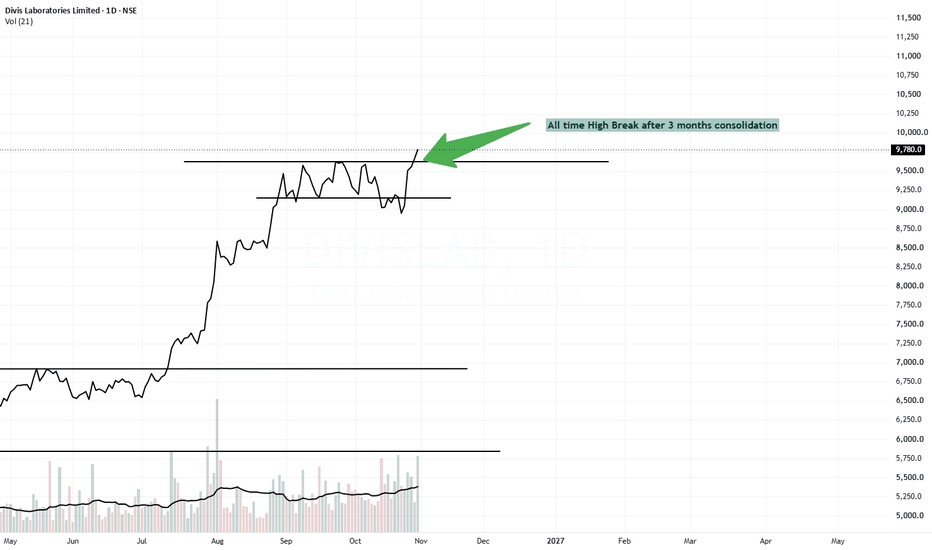
Divis Labs Breaking all time highDivis Labs is a very interesting chart again. Very clean moves.
Breaking out of the range after consolidating for almost 3 months.
Stock is about to make a new all time high.
Pharma sector is in a very good momentum. So if we choose a stock in the trending sector then the chances of winning is high.
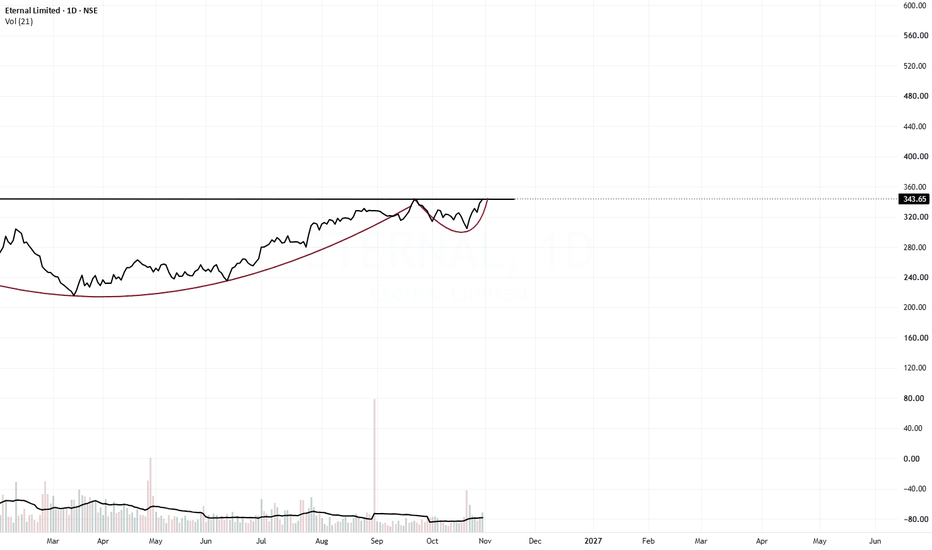
Eternal - Cup and Handle Check out the interesting Cup and Handle formation in the Eternal.
Eternal is clearly winning the rivalry between Swiggy and Zomato. Their result is better.
Now the stock is near the all time high breakout and forming interesting cup and handle pattern.
Chart is technically looking very very strong. Fundamentally the company's latest quarter result was good as well.
Since overall market structure is not favorable need to be very careful.
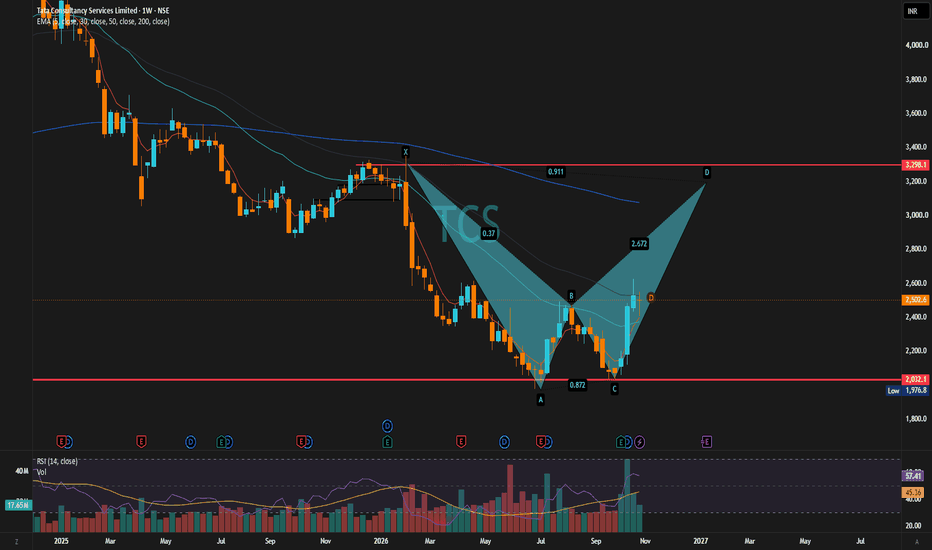
TCS Butterfly Pattern Completed - D Point 3298 Target LockedTCS - BULLISH BUTTERFLY - D POINT TARGET 3298 🦋
Pattern: Bullish Deep Crab on Weekly
Status: C to D Leg Started
Entry: 2502 CMP
Add: 2350-2400 Dip
SL: 1976 WCB (2022 Low)
Target: 3298 (D Point)
Logic:
- Double Bottom at 2022 Low
- 40M Volume - 2Y Highest
- 5EMA Cross 30EMA
- RSI 57 - Bullish
T1 2700 | T2 3000 | T3 3298 = D POINT
SL hit to pattern fail.
Disclaimer: Not financial advice. For educational purpose only. Do your own research. I am not SEBI registered.
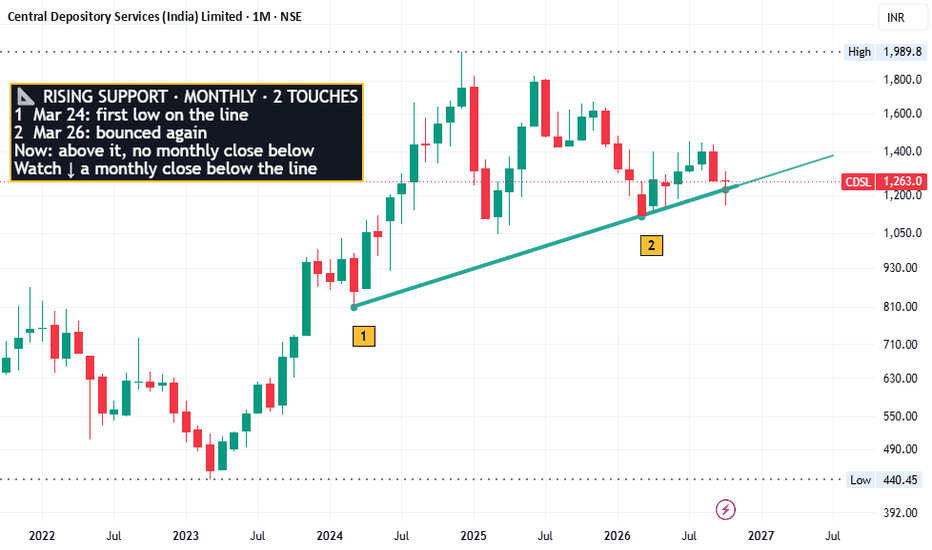
CDSL 1M: 2nd Touch of a Rising Support LineA rising support line on the monthly chart of CDSL, found by an automated trendline scan from the swing highs and lows.
Reading the chart
Rising support line: 2 touches the candles confirm, 1 Mar 24 to 2 Mar 26.
No monthly close through the line since the first touch; a close within a hair of it is not counted.
The 1 Mar 24 touch, the one old enough to count, held for ten monthly candles.
Newest closed candle (1 Oct 26): closed right at the support line.
What to watch next
While
SHRIRAMFIN 3D: 2nd Touch of a Rising Support Line SHRIRAMFIN on the 3-day chart. The lines come from an automated trendline scan, drawn through the chart's own swing highs and lows on a log price scale.
Reading the chart
2 confirmed touches on a rising support line between 23 Oct 23 and 16 Jan 25.
Closed below the line once earlier, the last on 25 Aug 25; no 3-day close through it in the last 30 candles.
Of the 2 earlier touches old enough to count, 2 held for ten 3-day candles and 0 gave way within ten.
Newest closed candle (27 Oct 26
BAJAJFINSV 1W: 3rd Touch of a Rising Support Line BAJAJFINSV on the weekly chart. The lines come from an automated trendline scan, drawn through the chart's own swing highs and lows on a log price scale.
On the chart
The rising support line has been touched 3 times, first on 12 Aug 24, last on 26 Oct 26.
No weekly close through the line since the first touch; a close within a hair of it is not counted.
Of the 2 earlier touches old enough to count, 2 held for ten weekly candles and 0 gave way within ten.
The latest touch is under a mont