SHK | 5-Month Symmetrical Triangle Breakout with Record VolumeBias: Bullish
S H Kelkar and Company is breaking out of a completed Symmetrical Triangle on the daily timeframe with a strong +8.81% candle backed by exceptional volume — one of the highest volume spikes on the entire chart.
Pattern Structure:
• Upper Trendline (Descending): Connecting lower highs from Feb 2026, acting as overhead resistance throughout the consolidation
• Lower Trendline (Ascending): Connecting higher lows from Feb 2026, acting as support and showing buyers stepping in at progressively higher levels
• Symmetrical Triangle: Formed over ~5 months (Feb – Jul 2026), price consolidating in a tightening range as the two trendlines converge toward the apex
• Breakout: Price breaking above the descending trendline today, exiting the triangle to the upside
Two reasons for strong bullish bias:
1. Symmetrical triangle breakout — both trendlines clearly defined, pattern complete, breakout to the upside from a tight consolidation typically precedes strong moves
2. Volume confirmation — today's volume is exceptional, among the highest on the entire chart, signalling strong institutional participation and conviction on the breakout
Trade Parameters:
• Entry: Current levels (~₹140-145) or on a retest of the upper trendline
• Target 1: ₹155.00
• Target 2: ₹177.77
• Stop Loss: ₹126.20 (ascending trendline support)
• Trade Duration: 4 – 8 weeks
Invalidation:
Daily close below ₹126.20 invalidates the setup.
For educational purposes only. Not financial advice.
#SHKelkar #SHKL #NSE #SymmetricalTriangle #VolumeConfirmation #TechnicalAnalysis #SwingTrading #IndianStockMarket #Education #TradingView
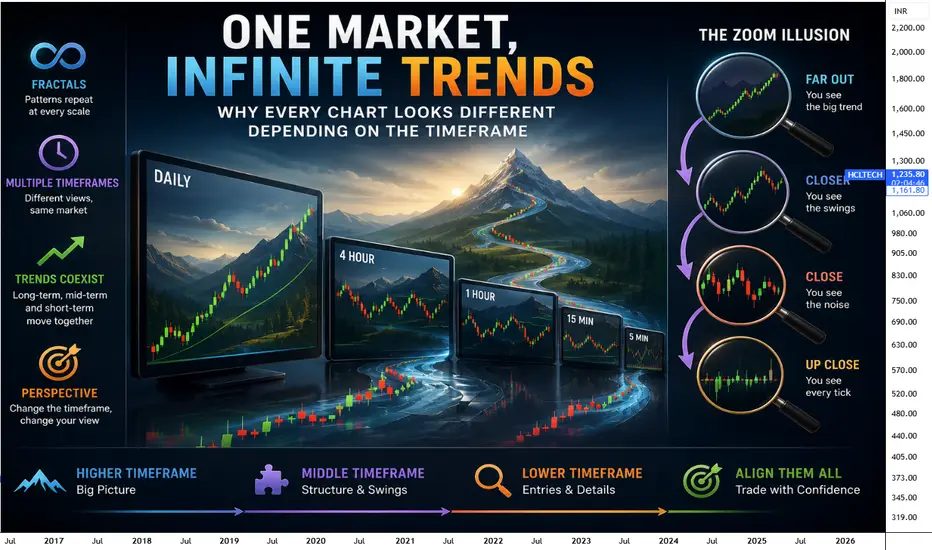
One Market, Infinite TrendsHave you ever noticed something strange while looking at charts? You open the 5-minute timeframe and see a strong uptrend. Then you switch to the 1-hour chart, and the market suddenly looks like it is moving sideways. Move to the daily timeframe, and now it looks like a downtrend. The obvious question is, which one is correct?
The surprising answer is that they are all correct. The market does not have just one trend. It has many trends happening at the same time. Understanding this simple idea can completely change the way you read charts and explain why experienced traders rarely rely on only one timeframe.
Every Timeframe Tells a Different Story
Think of standing in front of a mountain. If you stand very close, you only see rocks, trees, and small details. As you move farther away, you begin to see the entire mountain. Neither view is wrong. You are simply looking at the same object from a different distance.
Charts work the same way. A lower timeframe shows every small battle between buyers and sellers. A higher timeframe hides that noise and reveals the bigger picture. The market has not changed. Only your perspective has.
The Market Is Fractal:
One of the most fascinating characteristics of financial markets is their fractal nature. This means similar patterns repeat themselves across different timeframes.
A breakout on the 5-minute chart may look almost identical to a breakout on the daily chart. Trends, pullbacks, consolidations, and reversals appear everywhere, whether you are looking at one minute or one month.
It is like zooming into the branches of a tree. Every branch looks similar to the whole tree. The pattern repeats itself at different sizes.
This is why traders can use many of the same price action concepts on almost any timeframe.
Why Trends Can Coexist?
Many beginners believe there can only be one trend at a time. In reality, several trends can exist together without contradicting each other.
Imagine climbing a staircase.
Each step moves upward.
At the same time, you may walk slightly left or right while climbing.
From close up, your movement looks different.
From a distance, everyone can clearly see you are moving upstairs.
The market behaves in a similar way.
The daily chart may be in a strong uptrend.
Inside that uptrend, the 1-hour chart may show a temporary pullback.
Within that pullback, the 5-minute chart may even have its own short-term uptrend.
Each timeframe is simply showing a smaller part of the bigger picture.
The Zoom Illusion
Imagine opening Google Maps.
At the highest zoom level, you can see your entire country.
Zoom in, and you only see your city.
Zoom in again, and you see individual streets.
Finally, you see a single building.
Nothing has changed except your level of zoom.
Charts work exactly the same way.
Changing timeframes is simply changing your zoom level.
The market itself remains exactly the same.
Which Timeframe Is the Best?
This is one of the most common questions traders ask.
The truth is that no timeframe is better than another.
A scalper may only care about the 1-minute chart.
A swing trader may focus on the 4-hour and daily charts.
A long-term investor may rarely look below the weekly timeframe.
The best timeframe is the one that matches your trading style.
Instead of searching for the "perfect" timeframe, successful traders learn how different timeframes work together.
The Bigger Picture Always Matters
Imagine reading a single sentence from a book without knowing the rest of the story. It is easy to misunderstand its meaning.
The same happens in trading.
Looking at only one timeframe can hide important information. A perfect buy setup on the 15-minute chart might actually be trading directly into a strong resistance level visible on the daily chart.
This is why experienced traders often begin with higher timeframes to understand the overall market direction before moving to lower timeframes to fine-tune their entries.
My Thoughts
The market does not change when you switch timeframes; only your perspective changes. Every timeframe reveals a different layer of the same story. Lower timeframes show the details, higher timeframes reveal the bigger picture, and together they create a complete view of the market.
The next time you see two charts showing different trends, remember this simple idea.
by @BrightRally_Research on @TradingView
KARURVYSYA: Symmetrical Triangle Breakout ConfirmedKARURVYSYA Bank – Breakout Update
Symmetrical Triangle breakout confirmed with strong volume.
Pattern Support: ₹285–₹300
Major Support: ₹270
Upside Target: ₹372
Bullish structure remains intact above the breakout zone.
Any dip near support may offer a better risk-reward buying opportunity.
thank you !!
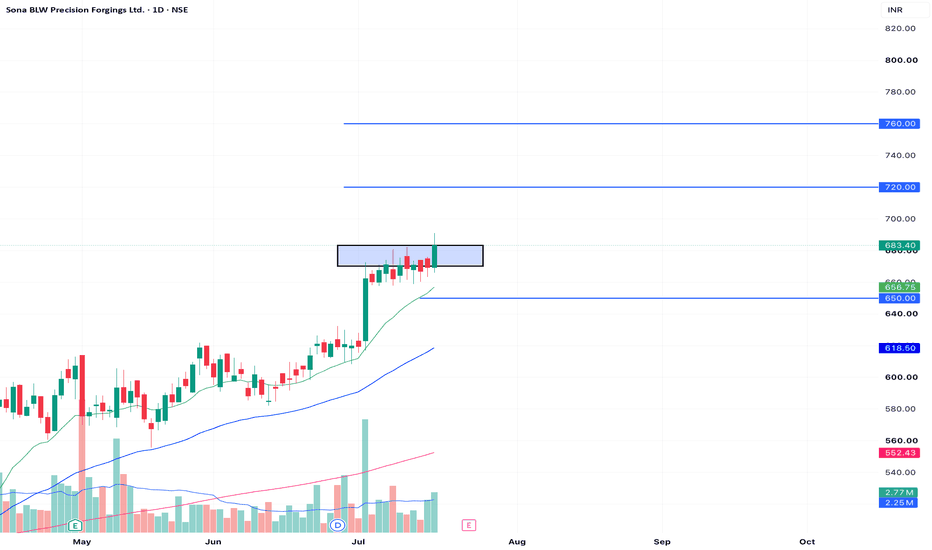
1H High-Level Consolidation Box Nearing Top Range Breakout📊 Sona BLW Precision Forgings Ltd. (SONACOMS) - 1-Hour (1H) Chart Analysis
This post is shared for EDUCATIONAL PURPOSES ONLY to analyze range bound consolidation, moving average alignment, and breakout continuation setups. It is not financial or investment advice.
🟢 Technical Observations:
1. High-Level Range Consolidation: On the 1H timeframe, SONACOMS is consolidating in a high-level horizontal box between 650.00 and 685.00 following a powerful upward surge from the 580 base.
2. Pressure Near Range Highs: The price is currently trading strong at 683.40 (+2.12%), repeatedly testing the upper resistance ceiling of the box around 684.00–685.00. A clean hourly close above this barrier signals the next expansion phase.
3. EMA Dynamic Support: The shorter-term EMAs (green line at 675.96 and blue line at 668.68) are sloping upward and acting as dynamic dynamic support, lifting the price into the upper resistance band.
4. Macro Trend Alignment: The price remains comfortably above the pink long-term moving average baseline (638.44), maintaining a firm bullish macro structure.
🎯 Educational Swing Setup:
• Entry Zone: 670.00 – 683.40 (Accumulating near current levels on intraday consolidations, or executing on a confirmed hourly close above 685.00).
• Target 1: 720.00 (Near-term structural target)
• Target 2: 760.00 (Extended swing expansion target)
• Invalidation / Stop-Loss: 650.00 (An hourly candle close back below the lower boundary of the consolidation box and the blue EMA invalidates this short-term breakout thesis).
• Expected Duration: 4 to 10 Trading Days (Short-term hourly swing view)
⚠️ Risk Management:
Since the price is testing the top of its range, look out for volume expansion on the hourly breakout candle to confirm institutional participation. Maintain disciplined position sizing!
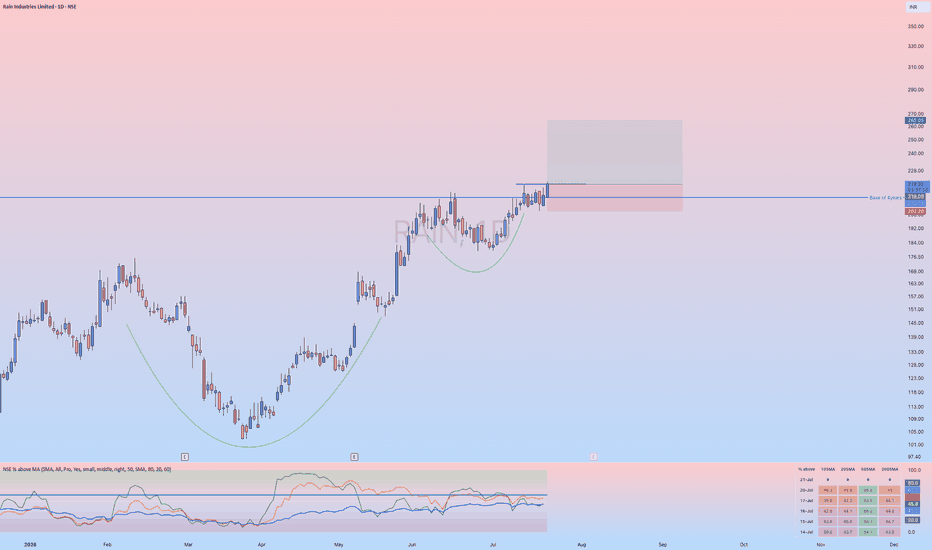
Rain Industries - 4Years Base BreakoutBase breakout of 4years
Fundamental Analysis
Stock has EPS growth and Sales growth.
Accummulation by big players.
Market mood is currently uptrend under pressure
Coming out of major base of 4years, currently consolidating near the resistance.
Liqudity is 8M on average traded volumes.
Price>55>200 SMA and rising slope
Swings are contracting inside base
No major signs of seeling visible from no major red candles or selling volumes.
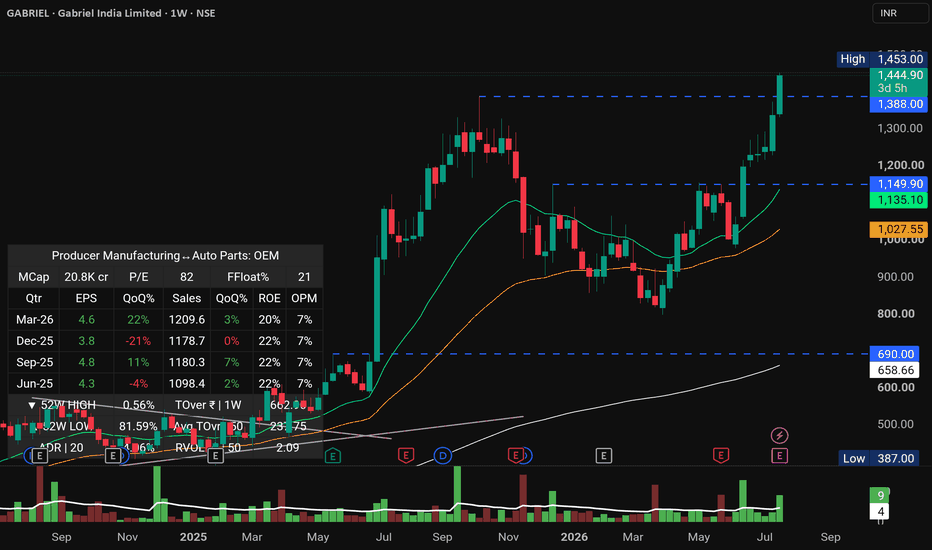
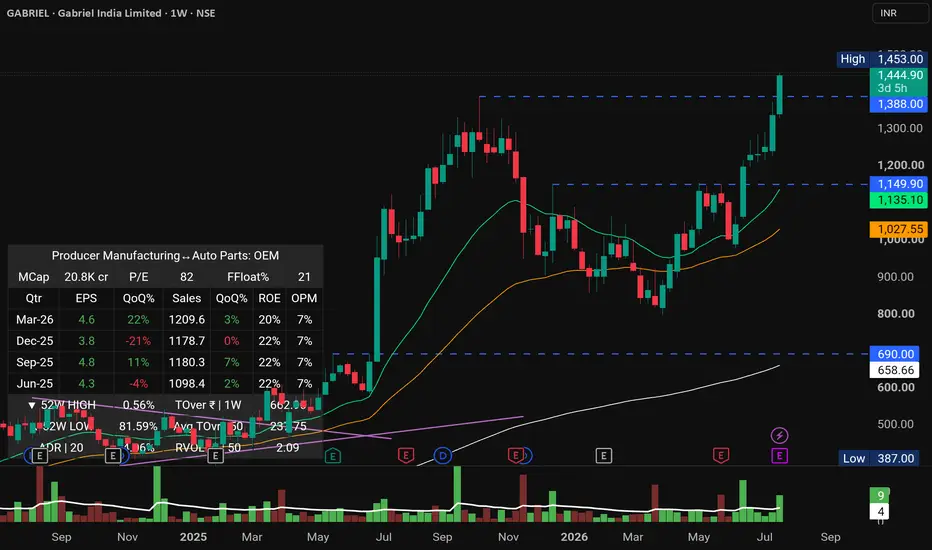
GABRIELGabriel India is part of ANAND Group. The Company has established a significant presence across all automotive customer segments, including OEMs, Aftermarket, and exports. Company manufactures over 500 models of ride control products. Its products include shock absorbers, struts, front forks and others.
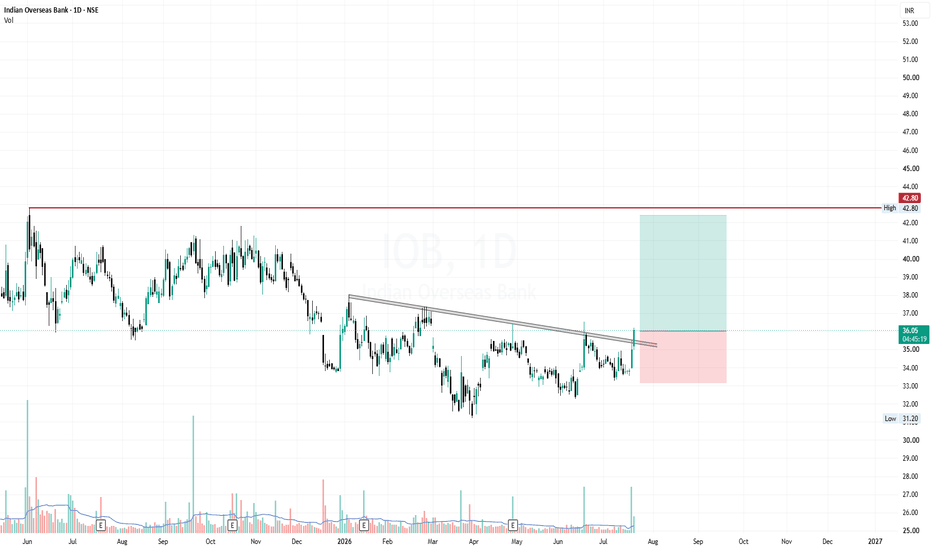
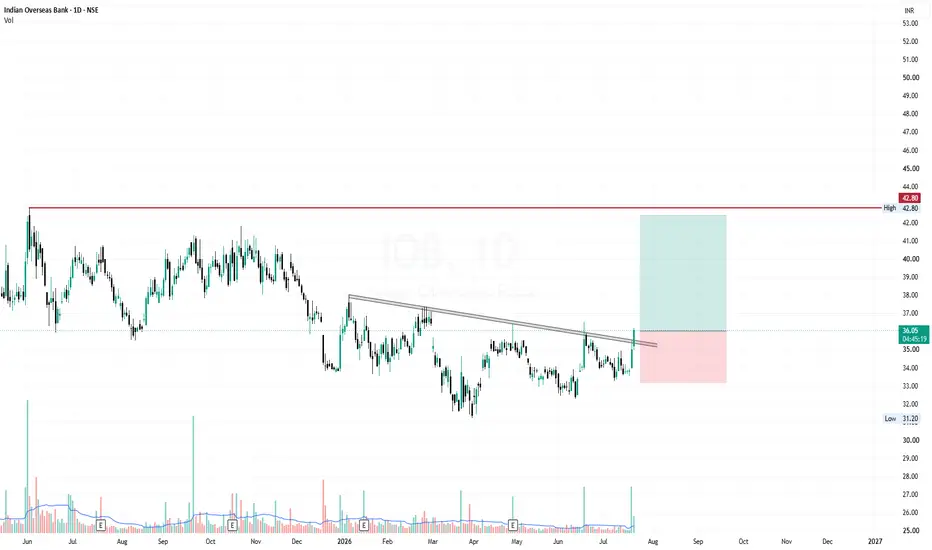
IOB | Buy @36 | Strict SL below 33 | 1st Target 42*********************************************************************
The stock market involves risk, risk, and only risk. To survive in the market, accepting stop-loss with discipline and without hesitation. There is no other way to protect you capital.
Any stock I share is either already part of my existing holding or I take a fresh entry at the same level I mention. I always place the stop-loss in my system at the time of buying, and I give the highest importance to stop-loss more than the target. Once the target is achieved, I usually book profit once and then wait for either a retest or a fresh breakout.
Disclaimer (Please Read Carefully):
This is not investment advice. The stocks shared here are purely for educational and informational purposes. Please do your own research or consult with a financial advisor before making any investment decisions.
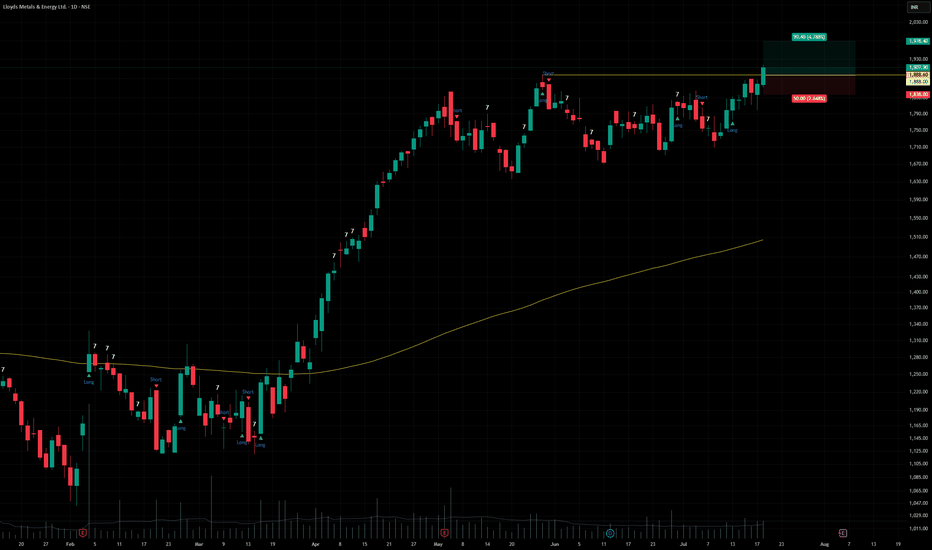
LLOYDSMELloyds Metals & Energy Ltd. (CMP ₹1,907.00, NSE: LLOYDSME)
The SmartWay Research Desk | 21 July 2026
A Nagpur‑based iron ore mining and sponge iron company, incorporated in 1979. Lloyds Metals & Energy operates across iron ore mining, sponge iron, power generation, and steel manufacturing, with strong presence in Maharashtra and expansion into downstream steel products.
Promoter Holding (Mar 2026): Gupta Family — 74.95% stake (no pledges)
FY22–FY26 Snapshot
Revenue Growth: FY26 revenue ₹6,842 Cr vs ₹5,912 Cr in FY25 (+15.7% YoY). → Good
Net Profit: FY26 PAT ₹1,212 Cr vs ₹1,042 Cr in FY25 (+16.3% YoY). → Good
Operating Margin: FY26 EBITDA ₹2,012 Cr, margin 29.4% vs 28.6% last year (+80 bps). → Good
Equity Capital: Stable, face value ₹1. → Good
Dividend Policy: Dividend ₹5.00/share declared for FY26. → Good
Asset Building: Investments in steel plant expansion and captive power projects. → Good
Sales: Strong demand from iron ore mining and sponge iron supply. → Good
Expense: Raw material and power costs remain volatile. → Neutral/Good
EPS: FY26 EPS ₹38.25 vs ₹32.90 last year (+16.2%). → Good
Institutional Interest & Ownership Trends (Mar 2026)
Promoter Holding: 74.95% (no pledges)
FII Holding: 6.12%
DII Holding: 10.34%
Retail & Others: 8.59%
Strategic Moves & Innovations
Expansion in iron ore mining capacity in Gadchiroli.
Focus on integrated steel plant development.
Partnerships with state utilities for captive power supply.
Diversification into downstream steel products and alloys.
Cash Flow & Balance Sheet Strength
Market cap ~₹45,800 Cr.
Debt‑to‑equity ratio ~0.38 (moderate leverage).
Book value per share ₹182.40; P/B ~10.5.
EPS (TTM) ₹38.25; P/E ~49.8.
Risk Factors
High P/E ratio ~49.8, indicating premium valuations.
Dependence on iron ore mining approvals and commodity cycles.
Exposure to steel price volatility.
Competition from JSW Steel, Tata Steel, and SAIL.
Investor Takeaway
Lloyds Metals & Energy has delivered robust FY26 performance, supported by iron ore mining expansion, sponge iron demand, and steel plant investments. With strong promoter backing, dividend payouts, and integrated growth strategy, Lloyds remains a premium mid‑cap steel & mining play. At CMP ₹1,907.00, valuations are expensive (P/E ~49.8, P/B ~10.5), reflecting growth expectations but also sectoral risks.
TMPV | Downtrend Intact — Liquidity Below
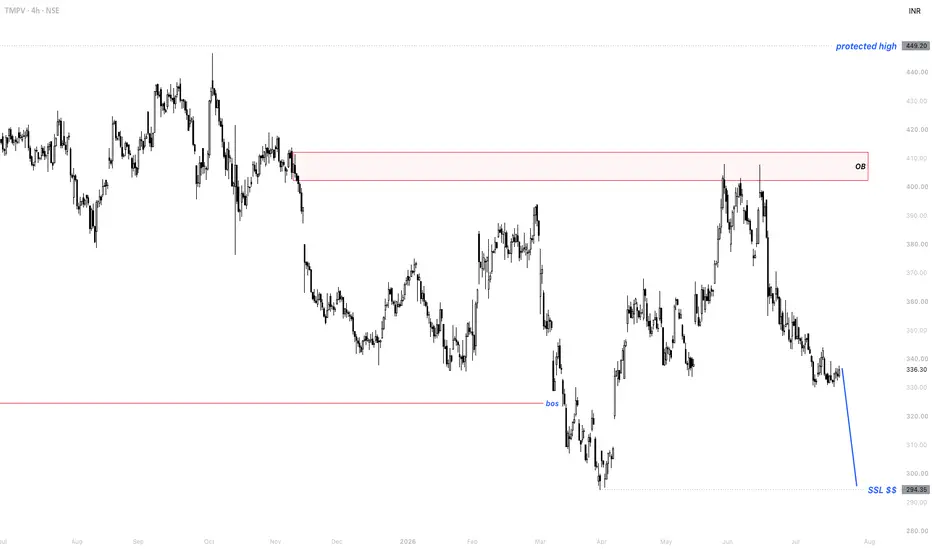
By analyzing the 🇮🇳 #TMPV (Tata Motors Passenger Vehicles) chart on the 4H timeframe, we can see that the stock remains firmly within a downtrend. Every corrective rally has been sold, and the most recent bounce into supply just gave sellers their next opportunity to press price toward the liquidity below.
📊 4H Timeframe
On the 4H, the structure is clearly bearish — price has been printing bearish BOS after bearish BOS on the way down. The most recent corrective rally carried price back up into the Order Block ( ₹402 – ₹412 region), a deep pullback into supply — and price rejected right from it, rolling over immediately exactly as a bearish OB should behave.
With price now trading around ₹336.30 , the draw is clearly to the downside. Below sits the sell-side liquidity (SSL) at ₹294.35 — the weak low that price is being pulled toward. My expectation is a continuation lower to run that liquidity, since it represents the unprotected low the market wants to sweep. The entire bearish thesis stays valid as long as price holds below the Protected High at ₹449.20 — a level price should not approach while the trend remains down; only a decisive break above it would flip the structure bullish.
🎯 The Bias
My base case is bearish continuation. Price rejected cleanly from the Order Block, the downtrend is intact, and the clear draw on liquidity is the weak low (SSL) at ₹294.35. In my view, as long as TMPV stays capped below the Protected High (₹449.20), every rally into supply remains a selling opportunity rather than a reversal — the market is hunting the liquidity resting below, and the path of least resistance points lower.
📰 Fundamental Backdrop
The bearish structure lines up with a genuinely weak fundamental picture. TMPV — the standalone passenger-vehicle entity created from the Tata Motors demerger in October 2025, which also holds Jaguar Land Rover (JLR) and the electric business (TPEM) — recently plunged to a fresh 52-week low near ₹308.65, dropping over 10% in a single week amid heavy selling pressure. The pressure is fundamental as much as technical: the company's most recent quarter saw net profit fall sharply year-on-year, and it raised passenger-vehicle prices by up to 1.5% from July 1 to offset rising input costs and inflation — a sign of margin strain. Compact-vehicle sales have dipped, and the stock carries a high beta (~1.54), meaning it tends to fall harder than the broader market when sentiment sours. There is a longer-term bull case worth respecting — TMPV commands a dominant ~66% share of India's EV passenger market, is investing ₹16,000–18,000 crore in EVs by FY30, and is executing an "AI-first, Green Mobility" roadmap with new launches like the Sierra.ev — but with the next earnings not due until early November and no near-term catalyst, the chart and the fundamentals point the same way: toward a test of the lows.
This analysis will be updated as the market evolves. If this breakdown added value, drop a like 👍 and a comment 💬 to support the work — and share where you see Tata Motors heading next! Best Regards, BigBeluga 🐳
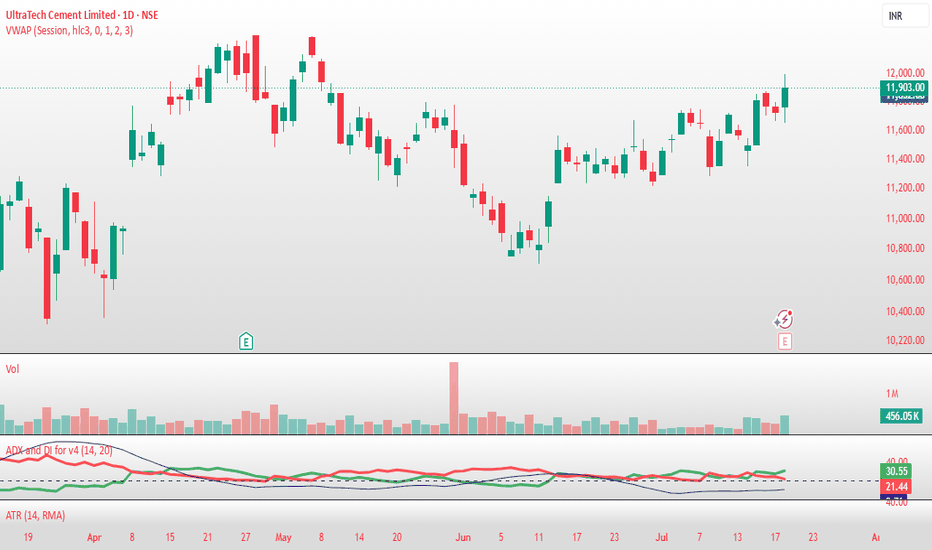
Review and plan for 21st July 2026 Nifty future and banknifty future analysis and intraday plan.
Results- Jswsteel, ultracemco, bhel.
This video is for information/education purpose only. you are 100% responsible for any actions you take by reading/viewing this post.
please consult your financial advisor before taking any action.
----Vinaykumar hiremath, CMT
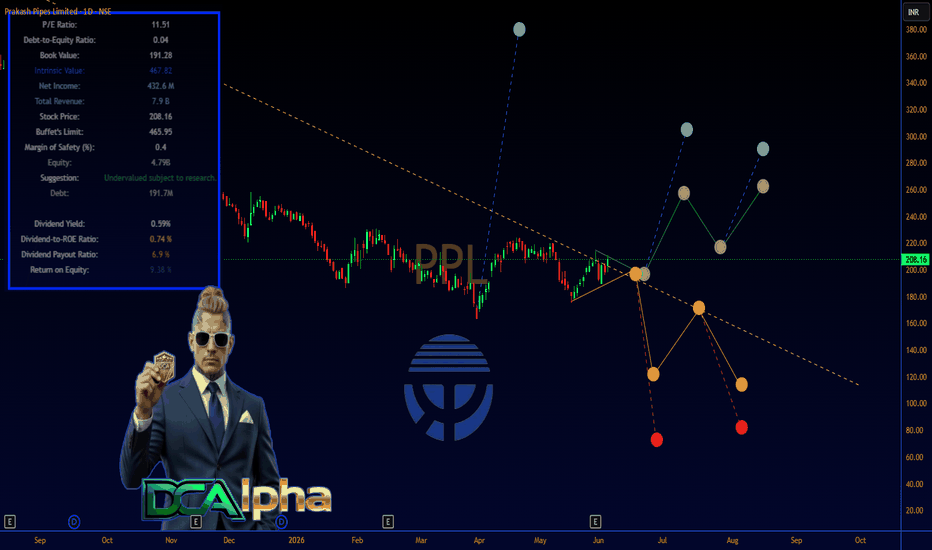
PPL (Prakash Pipes Ltd) — Q4 FY26 Net Profit Jumps 31% YoY to **💡 PPL (Prakash Pipes Ltd) — Q4 FY26 Net Profit Jumps 31% YoY to ₹13.5 Cr + 24% Final Dividend Recommended**
**SECTION 1 — Executive Summary** 💼
Prakash Pipes reported strong Q4 FY26 results on May 30 2026 with revenue up 22% YoY to ₹223 Cr and net profit up 31% YoY to ₹13.5 Cr driven by robust demand in PVC pipes and fittings. The board recommended a final dividend of ₹2.40 per share (24%) underscoring healthy cash flows in India’s growing infrastructure and agriculture sectors.
**Overall rating: Strong Buy**
**12-month price target: ₹280** (blended DCF + peer comps using FY26 EPS and 15x multiple justified by growth)
**Biggest reason to own:** Strong Q4 momentum attractive 11.4x P/E valuation and dividend yield in a company benefiting from India’s PVC pipes market expansion.
**Biggest risk:** Raw material price volatility or slowdown in rural/infra spending.
**SECTION 2 — Business Overview** 🏢
Prakash Pipes manufactures PVC pipes fittings and flexible packaging products primarily for plumbing irrigation agriculture and infrastructure applications.
**Revenue breakdown (recent data):** PVC pipes and fittings form the core business with flexible packaging as a smaller segment.
**Business model:** High-volume manufacturing and distribution of quality PVC products sold through dealers and direct to projects with repeat demand from agriculture and government infrastructure schemes.
**Competitive moat:** Established brand strong distribution network cost-efficient production and focus on quality standards that smaller unorganized players cannot match consistently.
**SECTION 3 — Financial Deep Dive** 📈
**Key metrics (Q4 FY26 and FY26 cited from company release May 30 2026 and exchange filings June 2026):**
Revenue Q4 ₹223 Cr (+22% YoY)
Net Profit Q4 ₹13.5 Cr (+31% YoY)
FY26 Revenue ₹789 Cr
FY26 Net Profit ₹43.3 Cr (EPS ₹18.09)
**Year-over-year growth (Q4 FY26):** Revenue +22% net profit +31%.
**Balance sheet health:** Healthy with low debt strong cash position and book value per share ₹195.5.
**Cash flow quality:** Strong conversion supporting the dividend recommendation.
**Capital allocation:** Final dividend of ₹2.40 per share (24%) proposed plus ongoing capacity expansion in PVC pipes.
**SECTION 4 — Growth Analysis** 🚀
**Total addressable market (TAM):** India PVC pipes market projected to grow at 5.8%+ CAGR reaching ~USD 8B+ by 2030 driven by irrigation plumbing and infrastructure (source: industry reports June 2026).
**Current market share and trajectory:** Growing presence in organized PVC segment with Q4 momentum indicating share gains.
**Key growth drivers next 3–5 years:** Government focus on Jal Jeevan Mission agriculture infrastructure and housing schemes plus capacity expansion.
**Management guidance vs. analyst consensus:** Positive momentum from Q4 with no formal guidance but dividend signals confidence.
**Growth organic:** Primarily organic with focus on operational efficiency and market expansion.
**SECTION 5 — Valuation** 📊
**DCF analysis :** 12–15% revenue CAGR for next 3–5 years terminal growth 5% WACC 12% supporting ₹280 fair value.
**Comparable company analysis:** Trades at attractive 11.4x FY26 P/E versus peers in pipes and plastics space.
**Historical valuation range (5-year):** Reasonable entry at current levels post-Q4 results.
**Bull / Base / Bear price targets:**
Bull ₹350 (strong volume growth and margin recovery)
Base ₹280 (continued execution)
Bear ₹160 (raw material spike or demand slowdown)
**Current price (~₹200–206 as of June 4 2026) vs. each target:** +36% upside to base.
**SECTION 6 — Risk Analysis** ⚠️
1. **Raw material price volatility (high probability medium impact):** PVC resin fluctuations watch input costs.
2. **Rural demand slowdown (medium medium):** Monsoon or agri income pressure.
3. **Competition from unorganized sector (medium low):** Pricing pressure in pipes.
4. **Regulatory or policy changes (low medium):** Infrastructure spending shifts.
5. **Execution on capacity expansion (low low):** Delay in new projects.
Short interest low. No major accounting flags.
**SECTION 7 — Catalyst Calendar** 📅
**Next earnings:** Q1 FY27 expected August 2026.
**Upcoming events:** Dividend record date and payment post-shareholder approval plus capacity updates.
**Macro events:** Monsoon progress government budget and infrastructure spending data.
**12-month timeline:** Continued quarterly momentum and potential volume growth from infra push.
**SECTION 8 — Technical Analysis** 📈
**Primary Chart: Daily timeframe 1-year view**
**Key observations and levels:** Price consolidating near recent highs around ₹200–206 after Q4 results. Price well above key moving averages with bullish volume on up days. RSI neutral to bullish MACD showing positive momentum. Major support at ₹180–190 resistance at ₹230–250. Clear bullish structure post-earnings.
**Technical implication for the near-term catalyst:** Positive setup for continuation higher on dividend and growth momentum.
**SECTION 9 — The Verdict** 🏆
**Bull case (₹350 40% probability):** Strong volume growth margin improvement and infra tailwinds.
**Base case (₹280 45% probability):** Steady execution and market share gains.
**Bear case (₹160 15% probability):** Raw material headwinds or demand slowdown.
**Expected value calculation:** Probability-weighted target ~₹288.
**Final recommendation with conviction level: Strong Buy with High conviction.**
**The 30-second elevator pitch:** Prakash Pipes delivered a strong Q4 with 22% revenue and 31% profit growth plus a healthy 24% dividend at just 11.4x P/E — a compelling entry in India’s growing PVC pipes sector.
**Sources**
Prakash Pipes Q4 & FY26 Earnings Release and Press Release (May 30 2026) BSE/NSE filings
Yahoo Finance PPL.NS quote and financials (as of June 4 2026)
Sharekhan Trendlyne and company announcements (June 2026)
Industry reports on India PVC pipes market (2026)
What are your thoughts on PPL? Drop them below 👇
#PPL #PrakashPipes #EarningsBeat #PVCPipes #Dividend #InfraStocks #SmallCap #IndiaStocks #ChartOfTheDay
#KaynesAs per markings, it is nature of 4th wave to go deep and take time but it seems correction is over and it can go to highs of 10000 in next 18-24 months. Timings may vary but quite promising counter and patience will be rewarded. Sector is promising and loads of incentives from the govt. Fill it shut it and sleepover it while it makes money for you.
Fundamentals and company's guidance available in public platforms. please do due diligence.
Disc: For educational purpose