• Products
  • Community
  • Markets
  • Brokers
  • More
Get started
  • Markets
  • /India
  • /Stocks
  • /Ideas
HAPPSTMNDS | Technical AnalysisThe stock is showing signs of recovery after a significant correction. Traders should watch price action, volume and key levels for trend confirmation. Disclaimer: This analysis is for educational purposes only and not investment advice. FINOMATE™ by FINSIGHT RESEARCH is not SEBI registered as a Research Analyst or Investment Adviser. Please do your own research before making investment decisions.
NSE:HAPPSTMNDS
by FINSIGHTRESEARCH
CORONA Breakout happend in this stock. Keep your risk-reward ratio according to your own preferance. This is for educational purpose, do your own research before investing.
NSE:CORONALong
by HV090604
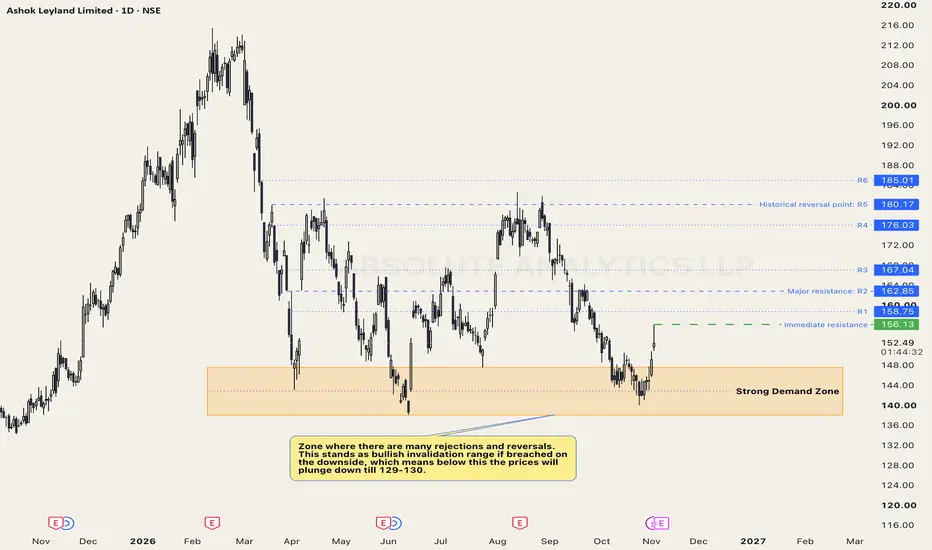
ASHOKLEY: Multi-Tested Demand Zone Ashok Leyland is displaying renewed buying interest after another successful test of its established ₹138–148 demand zone. Historically, this region has attracted repeated buying responses, making it an important structural support area. Technical observations 1. Demand zone: The ₹138–148 region has witnessed several price rejections and recoveries. The latest rebound suggests that buyers are defending the zone, although a confirmed trend reversal remains pending. 2. Immediate resistance
NSE:ASHOKLEYLong
by AbsoluteAnalytics
1
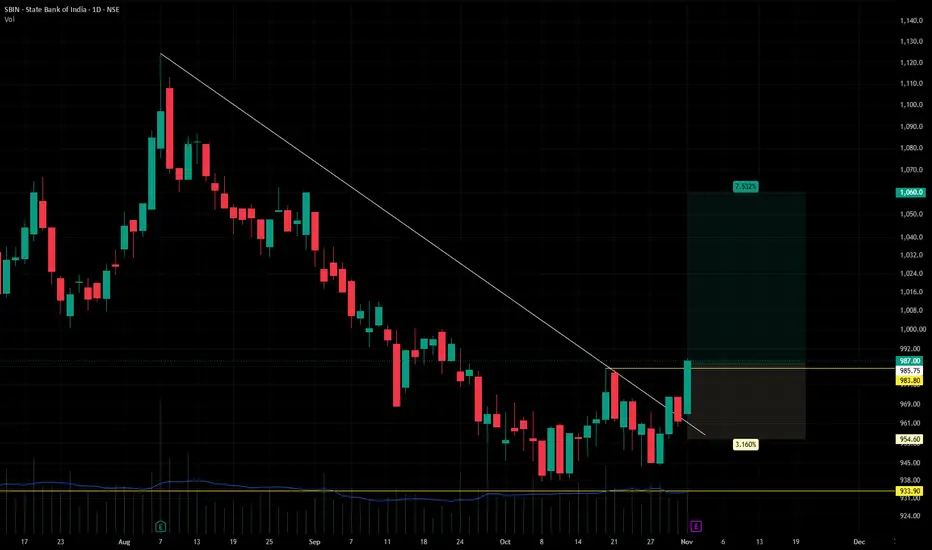
SBIState Bank of India (CMP ₹987.00, NSE: SBIN) The SmartWay Research Desk | 3 November 2026 A Mumbai‑based public sector bank, incorporated in 1955. State Bank of India (SBI) is India's largest bank, providing retail banking, corporate banking, treasury operations, international banking, digital banking, insurance distribution, and wealth management services. SBI serves millions of customers through its extensive branch network, digital platforms, and international presence across multiple co
NSE:SBINLong
by TechnicalAnalystSucrit
CYIENT 1D: 3rd Touch of a Rising Support Line A rising support line on the daily chart of CYIENT, found by an automated trendline scan from the swing highs and lows. The picture so far 3 confirmed touches on a rising support line between 16 Sep 26 and 30 Oct 26. No daily close through the line since the first touch; a close within a hair of it is not counted. The 16 Sep 26 touch, the one old enough to count, held for ten daily candles. The latest 2 touches are under a month old and are not counted. Flat ceiling on the other side:
NSE:CYIENTLong
by dgupta88
ADANIPORTS 1D: Closed Above Its Flat Resistance Line ADANIPORTS, daily: the chart's own swing highs line up on a flat resistance line. Drawn by an automated trendline scan on a log price scale. The picture so far Flat resistance line: 3 touches the candles confirm, 29 Jul 26 to 29 Sep 26. The newest closed candle (2 Nov 26) closed above the line. Of the 3 earlier touches old enough to count, 3 held for ten daily candles and 0 gave way within ten. Rising floor on the other side: 6 touches, the latest on 28 Oct 26. The two lines draw close
NSE:ADANIPORTSLong
by dgupta88
SONACOMSThis is for educational purposes only. SONACOMS is in an uptrend, trading above its 50-150-200 moving averages after breaking out of a ₹760–860 consolidation zone. Momentum is rising but not yet overbought, so the bullish trend has room to continue. Always use a stop-loss.
NSE:SONACOMSLong
by NK-PK
#Kotak multiyear breakout Ready for next bull run next target 12% target 520 after that will review again
NSE:KOTAKBANK
by AsheshBajpaiEsm
5
IGL as on 02.11.2026Is this the last candle as for now? IGL is on 61.8% of last larger degree bull phase. Make hammer type pattern on daily chart. Near 200 Monthly EMA. All with a noticeable volume. Highly favorable Risk Reward Ratio, for long term entry. Share your thought.
NSE:IGL
by Arghya_Pal
VRL Logistics 🚀 VRL LOGISTICS: 17.6% UPSIDE POTENTIAL — REVERSAL WATCH VRL Logistics Ltd. (NSE: VRLLOG) 🟢 Buy Zone: ₹278 📍 Pivot: ₹269 🛑 Stop Loss: ₹258 🎯 Target: ₹327 📊 TRADE MATH - Risk: ₹20/share - Potential Reward: ₹49/share - Risk:Reward: 1:2.45 - Potential Upside: 17.63% #VRLLogistics #VRLLOG #SwingTrading #StockMarketIndia #BreakoutStocks
NSE:VRLLOGLong
by Microcap_Investor
Gail Limited🚀 GAIL: 13% UPSIDE POTENTIAL — ENERGY SECTOR BREAKOUT GAIL (India) Ltd. (NSE: GAIL) 🟢 Buy Zone: ₹177 📍 Pivot: ₹175 🛑 Stop Loss: ₹162 🎯 Target: ₹200 🔍 WHY IT CAUGHT MY ATTENTION - Trend: Price above 20/50/100/200-day SMAs - RSI: 75.7 — strong momentum - MACD: +2.64 — bullish momentum. - ADX: 34.4 — strong trend strength. 📊 TRADE MATH - Risk: ₹15/share - Potential Reward: ₹23/share - Risk:Reward: 1:1.53 - Potential Upside: 12.99% #GAIL #GAILIndia #SwingTrading #StockMarketIndia #BreakoutSt
NSE:GAILLong
by Microcap_Investor
Stylam Industries ₹2,772 BREAKOUT — ₹4,320 ON THE RADAR? STYLAM INDUSTRIES | WEEKLY R4 BREAKOUT SETUP NSE: STYLAMIND 📌 Buy Zone: ₹2,780–2,800 🚀 Breakout: ₹2,772 🛑 Stop Loss: ₹2,137 🎯 Target 1: ₹4,320 Risk Defined. Reward Visible. Not a recommendation. For educational purposes only. Do your own research and follow your risk management. © 20K MICROCAP INVESTING | R4 MOMENTUM DESK #StylamIndustries #STYLAMIND #StockToWatch #BreakoutStocks #SwingTrading #IndianStocks #MomentumStocks #R4Momentum #20KMicroca
BSE:STYLAMINDLong
by Microcap_Investor
Sahyadri Industries 🔥 ₹320 BREAKOUT — ₹609 ON THE RADAR? SAHYADRI INDUSTRIES | WEEKLY R4 BREAKOUT SETUP NSE: SAHYADRI 📌 Buy Zone: ₹320–325 🚀 Breakout: ₹320 🛑 Stop Loss: ₹233 🎯 Target: ₹609 Risk Defined. Reward Visible. Not a recommendation. For educational purposes only. Do your own research before investing. © 20K MICROCAP INVESTING | R4 MOMENTUM DESK #SahyadriIndustries #SAHYADRI #StockToWatch #BreakoutStocks #SwingTrading #IndianStocks #MomentumStocks #R4Momentum #20KMicrocapInvesting
NSE:SAHYADRILong
by Microcap_Investor
NESTLEIND (1D) – No trendline in playNESTLEIND on the daily chart: the trendline scan has no line in play right now. For study only. Not investment advice. The author is not SEBI registered.
NSE:NESTLEINDLong
by dgupta88
Engineers India: Long-Term Breakout PotentialEngineers India Limited appears to be approaching a significant technical inflection point on the monthly chart. The long-term chart structure indicates a potential breakout from a multi-decade ascending channel, with the possibility of a substantial upward expansion over the coming months and years. 📈 Technical Analysis • Multi-Decade Ascending Channel: The stock has been moving within a broad rising channel since its early trading history, indicating a long-term bullish structure. • Major
NSE:ENGINERSINLong
by Akhildas_P
Dixon : Buy triggered Dixon : Buy triggered Daily Time Frame Be mindful of Major Red Band Resistances (This is not a buy or sell recommendation.Perform your own due diligence. The market is subject to risks. This is my personal view, and it is only for educational purposes.)
NSE:DIXONLong
by drdevanshu
1
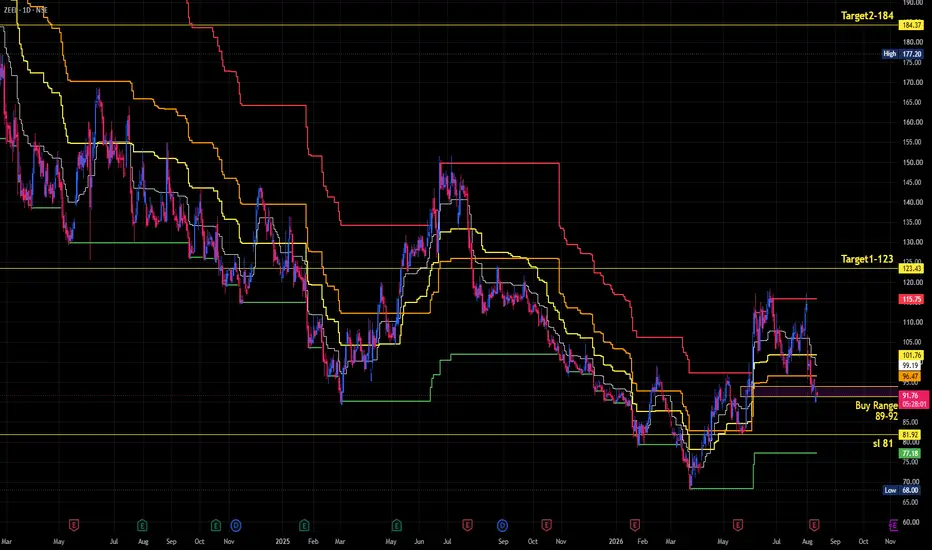
Zee - BuyPlease stick to levels on the chart. Please evaluate loss before venturing into the idea. Please trigger Target and SL at levels shown. Please hold only 25% of original purchase for Target 2.
NSE:ZEELLong
by VishalRamaswamy
Updated
2
Reliance Inds: Buy Triggered Reliance Inds: Buy Triggered Although a Buy triggered, be mindful of Major Red Band Resistances Daily Time Frame (This is not a buy or sell recommendation.Perform your own due diligence. The market is subject to risks. This is my personal view, and it is only for educational purposes.)
NSE:RELIANCELong
by drdevanshu
SL @ 6750 TP @ 14108Strategy Execution : Trade calls are provided based on trendline setups. Quantity : F&O lot sizes. Stop-Loss : Strictly follow the specified stop-loss levels. A stop-loss is considered triggered only after a 15-minute candle closes beyond the level. Position Sizing : Limit exposure to a maximum of two open positions at a time. Important Note : Do not risk more than 2% of your capital per trade.
NSE:JSWSTEELLong
by jayendrawamaj
Updated
Sl @ 8750 TP @ 17362Strategy Execution : Trade calls are provided based on trendline setups. Quantity : Determined by F&O lot sizes. Stop-Loss : Strictly follow the specified stop-loss levels. A stop-loss is considered triggered only after a 15-minute candle closes beyond the level. Position Sizing : Limit exposure to a maximum of two open positions at a time. Important Note : Do not risk more than 2% of your capital per trade.
NSE:TORNTPHARMLong
by jayendrawamaj
Updated
Asian Paints: Breakdown toward ₹938🎨🎨🎨 The Technical Setup: A 5-Year Head & Shoulders Top The Neckline Snap: The crucial support zone at ₹2,700–₹2,800—which held the stock up for years—has been decisively broken. The Breakdown: We are currently seeing a "retest and reject" move. The price is sliding down the right shoulder with increasing momentum. The Targets: * Log Target: ₹1,424 (A massive mean-reversion move). Linear Projection: ₹938 (The ultimate "worst-case" capitulation zone). Why the "Paints" Narrative is Fading (B
NSE:ASIANPAINTShort
by BallaJi
Updated
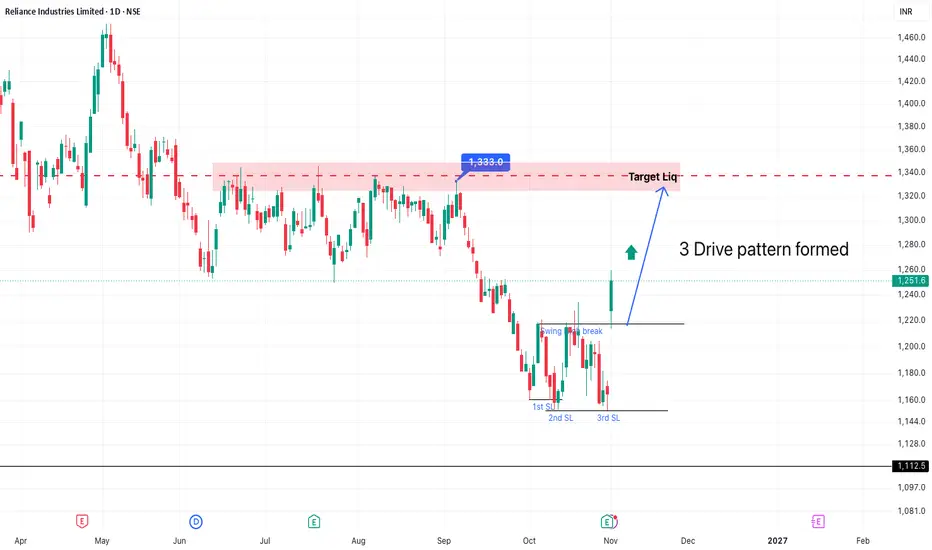
3-Drive Pattern — Harmonic Trading Strategy3-Drive Pattern — Harmonic Trading Strategy The 3-Drive Pattern is an advanced harmonic reversal pattern used in technical analysis to identify potential trend exhaustion and reversal zones. It is based on Fibonacci ratios, symmetry, and three consecutive drives toward a final Potential Reversal Zone (PRZ).    10 1. Basic Structure A Bullish 3-Drive looks like: O → X → A → B → C → D Price makes three progressively structured drives downward, with Fibonacci extensions defining each drive. T
NSE:RELIANCE
by Ramankatiyar
ABB India: Could double...⚡ 🏭 📈 🔋 🚀 1. The Macro Setup: The Hunt Volatility Funnel Look at the weekly chart. NSE:ABB has spent over two years carving out a massive, highly symmetrical Hunt Volatility Funnel @TheCryptoSniper The Compression: After hitting macro resistance near 9,027 in mid-2024, the price underwent a deep, necessary cooling-off period. The Squeeze: Throughout 2025 and early 2026, the price action compressed significantly, trapping liquidity within narrowing boundaries. The Breakout Trigger: We ar
NSE:ABB
by BallaJi
Updated
bata india . weekly trendline support and 2018 retestthis stoclk have reached on weekly trendline support, clone of top line and also support from 2018 retset , positioncan be made in it with long time holding peried
NSE:BATAINDIALong
by talwinfer12
1
123456789101112131415161718192021222324252627282930313233343536373839404142
…999

Made by humans

Select market data provided by ICE Data Services. Select reference data provided by FactSet. Copyright © 2026 FactSet Research Systems Inc.Copyright © 2026, American Bankers Association. CUSIP Database provided by FactSet Research Systems Inc. All rights reserved. SEC filings and other documents provided by Quartr.© 2026 TradingView, Inc.

SOC 2 CompliantGDPR Compliant
More than a product
  • Supercharts
Screeners
  • Stocks
  • ETFs
  • Bonds
  • Crypto coins
  • CEX pairs
  • DEX pairs
  • Pine
Heatmaps
  • Stocks
  • ETFs
  • Crypto coins
Calendars
  • Economic
  • Earnings
  • Dividends
  • IPOs
More products
  • News Flow
  • Portfolios
  • Fundamental Graphs
  • Yield Curves
  • Options
  • Macro Maps
  • Pine Script®
  • MCP Server
Apps
  • Mobile
  • Desktop
Community
  • Social network
  • Wall of Love
  • Refer a friend
  • Creator program
  • House Rules
  • Moderators
Ideas
  • Trading
  • Education
  • Editors' picks
Pine Script
  • Indicators & strategies
  • Wizards
  • Freelancers
  • Marketplace
Tools & subscriptions
  • Features
  • Pricing
  • Market data
  • Gift plans
Trading
  • Overview
  • Brokers
  • Brokers comparison
  • The Leap
Special offers
  • CME Group futures
  • Eurex futures
  • US stocks bundle
About company
  • Who we are
  • Space mission
  • Blog
  • Help Center
  • Careers
  • Media kit
Merch
  • Tarot cards for traders
  • The C63 TradeTime
Policies & security
  • Terms of Use
  • Disclaimer
  • Privacy Policy
  • Cookies Policy
  • Accessibility Statement
  • Trust Center
  • Security tips
  • Bug Bounty program
  • Status page
Business solutions
  • Widgets
  • Charting libraries
  • Lightweight Charts™
  • Advanced Charts
  • Trading Platform
Growth opportunities
  • Advertising
  • Brokerage integration
  • Partner program
  • Education program
Community
  • Social network
  • Wall of Love
  • Refer a friend
  • Creator program
  • House Rules
  • Moderators
Ideas
  • Trading
  • Education
  • Editors' picks
Pine Script
  • Indicators & strategies
  • Wizards
  • Freelancers
  • Marketplace
Business solutions
  • Widgets
  • Charting libraries
  • Lightweight Charts™
  • Advanced Charts
  • Trading Platform
Growth opportunities
  • Advertising
  • Brokerage integration
  • Partner program
  • Education program
Look FirstLook First