Bajaj FinanceSupport
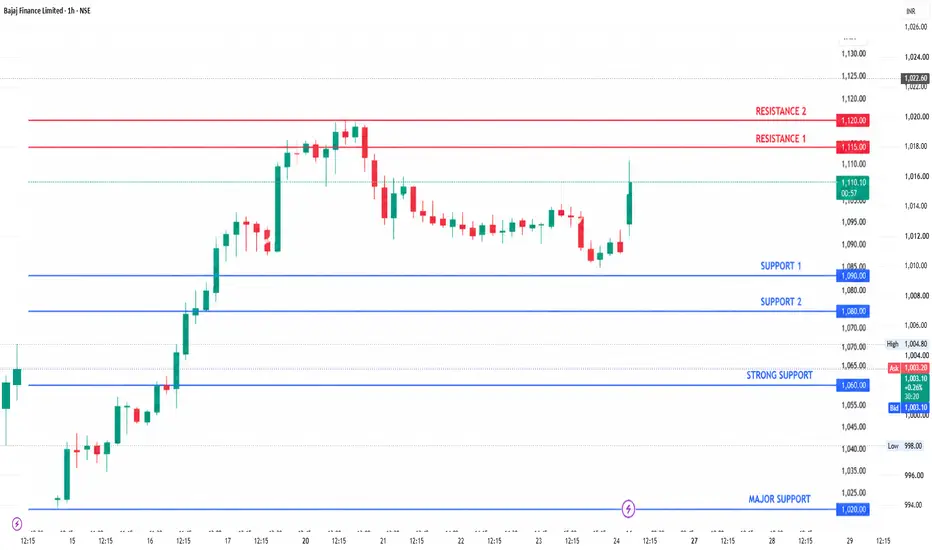
₹1,013–1,010 (Immediate)
₹1,000–995 (Strong demand zone)
₹985–975 (Major swing support)
Resistance
₹1,023–1,025 (Immediate hurdle)
₹1,033–1,040 (Breakout zone)
₹1,080–1,100 (Major resistance / previous high area)
Trading View
Bullish Scenario
Sustaining above ₹1,023–1,025 with good volume can trigger a move towards ₹1,040, followed by ₹1,080–1,100.
Bearish Scenario
A break below ₹1,000 may lead to a decline towards ₹985, and if selling pressure continues, ₹975 becomes the next important support.
Technical Outlook
Trend: Bullish
Momentum: Positive (RSI near 56–59)
Moving Averages: Strong Buy signal across most major averages
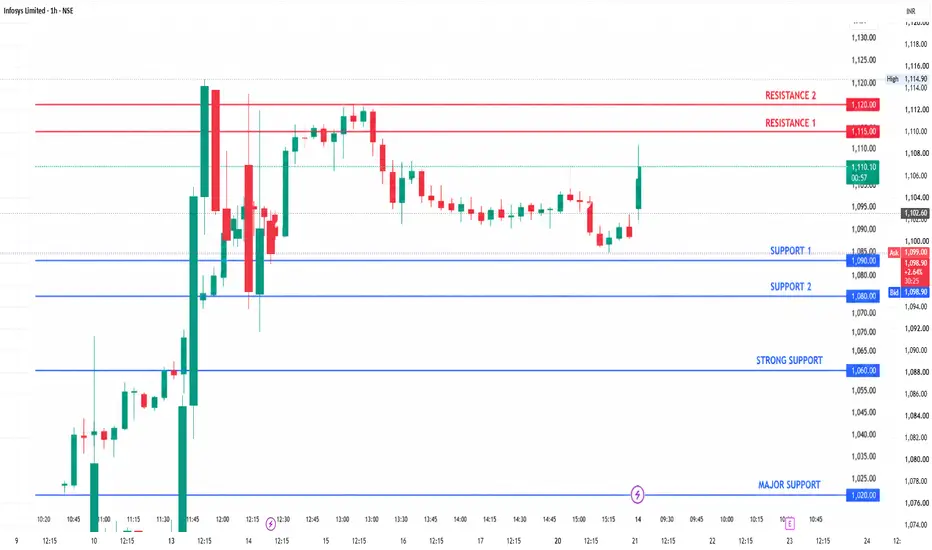
Bias: Buy on dips while above ₹1,000. InfosysCMP: ~₹1,100 (recent close around ₹1,101.90)
Immediate Support: ₹1,085–1,090
Strong Support: ₹1,050–1,060
Major Support: ₹1,000–1,020
Immediate Resistance: ₹1,120
Major Resistance: ₹1,150–1,170
Breakout Resistance: ₹1,220
Trading Plan
Bullish: Buy only on a sustained close above ₹1,120 with volume. Upside targets: ₹1,150 → ₹1,170 → ₹1,220.
Bearish: If the stock falls below ₹1,050, it could revisit the ₹1,020–1,000 zone.
Trend: Short-term recovery, but medium-term trend is still weak until Infosys reclaims its 100-DMA and 200-DMA.
Key Observation
RSI has recovered from oversold levels but remains below the strongest bullish zone.
IT stocks have seen renewed buying interest recently, which is supportive for Infosys in the near term. Larsen & ToubroCurrent Price: ~₹3,946
Pivot: ₹3,900
Support Levels:
S1: ₹3,853
S2: ₹3,821
S3: ₹3,774
Resistance Levels:
R1: ₹3,933 (already crossed)
R2: ₹3,980
R3: ₹4,012
Technical Analysis
The stock is trading above the pivot, which is a short-term positive sign.
It is approaching the ₹3,980–4,010 resistance zone. A sustained breakout above this range could lead to further upside.
Momentum indicators such as RSI are still relatively weak (around 35), suggesting the stock is recovering from a recent correction rather than being in a strong uptrend yet.
Trading View
Bullish above: ₹3,980–4,010 with strong volume.
Support to watch: ₹3,850. A fall below this could open the way toward ₹3,820–3,775.
Swing traders: Wait for a breakout above ₹4,010 or consider buying near strong support with a disciplined stop-loss.
Long-term investors: L&T continues to be supported by its diversified engineering, infrastructure, defense, and energy businesses, though short-term price action may remain volatile. Adani EnterprisesTechnical Levels
Immediate Support: ₹3,040–3,000
Major Support: ₹2,950–2,900
Strong Positional Support: ₹2,740
Immediate Resistance: ₹3,120
Major Resistance: ₹3,190–3,245
Breakout Zone: Above ₹3,245 on strong volume could open the way for a fresh uptrend.
Trading View
Bullish scenario
Hold above ₹3,040.
A sustained move above ₹3,245 with higher-than-average volume would strengthen the bullish outlook.
Bearish scenario
A close below ₹3,000 may lead to a decline toward ₹2,950 and potentially ₹2,900.
Strategy
Swing Traders: Consider fresh entries only after a confirmed breakout above ₹3,245 or on a pullback near strong support with confirmation.
Positional Investors: The long-term trend remains constructive while the stock stays above the ₹2,900–2,740 support zone. State Bank of IndiaTechnical Trend
Overall bias: Bullish / Strong Buy on many technical indicators.
RSI is around 55, indicating neutral momentum (neither overbought nor oversold).
Most moving averages remain in Buy mode, suggesting the medium-term trend is still positive.
Key Levels
Level Price (Approx.)
Immediate Support ₹1,034–1,036
Strong Support ₹1,029–1,031
Resistance 1 ₹1,039–1,040
Resistance 2 ₹1,042–1,045
Trading View
Above ₹1,040–1,045: Momentum could strengthen and buyers may attempt higher levels.
Below ₹1,030: Weakness may increase, with the next downside support lower.
Fundamental Outlook
Recent news has been supportive for SBI. The bank has strengthened its capital position through stake sales in SBI Funds Management and is expected to benefit from the additional capital for growth and provisioning.
If you're a:
Short-term trader: Watch ₹1,030 as support and ₹1,040–1,045 as the breakout zone.
Swing trader: Wait for either a confirmed breakout above resistance or a bounce from support with strong volume.
Long-term investor: SBI continues to be viewed as one of the stronger PSU banking stocks fundamentally, though entries are generally better near support zones rather than after sharp rallies. ICICI BankCMP: ~₹1,410
Immediate Support: ₹1,390
Major Support: ₹1,365–1,370
Strong Demand Zone: ₹1,330–1,340
Immediate Resistance: ₹1,430
Major Resistance: ₹1,470–1,500
Trading View
Bullish Scenario
Sustaining above ₹1,430 can trigger a move towards ₹1,470 and then ₹1,500.
Bearish Scenario
A break below ₹1,390 may lead to ₹1,365.
Below ₹1,365, the next support lies near ₹1,330.
Indicators
✅ Price is above the 20, 50, 100 and 200-day moving averages.
✅ RSI is in bullish territory (around 60), indicating positive momentum without being deeply overbought.
✅ Trend remains positive while the stock holds above the ₹1,365–1,390 support zone.
Swing Trading Plan
Buy Zone: ₹1,390–1,405 (on bullish reversal)
Breakout Buy: Above ₹1,430 with strong volume
Targets: ₹1,470 → ₹1,500
Stop Loss: Below ₹1,365 Reliance IndustriesCurrent Zone: ~₹1,297–1,308
🟢 Support Levels
S1: ₹1,285–1,290
S2: ₹1,260–1,270
Major Support: ₹1,235–1,245
🔴 Resistance Levels
R1: ₹1,320–1,330
R2: ₹1,355–1,370
Major Resistance: ₹1,420–1,450
Trading View
Bullish Scenario
Sustaining above ₹1,330 can trigger a move towards ₹1,370, followed by ₹1,420.
Bearish Scenario
A breakdown below ₹1,285 may lead to ₹1,260, and further weakness could test the ₹1,235 region.
Strategy
Swing Buy: Above ₹1,330 with confirmation.
Profit Targets: ₹1,370 → ₹1,420.
Stop Loss: Below ₹1,285.
Fresh buying is preferable only after a confirmed breakout or a strong bounce from support.
Overall, the technical setup has improved from recent lows, but ₹1,330 remains the key breakout level. Traders should also watch the upcoming quarterly results, as they could significantly influence short-term price action. AWL | Base Formation After Big Fall — ₹205 Breakout WatchAWL Agri Business Ltd — Chart Study
NSE: AWL
AWL has corrected heavily from higher levels and is now trying to build a base near an important support zone. After a long downtrend, the stock is showing early signs of stabilization, but a confirmed trend reversal is still pending.
Chart observations:
Price is holding near the important ₹170–180 support zone.
Daily momentum is slowly improving from lower levels.
The stock is trying to form a base after a prolonged correction.
The first important confirmation zone is near ₹195–205.
Weekly and monthly structure still need stronger confirmation.
The key area to track now is the ₹195–205 zone. A sustained daily close above this zone can improve the short-term structure. For better weekly confirmation, price needs to sustain above this area with healthy volume.
On the upside, important resistance zones are visible near ₹220–225, followed by ₹250–260, ₹300–320, and ₹360–400 as broader reference zones if the structure continues to improve over time.
On the downside, ₹170–180 remains the important support belt. If this zone breaks, the base formation may weaken and the stock may need more time.
Key levels:
Support zone: ₹170–180
Breakout / confirmation zone: ₹195–205
First resistance: ₹220–225
Higher resistance references: ₹250–260 / ₹300–320 / ₹360–400
For now, AWL looks like a base formation / turnaround watch setup after a long correction. It can become more interesting only if price sustains above ₹195–205 and the weekly structure starts improving.
For long-term tracking, the stock may remain on watchlist, but confirmation from both chart structure and fundamentals will be important. This is still an early recovery setup, not a confirmed long-term uptrend yet.
Shared only for educational study and chart-tracking purpose. This is not a buy/sell recommendation or investment advice. I am not a SEBI registered advisor. Please do your own research or consult a qualified financial advisor before taking any investment decision. I am not responsible for any profit or loss based on this post.
#AWL #AWLAgriBusiness #AdaniWilmar #FMCGStocks #AgriBusiness #NSE #WeeklyChart #BaseFormation #BreakoutWatch #ChartStudy #TechnicalAnalysis #StockMarketIndia  Long
Long
 Long
Long
 Long
Long
 Long
Long
DIVISLAB (Daily Chart) – Technical AnalysisDIVISLAB (Daily Chart) – Technical Analysis
The chart shows a strong uptrend with a successful pullback and continuation towards a fresh breakout.
1. Overall Trend – Bullish ✅
The stock has formed a higher high and higher low structure after making a swing low near ₹5,654.
Buyers have consistently defended every correction.
Price is now trading around ₹6,938, very close to its previous swing high of ₹6,980–7,000.
2. Fibonacci Retracement Worked Perfectly
After the rally from ₹5,654 to ₹6,980, the stock corrected.
The Fibonacci levels are:
38.2%: ₹6,471
50%: ₹6,315
61.8%: ₹6,170
The correction stopped almost exactly at the 38.2% retracement (₹6,471).
Interpretation:
A shallow correction (38.2%) indicates strong buying interest.
Strong stocks generally don't fall to the 50% or 61.8% retracement before resuming the trend.
3. Support Held at 38.2%
The green arrow marks where buyers entered.
Price:
Tested support.
Formed a bullish reversal.
Resumed the uptrend.
This confirms that institutions were accumulating around this level.
4. Previous Resistance Being Retested
The pink arrow highlights the previous high around ₹6,980–7,000.
This is an important resistance zone.
If price closes above this level with strong volume, it would confirm a fresh breakout.
5. Volume Analysis
Volume expanded during the rally from April.
During the pullback, selling volume remained controlled.
Recent rise is again supported by improving volume.
This suggests healthy participation from buyers.
Conclusion
✅ Primary trend is bullish.
✅ The stock respected the 38.2% Fibonacci retracement, a sign of strength.
✅ Higher highs and higher lows remain intact.
✅ A decisive close above ₹7,000 can trigger the next leg of the uptrend.
⚠️ As long as the stock holds above ₹6,470, the bullish structure remains intact.
Technical View: Bullish with a Breakout Watch – Keep DIVISLAB on your watchlist for a confirmed breakout above ₹7,000 accompanied by strong volume.
 Long
Long
Reliance: Bears Still Have the Upper HandI'm not interested in buying Reliance at current levels. If I had to take a trade today, I'd rather be on the short side.
The stock continues to trade below its 20, 50, 100 and 200-day moving averages, which tells me the broader trend is still bearish. While Reliance is holding an upward trendline, every bounce is getting sold near the ₹1,300 zone. That's a sign of distribution, not accumulation.
The derivatives market supports this view. Heavy Call open interest at ₹1,300, ₹1,310 and ₹1,350 suggests option writers are defending higher levels. A PCR of 0.63 also indicates bearish positioning continues to dominate.
On the daily chart, Reliance is trading below the pivot level of ₹1,302, while the 15-minute chart shows fading momentum with lower highs. Buyers have had multiple opportunities to push the stock higher but haven't been able to sustain above resistance.
As long as Reliance remains below ₹1,302–1,306, I see every pullback as a potential shorting opportunity rather than a buying opportunity.
I'm watching ₹1,279 as the first downside target. If that level breaks, the stock could extend towards ₹1,250–1,260.
I'll change my view only if Reliance closes decisively above ₹1,306 and follows through above ₹1,317. Until then, the trend favours the bears.
My trade: Sell on strength. The risk-reward currently favors the downside.  Short
Short
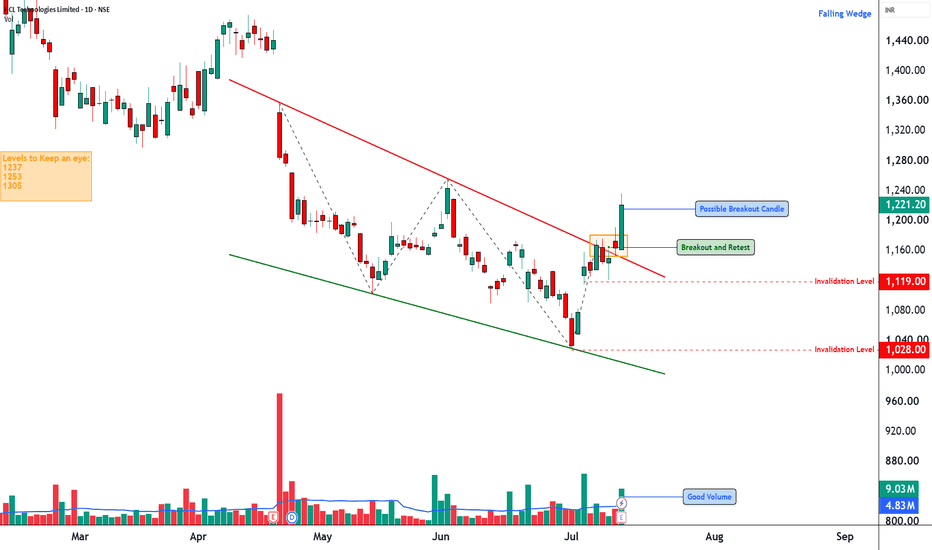
HCLTECH Falling Wedge Breakout After Strong Q1 FY27 Results📊 HCL Technologies: Daily Technical Snapshot – Falling Wedge Breakout After Strong Q1 FY27 Results
📊 STWP Technical Analysis
________________________________________
MARKET STRUCTURE SNAPSHOT | NSE: HCLTECH | DAILY
Closing Price: 1,221.20 (+57.10 | +4.91%)
Core Trend: Recovery within Long-Term Uptrend
Market State: Confirmed Falling Wedge Breakout
Price Structure: Price has broken above a multi-month Falling Wedge, supported by a strong bullish breakout candle and significantly higher trading volume. The breakout signals weakening selling pressure and improving buyer conviction.
________________________________________
OPERATIONAL PRICE GRID & KEY REFERENCE LEVELS
Model Reference Level: 1,237.00
Hard Invalidation Level: 1,119.00
Structural Risk: 118.00 (9.54%)
Resistance Levels: R1 1,251.47 | R2 1,281.73 | R3 1,326.47
Support Levels: S1 1,176.47 | S2 1,131.73 | S3 1,101.47
Range Structure: Low 1,119.00 | High 1,326.47
Higher Timeframe Observation Zones: 1,355.00 | 1,472.95
________________________________________
MOMENTUM, PARTICIPATION & CPR DATA
Volume Profile: 9.03 Million Shares
Volume Character: Very High Relative Participation
RSI: 62.89 (Strong Momentum Zone)
ADX: 14.20 (Early Trend Development Phase)
ROC: +10.78%
MACD Status: Fresh Bullish Momentum Structure
CCI: +174.99 (Strong Bullish Momentum)
Stochastic Reading: 92.37 (Extended Momentum Zone)
Current Bias: BUY ON PULLBACKS
CPR State: Bullish Zone | CPR Moving Up (Wide)
Today's CPR: Pivot 1,169.70 | Top 1,166.90 | Base 1,172.50
Tomorrow's CPR (Projected): Pivot 1,206.75 | Top 1,213.95 | Base 1,199.50
________________________________________
📚 EDUCATIONAL OBSERVATION
HCL Technologies has confirmed a breakout from a multi-month Falling Wedge, a chart pattern widely regarded as a bullish reversal formation that often develops after an extended corrective phase. The breakout is supported by a strong bullish candle, improving momentum indicators and significantly higher trading volume, reflecting renewed buying interest and strengthening market participation.
A Falling Wedge forms as prices create progressively lower highs and lower lows within converging trendlines. As the pattern matures, selling pressure gradually weakens while buyers begin accumulating at lower levels. A decisive breakout above the upper boundary often signals that the corrective phase may be ending and that a fresh upward trend could be developing.
Momentum indicators continue to support the improving technical structure. The RSI at 62.89 reflects healthy bullish momentum without entering an extreme overbought zone. MACD has generated a fresh bullish crossover, indicating strengthening upside momentum, while the ROC of +10.78% highlights strong price acceleration. The CCI reading of +174.99 confirms robust buying pressure, and the Stochastic reading of 92.37 reflects sustained momentum, although elevated readings also suggest that short-term consolidations or pullbacks remain a normal possibility after a sharp breakout.
The projected Central Pivot Range (CPR) for the next trading session has shifted higher, with the projected Pivot at 1,206.75. A rising and widening CPR generally reflects improving market acceptance of higher prices and often supports trend continuation when accompanied by healthy participation. The current dashboard therefore maintains a constructive outlook with a preference for buying on pullbacks rather than chasing extended moves.
Immediate attention remains focused on the resistance zone between 1,251 and 1,282. A sustained move above this region could strengthen the breakout further and bring the higher-timeframe observation zones near 1,355 and 1,473 into focus. On the downside, 1,176 remains the first important support, while the structural invalidation level is positioned near 1,119.
________________________________________
🏢 BUSINESS & FUNDAMENTAL UPDATE
HCL Technologies recently announced its Q1 FY27 financial results (quarter ended June 2026), delivering a strong operational performance despite a challenging environment for the global IT services sector.
Key Highlights
Net Profit: 4,624 crore, up 20.32% year-on-year from 3,843 crore.
Revenue: 34,579 crore, representing 13.94% year-on-year growth from 30,349 crore.
Interim Dividend: The Board declared an interim dividend of 12 per equity share (face value 2) for FY27. The record date is 17 July 2026, while the dividend will be paid on 27 July 2026.
FY27 Guidance: Management reiterated its constant currency revenue growth guidance of 1–4%, maintaining its earlier outlook despite macroeconomic uncertainty.
The quarterly performance comes at a time when the broader IT sector continues to face headwinds from cautious enterprise technology spending, reduced discretionary budgets and increasing discussions around AI-driven pricing pressure across traditional IT services. Against this backdrop, HCLTech's stronger-than-expected profitability, double-digit revenue growth and stable guidance demonstrate operational resilience and disciplined execution.
Interestingly, the stock had already attracted strong buying interest ahead of the earnings announcement, rallying nearly 5% in the previous trading session. The combination of robust quarterly earnings, a healthy dividend announcement, stable management guidance and a technically confirmed Falling Wedge breakout provides both fundamental and technical support for the improving market structure.
________________________________________
📖 Educational Note
Support and resistance levels should be viewed as observation zones rather than predictive targets. Chart patterns, price action, volume analysis, momentum indicators and CPR are educational tools that help market participants understand evolving market structure within a disciplined risk-management framework. Similarly, strong quarterly results can improve investor sentiment but should always be evaluated alongside broader market conditions, valuation and risk management principles.
________________________________________
⚠️ Disclaimer
This analysis is provided strictly for educational and informational purposes.
It does not constitute financial, investment or trading advice and should not be interpreted as a recommendation to buy or sell any security.
Stock market investments are subject to market risks, including the possible loss of capital.
Past performance, historical observations, chart patterns, earnings performance and technical indicators do not guarantee future results.
Please conduct your own research and consult a SEBI-registered investment adviser before making investment decisions.
STWP assumes no responsibility or liability for any financial loss arising directly or indirectly from the use of this analysis.
 Long
Long