• Products
  • Community
  • Markets
  • Brokers
  • More
Get started
  • Markets
  • /India
  • /Stocks
  • /Ideas
Kotak Mahindra Bank โ€“ Daily Chart Analysis | Breakout Watch**Kotak Mahindra Bank โ€“ Daily Chart Analysis | Breakout Watch๐Ÿ“ˆ** Kotak Mahindra Bank is showing strong bullish momentum after breaking above a descending trendline and the resistance zone around โ‚น440โ€“โ‚น444. ๐Ÿ” **Key observations:** - **Trendline breakout:** Price has moved above the descending resistance trendline. - **Resistance breakout:** The stock is trading above the โ‚น444 level. - **Volume:** Recent price action shows increased trading volume, supporting the breakout. - **Next levels to wa
NSE:KOTAKBANKLong
by mr-nm_0123
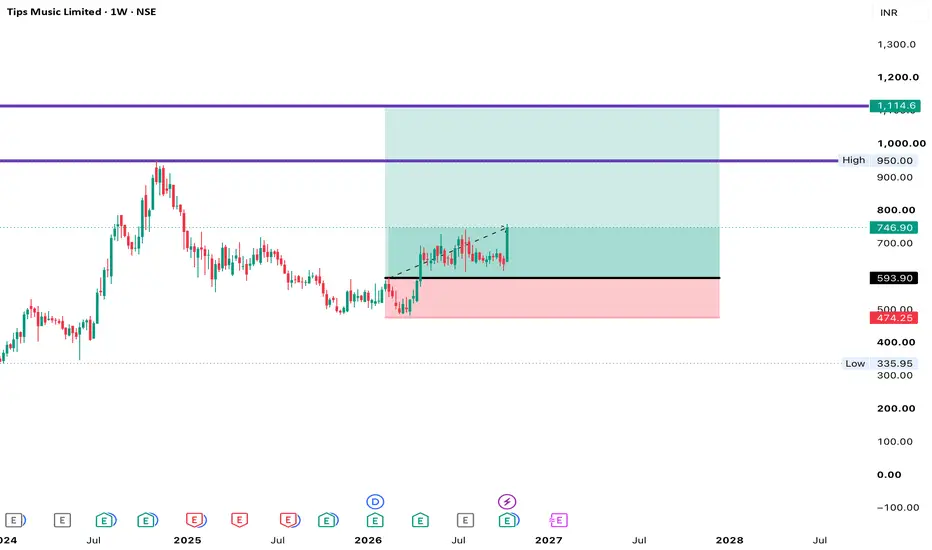
TIPS Music have given strong bullish momentum TIPS Music has shown strong bullish momentum on weekly time frame and showing strength to touch previous and high and then making a new high. This is just for education purposes and not a trade recommendation. Please consult your financial advisor.
NSE:TIPSMUSICLong
by VG_Ghai
BUY TODAY SELL TOMORROW for 5%DONโ€™T HAVE TIME TO MANAGE YOUR TRADES? - Take BTST trades at 3:25 pm every day - Try to exit by taking 4-7% profit of each trade - SL can also be maintained as closing below the low of the breakout candle Now, why do I prefer BTST over swing trades? The primary reason is that I have observed that 90% of the stocks give most of the movement in just 1-2 days and the rest of the time they either consolidate or fall Trendline breakout in VAKRANGEE BUY TODAY SELL TOMORROW for 5%
NSE:VAKRANGEE
by Kapil-Mittal
2
Is this the Right TIme to Invest in IT Stocks + World Markets Apoorv Dubey, SEBI Registered Research Analyst Disclaimer: This video is for educational and informational purposes only and is not a recommendation to buy, sell or hold any security. Investments in securities markets are subject to market risks. Read all related documents carefully before investing. Registration granted by SEBI and certification from NISM in no way guarantee the performance of the intermediary or provide any assurance of returns to investors. Topics -Discussed about IT pack
NSE:WIPROLong
21:04
by Apoorv-Dubey_SEBI-RA
KWALITY WALLS: ELLIOTT WAVE COUNT & BREAKOUT SETUPSymbol: KWALITY WALLS (NSE) Timeframe: 1D CMP: โ‚น38.70 Technical Analysis Kwalโ€‹โ€‹ity Walls is at a crucial technical juncture following a strong impulsive advance from the โ‚น22.24 base to the โ‚น50.68 high. The current price structure appears to be developing a corrective Wave 4, with price testing an important support and potential accumulation zone around โ‚น34.70โ€“โ‚น38.00. Elliott Wave Structure The preferred Elliott Wave interpretation suggests that Wave 1 and Wave 2 have completed, followed by
NSE:KWIL
by hardeepssethi
2
Reliance โ€“ Daily Analysis โ€“ 5 to 20% UPSIDE PotentialNSE:RELIANCE Reliance Industries Limited is setting up a technical trendline breakout and accumulation base structure on the daily chart following an extended corrective move from its 52-week peak at โ‚น1,611.80 . Price recently swept into a deep demand floor to form a major base low at โ‚น1,152.20 inside the primary SUPPORT ZONE ( โ‚น1,120.00 โ€“ โ‚น1,160.00 ). Currently trading at โ‚น1,211.20 (-0.31%), price is consolidating inside the Buying / Investing Zone , coiling directly beneath its lon
NSE:RELIANCELong
by JaiLaxmiMata
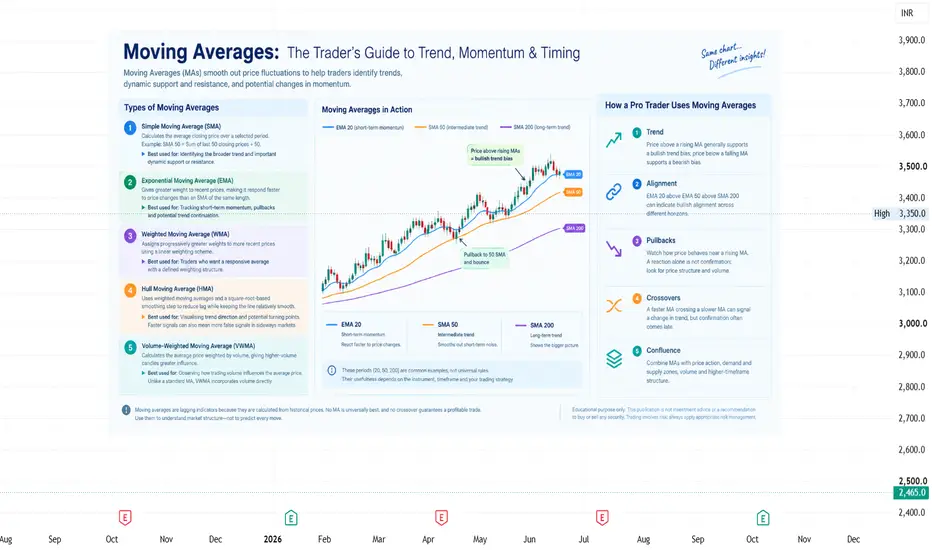
Moving Averages: The Traderโ€™s Guide to Trend, Momentum & TimingMoving Averages: The Traderโ€™s Guide to Trend, Momentum & Timing Moving Averages (MAs) smooth price fluctuations to help traders identify trends, dynamic support and resistance, and potential changes in momentum. But not all moving averages work the same way. Understanding their differences helps you use them with purpose rather than adding more lines to your chart. 1. Simple Moving Average (SMA) Calculates the average closing price over a selected period. Example: SMA 50 = Sum of the l
NSE:TCSEducation
by KingDoxa_trades
INDUSTOWERIndus Tower CMP - 383.3 Quaterly results on 27th Oct Price is in a acculamulting phase & might give a upmove before the earnings call Target - 414-448 (This is not an buying or selling advice, just for the educational purpose only. Consult the certified financial advisor)
NSE:INDUSTOWERLong
by zaverisanskar8
Molbio Diagnostics cmp 1574.40 Daily Chart since listedMolbio Diagnostics cmp 1574.40 Daily Chart since listed - Support Zone 1200 to 1425 price band - Resistance Zone 1585 to ATH 1686.80 price band - Price shouldering along the Rising Support Trendline - Breakout is attempted from Falling Resistance Trendline - Heavy Volumes spike on Friday by sync with avg traded qty - Rounding Bottoms and/or Cup & Handles as one may observe - Support Zone seems well tested retested, to create the New ATH
M
by PIYUSHCHAVDA
Trading Road Mapoptions trading and institutional trading are important parts of modern financial markets. Options trading offers flexibility and opportunities for profit, while institutional trading provides liquidity and stability to the market. However, beginners should learn market concepts carefully before entering options trading because losses can occur quickly without proper knowledge and risk management. Education, practice, and disciplined investing are essential for long-term success in trading.
NSE:ICICIBANKEducation
43:42
by Knowledgehub
16
Institutional Trading Masterclass #1Institutions focus on 4 pillars: A. Direction Will market go up, down, sideways? B. Volatility Will movement increase or decrease? C. Time Decay How much premium melts daily? D. Risk Exposure How much capital at risk? Rules to Become Consistent
NSE:RELIANCEEducation
33:06
by Knowledgehub
6
How I Find Swing Trading Stocks Myself: 10 Filters Apoorv Dubey | SEBI Registered Research Analyst Learn how to read stocks yourself using price action, market structure and candlestick patterns, then confirm with volume, Fibonacci levels, confluence zones and multi-timeframe analysis. Build a complete swing trading checklist, step by step, with no tips needed. Disclaimer: This video is strictly for educational purposes and is not a buy, sell or hold recommendation. Stocks or charts shown are examples only to explain the screening process an
NSE:HBLENGINELong
15:40
by Apoorv-Dubey_SEBI-RA
Cup and HandleCleanest cup and handle pattern formed on both weekly and monthly chart. Retest successfully done this week and also a hammer formed on weekly chart. 50 week EMA also there for strong support right on the neckline.
NSE:ADANIPOWERLong
by Big_Bull111
INFOSYS 5 MIN CHART ANALYSIS**INFOSYS (NSE: INFY) | 5-Minute Chart Analysis ๐Ÿ“ˆ** **Setup: Range Breakout + Bullish Continuation** INFY has shown strong bullish momentum, followed by a consolidation phase near the highs. Price has now broken above the consolidation range, indicating a potential bullish continuation if the breakout sustains. ๐Ÿ” **Technical Analysis:** - **Structure:** Strong bullish impulse followed by sideways consolidation. - **Key Resistance:** โ‚น1,167โ€“โ‚น1,168 - **Breakout Zone:** Above the consolidation r
NSE:INFYLong
by vishal6171
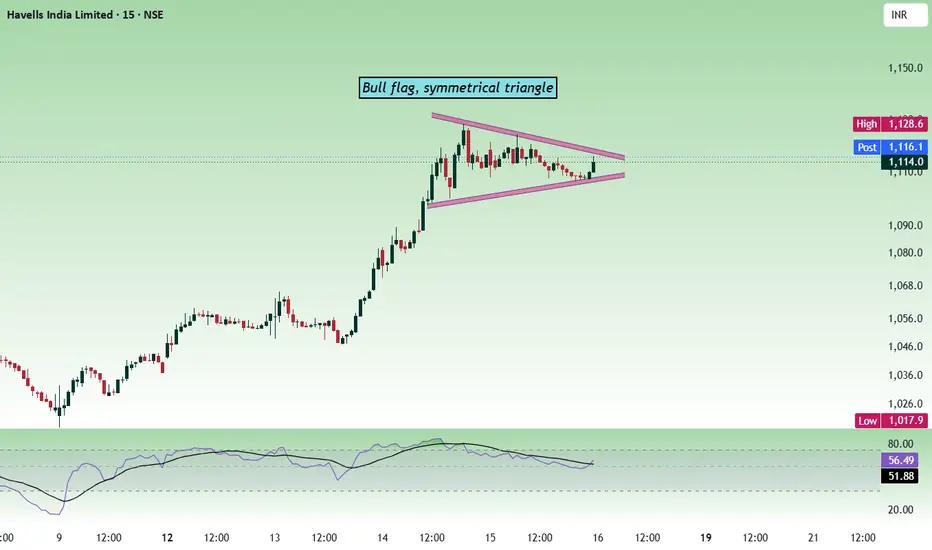
Havells - Multi time frame analysisIn the lower timeframe, the price is forming a symmetrical triangle. We can also see a bull flag formation. A symmetrical triangle is a neutral pattern, and the breakout can be in any direction. A bull flag is a bullish pattern. On the daily timeframe, the price is forming a W pattern, which is bullish. The price is bullish as long as it stays above 1082 - 1088. Buy above 1110 - 1114 with a stop-loss of 1094 for the targets 1122, 1136, 1148, 1162 and 1176. The price can face resistance at the 1
NSE:HAVELLSLong
by vanathi
Updated
2
Buy Today, Sell Tomorrow for 3-5% - Daily Breakout SetupSHYAMMETL โ€” BTST BREAKOUT SETUP Entry, Stop Loss & Targets Are Clearly Defined โ€” Helping You Plan Your Trade With Confidence. ๐Ÿ“Š Stock Strength: 90/100 (Note: Higher score indicates stronger stock conditions, not guaranteed returns.) A bullish breakout has appeared on the 1D timeframe with positive price action and strong volume expansion. ๐Ÿ”„ Trade Type: BTST โ”€โ”€โ”€โ”€โ”€โ”€โ”€โ”€โ”€โ”€โ”€โ”€โ”€โ”€โ”€โ”€โ”€โ”€โ”€โ”€ ๐ŸŽฏ TRADE LEVELS ENTRY: โ‚น1,196 ๐Ÿ›‘ STOP LOSS ATR SL: โ‚น1,141 ๐ŸŽฏ TARGETS T1: โ‚น1,245 T2: โ‚น1,308 T3: โ‚น1,377 โ”€โ”€โ”€โ”€โ”€โ”€โ”€โ”€โ”€โ”€
NSE:SHYAMMETLLong
by nemichandbhati
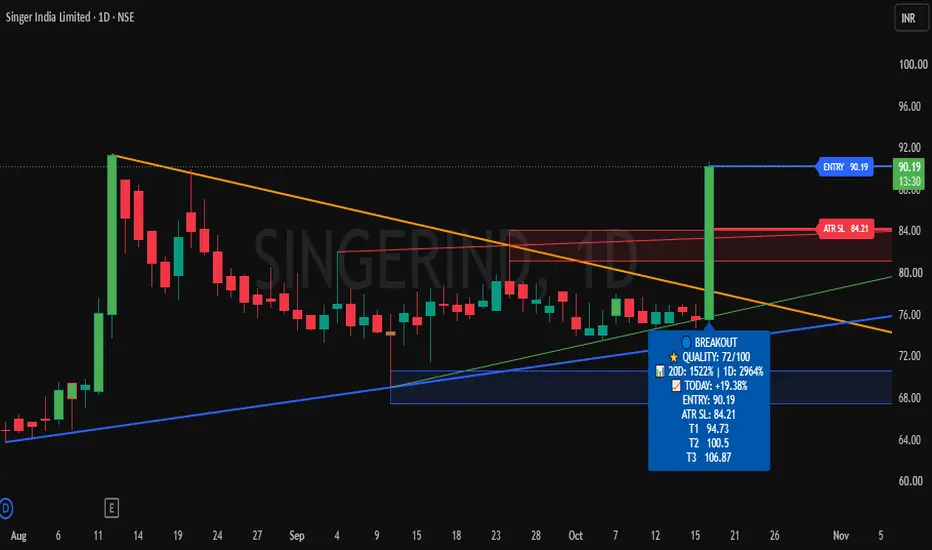
Buy Today, Sell Tomorrow for 3-5% - Daily Breakout SetupSINGERIND โ€” BTST BREAKOUT SETUP Entry, Stop Loss & Targets Are Clearly Defined โ€” Helping You Plan Your Trade With Confidence. ๐Ÿ“Š Stock Strength: 72/100 (Note: Higher score indicates stronger stock conditions, not guaranteed returns.) A bullish breakout has appeared on the 1D timeframe with positive price action and strong volume expansion. ๐Ÿ”„ Trade Type: BTST โ”€โ”€โ”€โ”€โ”€โ”€โ”€โ”€โ”€โ”€โ”€โ”€โ”€โ”€โ”€โ”€โ”€โ”€โ”€โ”€ ๐ŸŽฏ TRADE LEVELS ENTRY: โ‚น90 ๐Ÿ›‘ STOP LOSS ATR SL: โ‚น84 ๐ŸŽฏ TARGETS T1: โ‚น94 T2: โ‚น100 T3: โ‚น106 โ”€โ”€โ”€โ”€โ”€โ”€โ”€โ”€โ”€โ”€โ”€โ”€โ”€โ”€โ”€โ”€โ”€โ”€โ”€โ”€ ๐Ÿ“ˆ
NSE:SINGERINDLong
by nemichandbhati
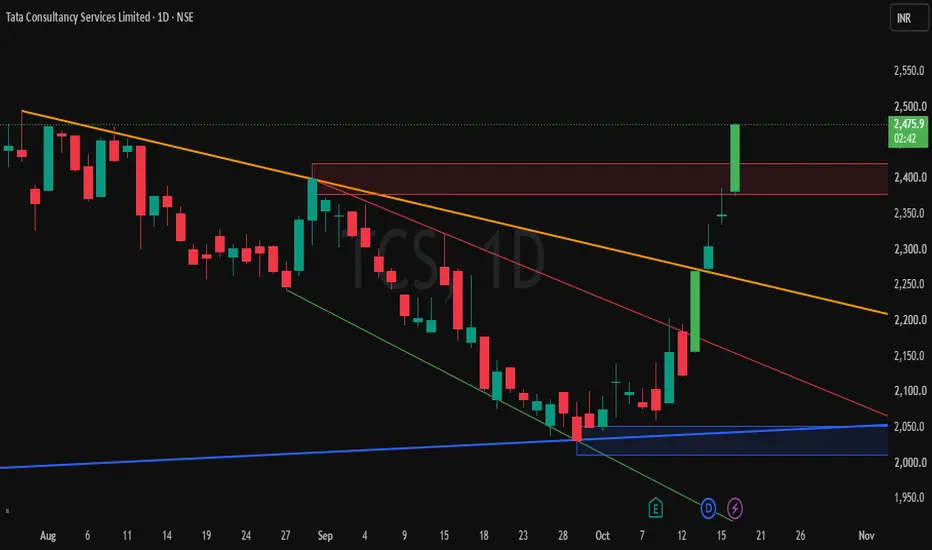
Buy Today, Sell Tomorrow for 3-5% - Daily Breakout SetupTCS โ€” BTST BREAKOUT SETUP Entry, Stop Loss & Targets Are Clearly Defined โ€” Helping You Plan Your Trade With Confidence. ๐Ÿ“Š Stock Strength: 69/100 (Note: Higher score indicates stronger stock conditions, not guaranteed returns.) A bullish breakout has appeared on the 1D timeframe with positive price action and strong volume expansion. ๐Ÿ”„ Trade Type: BTST โ”€โ”€โ”€โ”€โ”€โ”€โ”€โ”€โ”€โ”€โ”€โ”€โ”€โ”€โ”€โ”€โ”€โ”€โ”€โ”€ ๐ŸŽฏ TRADE LEVELS ENTRY: โ‚น2,350 ๐Ÿ›‘ STOP LOSS ATR SL: โ‚น2,244 ๐ŸŽฏ TARGETS 3โ€“5% โ”€โ”€โ”€โ”€โ”€โ”€โ”€โ”€โ”€โ”€โ”€โ”€โ”€โ”€โ”€โ”€โ”€โ”€โ”€โ”€ ๐Ÿ“ˆ VOLUME 20D Volume: 2
NSE:TCSLong
by nemichandbhati
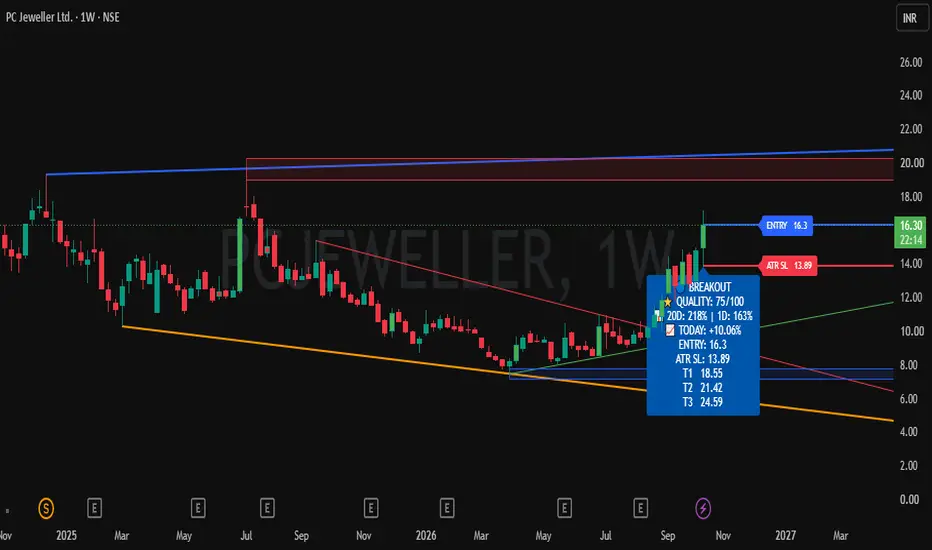
PCJEWELLER โ€” SWING TRADING WEEKLY SETUPPCJEWELLER โ€” SWING TRADING WEEKLY SETUP Entry, Stop Loss & Targets Are Clearly Defined โ€” Helping You Plan Your Trade With Confidence. ๐Ÿ“Š Stock Strength: 75/100 (Note: Higher score indicates stronger stock conditions, not guaranteed returns.) A bullish breakout has appeared on the 1 Week timeframe with positive price action and strong volume expansion. ๐Ÿ”„ Trade Type: Swing Trade โ€” Weekly โ”€โ”€โ”€โ”€โ”€โ”€โ”€โ”€โ”€โ”€โ”€โ”€โ”€โ”€โ”€โ”€โ”€โ”€โ”€โ”€ ๐ŸŽฏ TRADE LEVELS ENTRY: โ‚น16 ๐Ÿ›‘ STOP LOSS ATR SL: โ‚น14 ๐ŸŽฏ TARGETS T1: โ‚น19 T2: โ‚น22 T3: โ‚น2
NSE:PCJEWELLERLong
by nemichandbhati
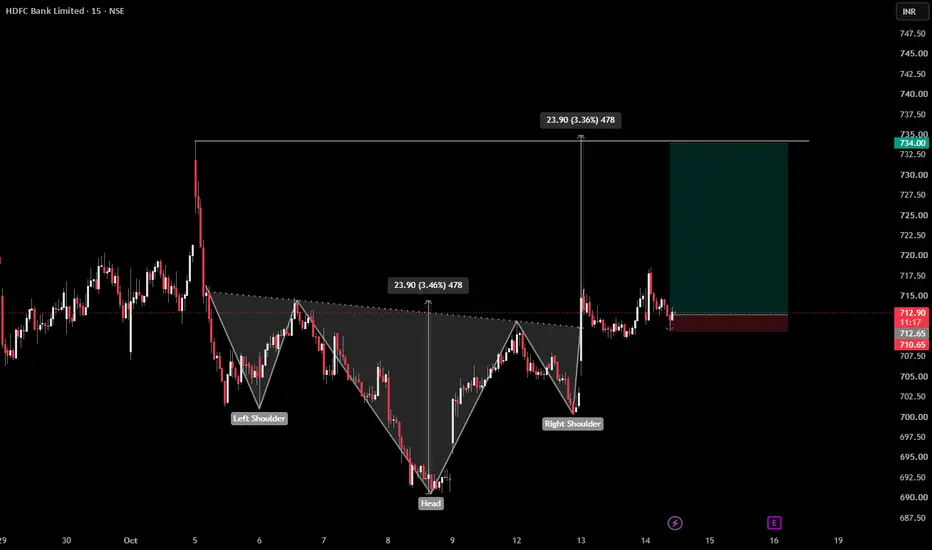
HDFCBANK INVERSE H&S **Pattern:** Inverse Head & Shoulders **Market:** NSE โ€“ HDFC Bank **Timeframe:** 15 Minutes **Neckline Breakout:** โ‚น712โ€“713 Zone **Potential Target:** โ‚น734 **Stop Loss:** โ‚น710.65 HDFC Bank is showing a potential bullish reversal structure on the 15-minute chart, forming an Inverse Head & Shoulders pattern after a downtrend. The price has moved above the neckline zone, indicating a possible shift in short-term momentum. A sustained breakout above the neckline, followed by successf
NSE:HDFCBANKLong
by vishal6171
Updated
WIPRO โ€” BTST & SWING BREAKOUT SETUPWIPRO โ€” BTST & SWING BREAKOUT SETUP Entry, Stop Loss & Targets Are Clearly Defined โ€” Helping You Plan Your Trade With Confidence. ๐Ÿ“Š Stock Strength: 69/100 (Note: Higher score indicates stronger stock conditions, not guaranteed returns.) A bullish breakout has appeared on the 1D timeframe with positive price action and strong volume expansion. ๐Ÿ”„ Trade Type: BTST & SWING โ”€โ”€โ”€โ”€โ”€โ”€โ”€โ”€โ”€โ”€โ”€โ”€โ”€โ”€โ”€โ”€โ”€โ”€โ”€โ”€ ๐ŸŽฏ TRADE LEVELS ENTRY: โ‚น185 ๐Ÿ›‘ STOP LOSS ATR SL: โ‚น178 ๐ŸŽฏ TARGETS 216 Approximately 16% โ”€โ”€โ”€โ”€โ”€โ”€โ”€โ”€โ”€
NSE:WIPROLong
by nemichandbhati
Buy Today, Sell Tomorrow for 3-5% - Daily Breakout SetupAJMERA โ€” BTST BREAKOUT SETUP Entry, Stop Loss & Targets Are Clearly Defined โ€” Helping You Plan Your Trade With Confidence. ๐Ÿ“Š Stock Strength: 69/100 (Note: Higher score indicates stronger stock conditions, not guaranteed returns.) A bullish breakout has appeared on the 1D timeframe with positive price action and strong volume expansion. ๐Ÿ”„ Trade Type: BTST โ”€โ”€โ”€โ”€โ”€โ”€โ”€โ”€โ”€โ”€โ”€โ”€โ”€โ”€โ”€โ”€โ”€โ”€โ”€โ”€ ๐ŸŽฏ TRADE LEVELS ENTRY: โ‚น129 ๐Ÿ›‘ STOP LOSS ATR SL: โ‚น122 ๐ŸŽฏ TARGETS 5% โ”€โ”€โ”€โ”€โ”€โ”€โ”€โ”€โ”€โ”€โ”€โ”€โ”€โ”€โ”€โ”€โ”€โ”€โ”€โ”€ ๐Ÿ“ˆ VOLUME 20D Volume: 3
NSE:AJMERALong
by nemichandbhati
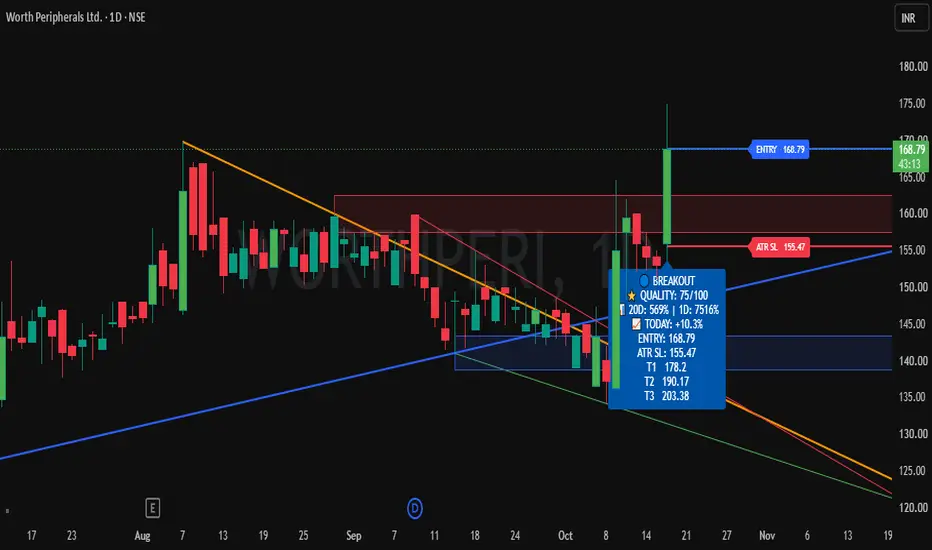
Buy Today, Sell Tomorrow for 3-5% - Daily Breakout SetupWORTHPERI โ€” BTST BREAKOUT SETUP Entry, Stop Loss & Targets Are Clearly Defined โ€” Helping You Plan Your Trade With Confidence. ๐Ÿ“Š Stock Strength: 75/100 (Note: Higher score indicates stronger stock conditions, not guaranteed returns.) A bullish breakout has appeared on the 1D timeframe with positive price action and strong volume expansion. ๐Ÿ”„ Trade Type: BTST โ”€โ”€โ”€โ”€โ”€โ”€โ”€โ”€โ”€โ”€โ”€โ”€โ”€โ”€โ”€โ”€โ”€โ”€โ”€โ”€ ๐ŸŽฏ TRADE LEVELS ENTRY: โ‚น167 ๐Ÿ›‘ STOP LOSS ATR SL: โ‚น154 ๐ŸŽฏ TARGETS 3โ€“5% โ”€โ”€โ”€โ”€โ”€โ”€โ”€โ”€โ”€โ”€โ”€โ”€โ”€โ”€โ”€โ”€โ”€โ”€โ”€โ”€ ๐Ÿ“ˆ VOLUME 20D Volume:
NSE:WORTHPERILong
by nemichandbhati
HBL Engineering - Breakout PossibilityHBL Engineering : Triangle breakout possibility Sustaining 835 is crucial for a breakout
NSE:HBLENGINELong
by roshansai
123456789101112131415161718192021222324252627282930313233343536373839404142
โ€ฆ999

Made by humans

Select market data provided by ICE Data Services. Select reference data provided by FactSet. Copyright ยฉ 2026 FactSet Research Systems Inc.Copyright ยฉ 2026, American Bankers Association. CUSIP Database provided by FactSet Research Systems Inc. All rights reserved. SEC filings and other documents provided by Quartr.ยฉ 2026 TradingView, Inc.

SOC 2 CompliantGDPR Compliant
More than aย product
  • Supercharts
Screeners
  • Stocks
  • ETFs
  • Bonds
  • Crypto coins
  • CEX pairs
  • DEX pairs
  • Pine
Heatmaps
  • Stocks
  • ETFs
  • Crypto coins
Calendars
  • Economic
  • Earnings
  • Dividends
  • IPOs
More products
  • News Flow
  • Portfolios
  • Fundamental Graphs
  • Yield Curves
  • Options
  • Macro Maps
  • Pine Scriptยฎ
  • MCP Server
Apps
  • Mobile
  • Desktop
Community
  • Social network
  • Wall of Love
  • Refer a friend
  • Creator program
  • House Rules
  • Moderators
Ideas
  • Trading
  • Education
  • Editors' picks
Pine Script
  • Indicators & strategies
  • Wizards
  • Freelancers
  • Marketplace
Tools & subscriptions
  • Features
  • Pricing
  • Market data
  • Gift plans
Trading
  • Overview
  • Brokers
  • Brokers comparison
  • The Leap
Special offers
  • CME Group futures
  • Eurex futures
  • US stocks bundle
About company
  • Who we are
  • Space mission
  • Blog
  • Help Center
  • Careers
  • Media kit
Merch
  • Tarot cards for traders
  • The C63 TradeTime
Policies & security
  • Terms of Use
  • Disclaimer
  • Privacy Policy
  • Cookies Policy
  • Accessibility Statement
  • Trust Center
  • Security tips
  • Bug Bounty program
  • Status page
Business solutions
  • Widgets
  • Charting libraries
  • Lightweight Chartsโ„ข
  • Advanced Charts
  • Trading Platform
Growth opportunities
  • Advertising
  • Brokerage integration
  • Partner program
  • Education program
Community
  • Social network
  • Wall of Love
  • Refer a friend
  • Creator program
  • House Rules
  • Moderators
Ideas
  • Trading
  • Education
  • Editors' picks
Pine Script
  • Indicators & strategies
  • Wizards
  • Freelancers
  • Marketplace
Business solutions
  • Widgets
  • Charting libraries
  • Lightweight Chartsโ„ข
  • Advanced Charts
  • Trading Platform
Growth opportunities
  • Advertising
  • Brokerage integration
  • Partner program
  • Education program
Look FirstLook First