• Products
  • Community
  • Markets
  • Brokers
  • More
Get started
  • Markets
  • /India
  • /Stocks
  • /Ideas
TCS Strong Rebound Above the Stomach Within the Trading Range🔥 TCS: Strong Rebound Above the Stomach Within the Trading Range 📊 MARKET STRUCTURE SNAPSHOT | NSE: TCS | DAILY Closing Price: 2,269.30 (+6.79%) Core Trend: Broader trend under pressure; short-term momentum bullish Market State: Range-bound recovery Chart Pattern: No confirmed breakout from the broader range Candlestick Pattern: Above the Stomach Price Structure: TCS has rebounded sharply from the 2,050–2,100 region and moved back above 2,200, while remaining within the broader trading range. Te
NSE:TCSLong
by simpletradewithpatience
#swarajeng bounce back after decent numbersTrendline breakout with strong result next levels 3950/4200 with strict stoploss below 3499 for traders
NSE:SWARAJENG
by AsheshBajpaiEsm
HCLTECH | Monthly Triangle, Weekly Liquidity Zone and DailyAPOORV DUBEY | SEBI Registered Research Analyst ⚠️ This post is for educational purposes only. It is not a recommendation to buy, sell or hold any security. Why this post? The goal is not to give you a view on HCL Tech. It is to show you how to analyse a chart on your own. Always start from the biggest timeframe and work down. 1. Monthly: the big picture -Support trendline: price has respected an ascending trendline since 2011, tested again in 2020 and in the current structure. -Resistance
NSE:HCLTECHLong
by Apoorv-Dubey_SEBI-RA
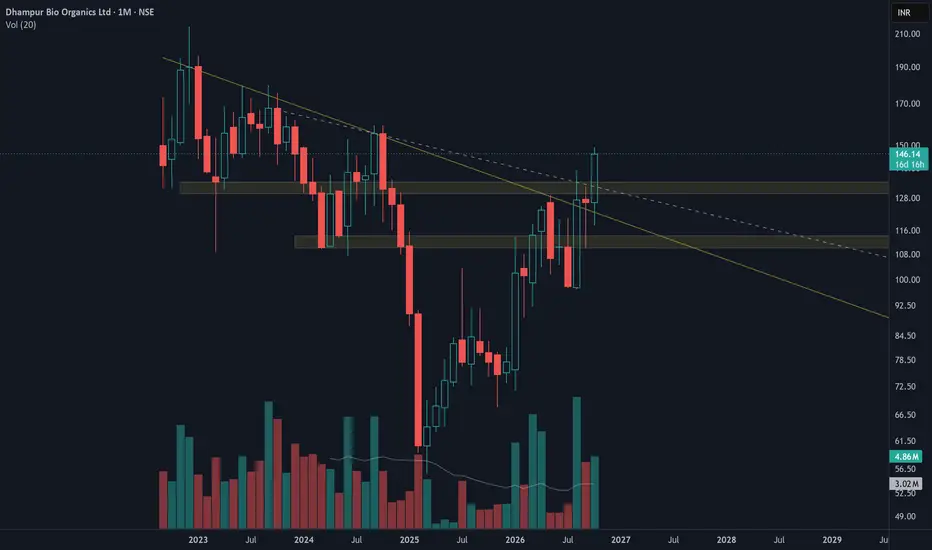
Fertile Ground for a Turnaround!Pattern Structure: The chart showcases a well-defined descending pattern, a structural formation where the white dashed line acts as a crucial hidden resistance level before the current price action. Volume Analysis: A significant surge in buying volume propels the breakout, serving as a vital confirmation and protecting traders from potential false breakouts. Supply and Demand Flip Zone: Observe the transition zone: an initial demand area that turned into resistance, and has now been reclaime
NSE:DBOLLong
by Knox1411
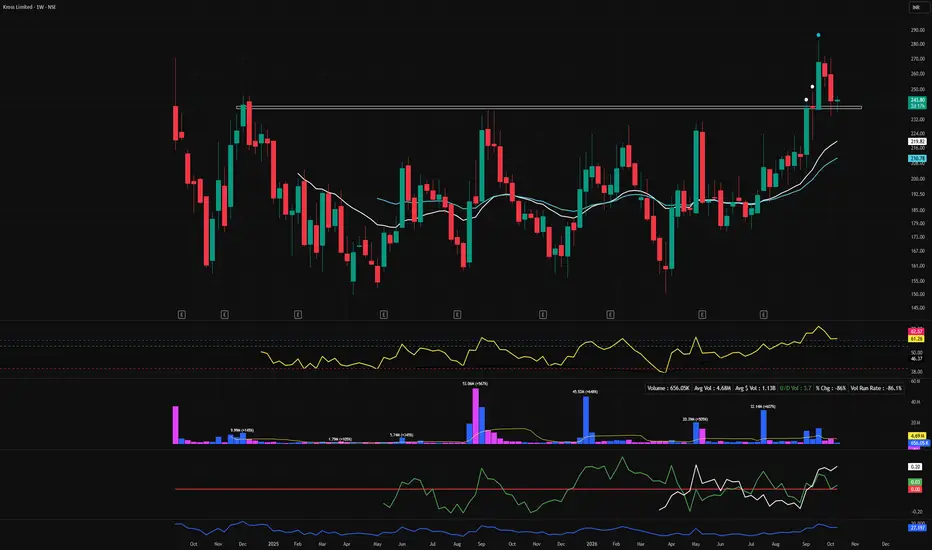
Bouncing Back Trying to bounce back from a weekly support / trend line... RS Positive,RSI weekly in high momentum phase, Volumes drying up on daily. Low Risk to High Reward Proposition. Lets see which way this Krosses :)
NSE:KROSS
by MohitsView
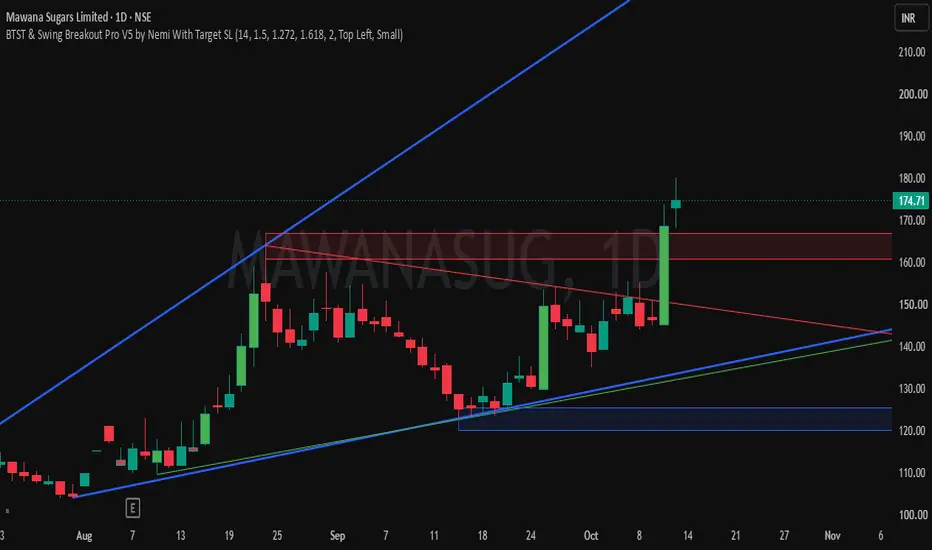
Buy Today, Sell Tomorrow for 3-5% - Daily Breakout SetupMAWANASUG — BTST BREAKOUT SETUP Entry, Stop Loss & Targets Are Clearly Defined — Helping You Plan Your Trade With Confidence. 📊 Stock Strength: 75/100 (Note: Higher score indicates stronger stock conditions, not guaranteed returns.) A bullish breakout has appeared on the 1D timeframe with positive price action and strong volume expansion. 🔄 Trade Type: BTST ──────────────────── 🎯 TRADE LEVELS ENTRY: ₹175 🛑 STOP LOSS ATR SL: ₹158 🎯 TARGETS ₹190 ──────────────────── ⏱ Timeframe: 1 Day 📌
NSE:MAWANASUGLong
by nemichandbhati
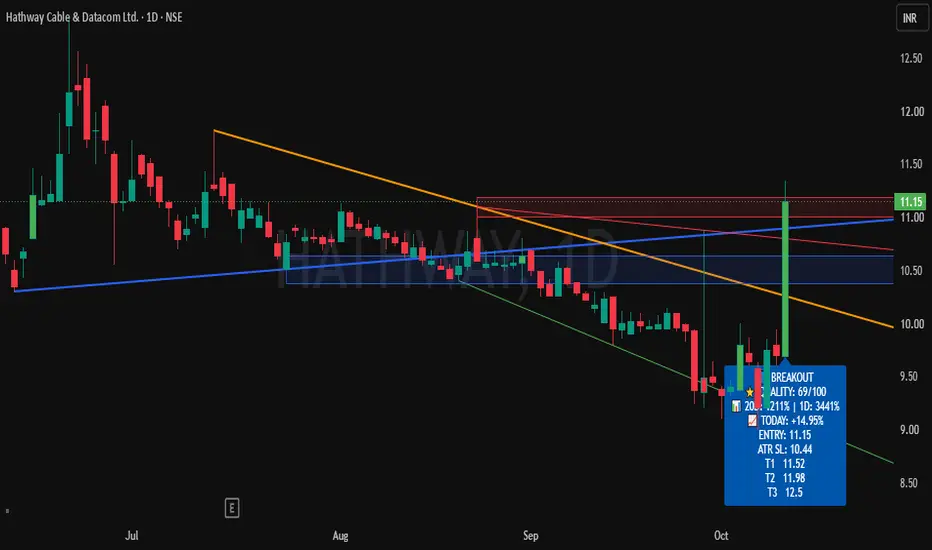
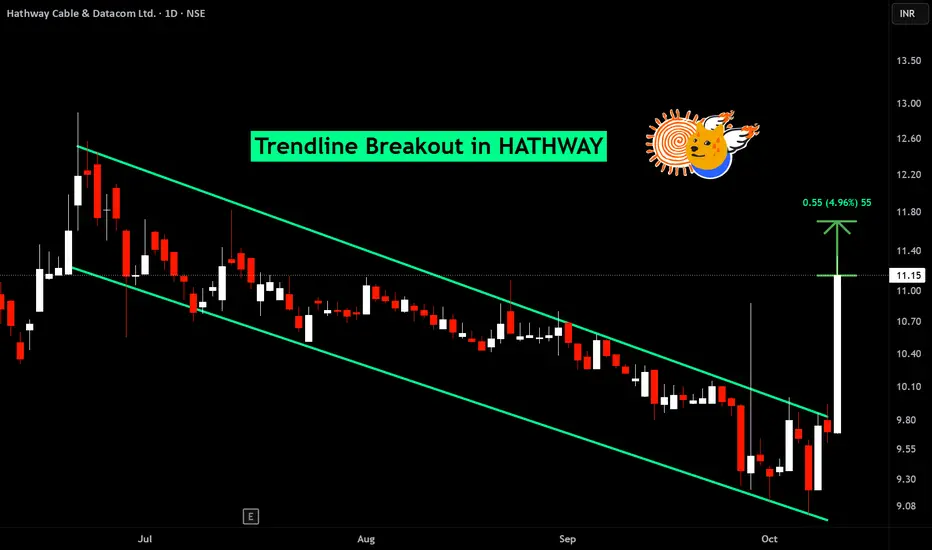
Buy Today, Sell Tomorrow for 3-5% - Daily Breakout SetupHATHWAY — BTST BREAKOUT SETUP Entry, Stop Loss & Targets Are Clearly Defined — Helping You Plan Your Trade With Confidence. 📊 Stock Strength: 69/100 (Note: Higher score indicates stronger stock conditions, not guaranteed returns.) A bullish breakout has appeared on the 1D timeframe with positive price action and strong volume expansion. 🔄 Trade Type: BTST ──────────────────── 🎯 TRADE LEVELS ENTRY: ₹11 🛑 STOP LOSS ATR SL: ₹10 🎯 TARGETS 3–5% ──────────────────── 📈 VOLUME 20D Volume: 211
NSE:HATHWAYLong
by nemichandbhati
2
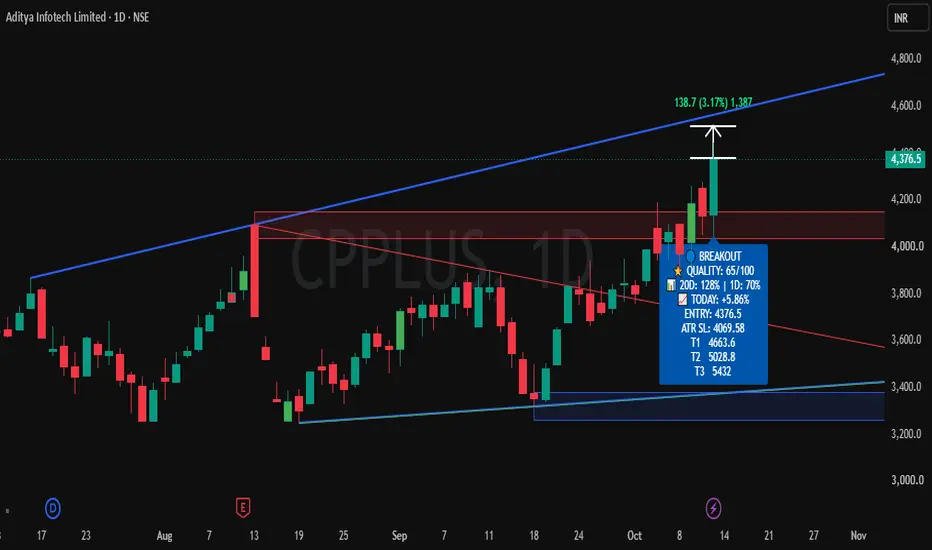
Buy Today, Sell Tomorrow for 3-5% - Daily Breakout SetupCPPLUS — BTST BREAKOUT SETUP Entry, Stop Loss & Targets Are Clearly Defined — Helping You Plan Your Trade With Confidence. 📊 Stock Strength: 65/100 (Note: Higher score indicates stronger stock conditions, not guaranteed returns.) A bullish breakout has appeared on the 1D timeframe with positive price action and strong volume expansion. 🔄 Trade Type: BTST ──────────────────── 🎯 TRADE LEVELS ENTRY: ₹4,377 🛑 STOP LOSS ATR SL: ₹4,070 🎯 TARGETS 3–5% ──────────────────── 📈 VOLUME 20D Volume
NSE:CPPLUSLong
by nemichandbhati
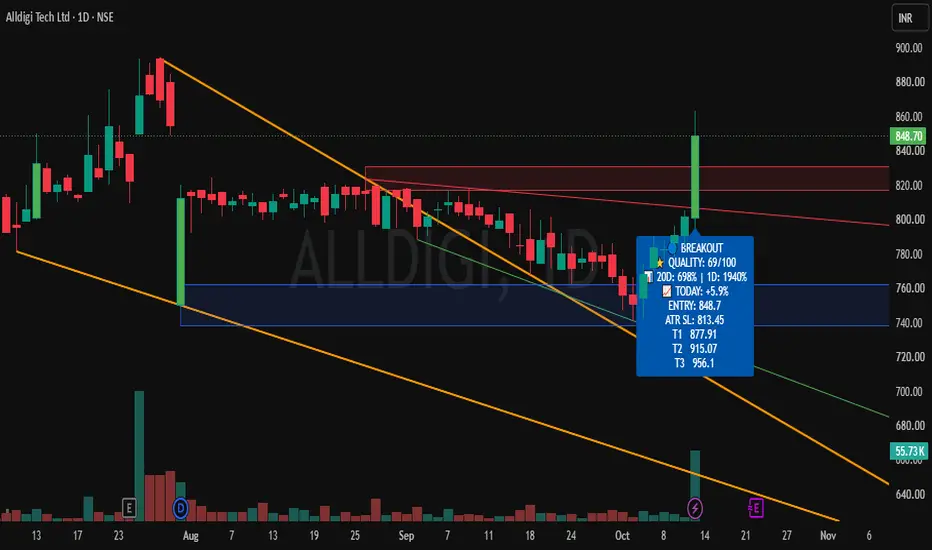
Buy Today, Sell Tomorrow for 3-5% - Daily Breakout SetupALLDIGI — BTST BREAKOUT SETUP Entry, Stop Loss & Targets Are Clearly Defined — Helping You Plan Your Trade With Confidence. 📊 Stock Strength: 69/100 (Note: Higher score indicates stronger stock conditions, not guaranteed returns.) A bullish breakout has appeared on the 1D timeframe with positive price action and strong volume expansion. 🔄 Trade Type: BTST ──────────────────── 🎯 TRADE LEVELS ENTRY: ₹849 🛑 STOP LOSS ATR SL: ₹813 🎯 TARGETS 3-5% ──────────────────── 📈 VOLUME 20D Volume:
NSE:ALLDIGILong
by nemichandbhati
SHRINGARMS Technical Analysis & Trade Setup - Symbol: SHRINGARMS (Shringar House Of Mangalsutra Limited) — Daily Timeframe (NSE) - Current Price: ₹252.25 (+13.6% intraday move) - Market Structure: Following an extended consolidation and base-building range above structural support, the stock has staged a sharp volume-backed expansion out of its accumulation phase. Price action shows strong trend reversal characteristics, pushing decisively past immediate horizontal supply zones toward new highs. Key Tec
NSE:SHRINGARMSLong
by QuantumX-Pro
Updated
BUY TODAY SELL TOMORROW for 5%DON’T HAVE TIME TO MANAGE YOUR TRADES? - Take BTST trades at 3:25 pm every day - Try to exit by taking 4-7% profit of each trade - SL can also be maintained as closing below the low of the breakout candle Now, why do I prefer BTST over swing trades? The primary reason is that I have observed that 90% of the stocks give most of the movement in just 1-2 days and the rest of the time they either consolidate or fall Trendline breakout in PRIMESECU BUY TODAY SELL TOMORROW for 5%
NSE:HATHWAY
by Kapil-Mittal
2
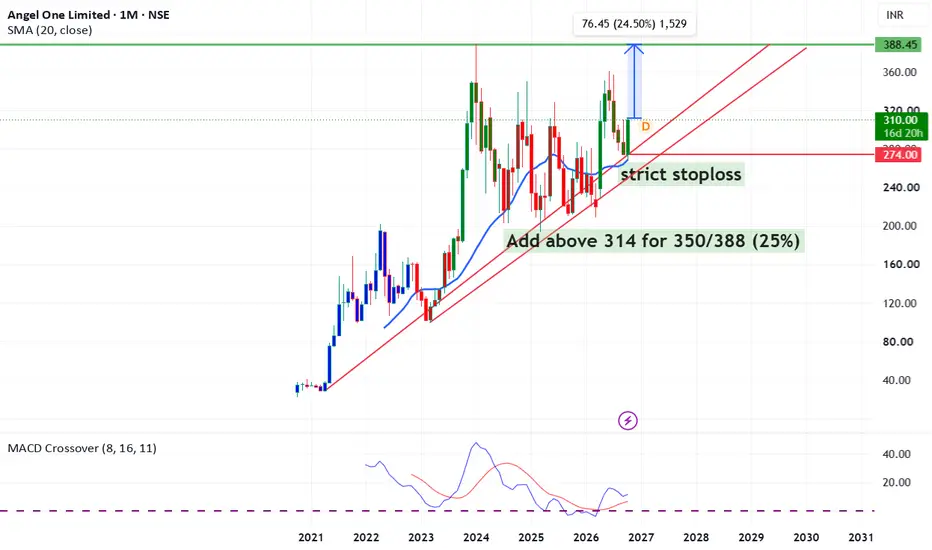
#Angelone monthly bullish on chartAdd above 314 for 350/388 (25%) strict stoploss mark on chart trendline support as stoploss
NSE:ANGELONE
by AsheshBajpaiEsm
Order blockHere, the stock is in a strong uptrend, and after attaining its peak, it started retracing towards the 200 EMA. It reached a bullish order block where it swept liquidity with high volumes, followed by a break of structure towards the bullish side. I would enter on retracement till the previous swing high with a 1:2 risk-reward ratio.
NSE:ETERNAL
by drmukur
Shriram FinanceShriram Finance has shown a strong recovery today, closing at ₹988 after taking support near the ₹920–₹940 zone. The price is attempting to recover above the short-term 10 and 20 EMAs, while the 50, 100 and 200 EMAs will be important for confirming a sustained trend reversal. RSI has improved to 49.48, indicating that momentum is recovering from weaker levels but has not yet turned decisively bullish. ADX is at 41.16, suggesting a strong prevailing trend, although it does not independently confi
NSE:SHRIRAMFINLong
by PowerOfTA
TitanTitan is trading within a rising channel on the weekly chart and is currently taking support near the lower trendline and the 50-week EMA around ₹4,400–₹4,450. After a sharp correction from recent highs, the latest candle indicates a possible recovery from this support zone. However, the recent selling pressure and elevated volume suggest that buying confirmation is important before entering. Entry: Above ₹4,520 on sustained buying momentum Stop Loss: ₹4,350 Target 1: ₹4,800 Target 2: ₹5,000 Ta
NSE:TITANLong
by PowerOfTA
PhysicsWallah (PWL) Technical Analysis: What’s NextPrice trend and market structure Initial decline and base formation : PWL fell towards approximately ₹114 during early September, then attempted to stabilise. Breakout and recovery : In early October, the stock moved sharply upward from the ₹120–₹131 area, crossing previous trading resistance. Recent pullback : The price advanced towards ₹145 before retreating to ₹138–₹139. Pattern interpretation : The recent structure resembles a developing base followed by a high-volume breakout. It is no
NSE:PWL
by shanmurali
Atul elliot wave analysis Title: Market Cycle Update: Post-2021 Secular Bull Run Correction & Current Wave Structure Overview The monumental 13-year secular bull run that commenced in October 2008 and culminated in October 2021 marked the completion of a major multi-year impulse cycle. Following this major peak, the market entered a structural corrective phase characterized by a larger Zigzag (A-B-C) correction pattern. Detailed Wave Breakdown * The Secular Impulse (Oct 2008 – Oct 2021): * This structural advance com
NSE:ATULShort
by Mr_digeshpatel
2
Bajaj Finance (BAJFINANCE): Structural Elliott Wave Analysis 1. Macro Context & The 20-Year Grand Supercycle (Oct 2001 – Sep 2021) The structural journey of Bajaj Finance following the major market low in October 2001 carved out a massive, multi-decade impulse advance that culminated at the September 2021 top. This 20-year secular bull run completed a higher-degree impulse sequence (Grand Supercycle / Wave I or Wave ), driving exponential wealth creation backed by aggressive compounding of assets under management (AUM) and retail lending expansion. 2. Th
NSE:BAJFINANCEShort
by Mr_digeshpatel
1
GRINFRA | Multi-Year Structural SupportTechnical Structure and Price Action On the daily timeframe, GR Infraprojects is currently navigating the lower boundary of a multi-year descending broadening channel, converging directly into a key historical demand pocket around the ₹780 to ₹800 zone. The stock has experienced an extensive multi-quarter correction from its earlier cycle peaks, which has brought the price down into territory where historical buying interest previously emerged during earlier swings. The current stabilization ne
NSE:GRINFRALong
by RA_Dongre_Ji
ADVANCE Technical Analysis & Trade Setup - Symbol: ADVANCE (Advance Agrolife Ltd.) — Daily Timeframe (NSE) - Current Price: ₹146.59 (+0.79% intraday move) - Market Structure: Following a broad base accumulation structure and extended sideways consolidation above major support levels around ₹100–₹110, the stock has initiated a strong upward expansion. The price action demonstrates clear trend reversal momentum, breaking out of its consolidation range to launch a fresh bullish continuation cycle.
NSE:ADVANCELong
by QuantumX-Pro
DATA PATTERNS -> Positional 📊 DATA PATTERNS INDIA LTD DTF — Looks Good ! CMP: ₹4,140 🎯 Trading Levels Add on Dips: Up to ₹4,000 SL CLB: ₹3,900 Target Levels: ₹4,400 → ₹4,600 → ₹4,700 → ₹4,775 View: The setup looks promising. Consider staggered entries on dips while maintaining strict risk management. ⚠️ Disclaimer: This is a technical view, not a guarantee of returns. Market conditions may change. Please assess your risk appetite and follow the stated stop loss. Investments in securities market are subject to market r
NSE:DATAPATTNSLong
by NareshG_SEBI_REGISTERED_RA
Updated
2
Titan Company Ltd. | One hour chart Titan is showing early signs of a potential bullish reversal on the 1-hour chart after consolidating near the ₹4,300–4,330 support zone. The RSI has formed positive divergence, indicating that selling pressure may be weakening and buying momentum is improving. Price has moved above the 20 EMA, suggesting a recovery in short-term momentum. However, the 200 EMA remains a major overhead resistance, so confirmation of a breakout is important before expecting a sustained upward move. Entry: Above ₹
NSE:TITANLong
by PowerOfTA
#radico following uptrend pattern Add for next level 4747 after breakout big blast will review again use stoploss on chart
NSE:RADICO
by AsheshBajpaiEsm
#Rblbank after superb result Ready for RoarAdd above 424 for 500/550 will review after that after decent result declared today use stoploss for traders
NSE:RBLBANK
by AsheshBajpaiEsm
10
123456789101112131415161718192021222324252627282930313233343536373839404142
…999

Made by humans

Select market data provided by ICE Data Services. Select reference data provided by FactSet. Copyright © 2026 FactSet Research Systems Inc.Copyright © 2026, American Bankers Association. CUSIP Database provided by FactSet Research Systems Inc. All rights reserved. SEC filings and other documents provided by Quartr.© 2026 TradingView, Inc.

SOC 2 CompliantGDPR Compliant
More than a product
  • Supercharts
Screeners
  • Stocks
  • ETFs
  • Bonds
  • Crypto coins
  • CEX pairs
  • DEX pairs
  • Pine
Heatmaps
  • Stocks
  • ETFs
  • Crypto coins
Calendars
  • Economic
  • Earnings
  • Dividends
  • IPOs
More products
  • News Flow
  • Portfolios
  • Fundamental Graphs
  • Yield Curves
  • Options
  • Macro Maps
  • Pine Script®
  • MCP Server
Apps
  • Mobile
  • Desktop
Community
  • Social network
  • Wall of Love
  • Refer a friend
  • Creator program
  • House Rules
  • Moderators
Ideas
  • Trading
  • Education
  • Editors' picks
Pine Script
  • Indicators & strategies
  • Wizards
  • Freelancers
  • Marketplace
Tools & subscriptions
  • Features
  • Pricing
  • Market data
  • Gift plans
Trading
  • Overview
  • Brokers
  • Brokers comparison
  • The Leap
Special offers
  • CME Group futures
  • Eurex futures
  • US stocks bundle
About company
  • Who we are
  • Space mission
  • Blog
  • Help Center
  • Careers
  • Media kit
Merch
  • Tarot cards for traders
  • The C63 TradeTime
Policies & security
  • Terms of Use
  • Disclaimer
  • Privacy Policy
  • Cookies Policy
  • Accessibility Statement
  • Trust Center
  • Security tips
  • Bug Bounty program
  • Status page
Business solutions
  • Widgets
  • Charting libraries
  • Lightweight Charts™
  • Advanced Charts
  • Trading Platform
Growth opportunities
  • Advertising
  • Brokerage integration
  • Partner program
  • Education program
Community
  • Social network
  • Wall of Love
  • Refer a friend
  • Creator program
  • House Rules
  • Moderators
Ideas
  • Trading
  • Education
  • Editors' picks
Pine Script
  • Indicators & strategies
  • Wizards
  • Freelancers
  • Marketplace
Business solutions
  • Widgets
  • Charting libraries
  • Lightweight Charts™
  • Advanced Charts
  • Trading Platform
Growth opportunities
  • Advertising
  • Brokerage integration
  • Partner program
  • Education program
Look FirstLook First