AZAD Ascending Triangle Breakout & 52-Week High📊 Azad Engineering: Daily Technical Snapshot – Ascending Triangle Breakout & 52-Week High
📊 STWP Technical Analysis
________________________________________
MARKET STRUCTURE SNAPSHOT | NSE: AZAD
Closing Price: ₹2,476.10 (+₹246.70 | +11.07%)
Core Trend: Strong Uptrend
Market State: Confirmed Breakout in Progress
Price Structure: Price has broken out of an Ascending Triangle after forming a series of higher lows against a declining resistance trendline. The breakout is accompanied by exceptional volume and a strong bullish Marubozu candle, signalling strong buying conviction.
________________________________________
OPERATIONAL PRICE GRID & KEY REFERENCE LEVELS
Model Reference Level: ₹2,491.50
Hard Invalidation Level: ₹2,191.15
Structural Risk: ₹300.35 (12.06%)
Resistance Levels: R1 ₹2,565.07 | R2 ₹2,654.03 | R3 ₹2,816.57
Support Levels: S1 ₹2,313.57 | S2 ₹2,151.03 | S3 ₹2,062.07
Range Structure: Low ₹2,191.15 | High ₹2,816.57
Higher Timeframe Observation Zones: ₹2,565 | ₹2,654 | ₹2,817
________________________________________
MOMENTUM, PARTICIPATION & CPR DATA
Volume Profile: 2.47 Million Shares
Volume Character: Extremely High Relative Participation
RSI: 71.88 (Strong Momentum Zone)
ADX: 21.59 (Trend Development Phase)
ROC: +13.38%
MACD Status: Strong Positive Momentum Structure
CCI: +258.87 (Extended Bullish Momentum)
Stochastic: 97.11 (Extended Momentum Zone)
Current Bias: BUY ON PULLBACKS
CPR State: Bullish Zone | Wide Projected CPR
Today's CPR: Pivot ₹2,257.75 | Top ₹2,243.55 | Base ₹2,271.90
Tomorrow's CPR (Projected): Pivot ₹2,402.55 | Top ₹2,439.30 | Base ₹2,365.75
________________________________________
📚 EDUCATIONAL OBSERVATION
Azad Engineering has delivered a decisive bullish breakout by moving above an Ascending Triangle, a continuation pattern that often reflects sustained accumulation before trend expansion.
The breakout is supported by an exceptionally strong Bullish Marubozu candle, indicating buyers remained in control throughout the trading session with very little selling pressure.
The breakout is further strengthened by exceptionally high trading volume, suggesting broad market participation and increasing conviction behind the move.
The stock has also registered a 52-week breakout, reinforcing the strength of the prevailing uptrend and indicating expanding institutional interest.
Several technical factors are currently aligned in support of the bullish structure.
Momentum indicators continue to remain firmly supportive. The RSI at 71.88 reflects powerful bullish momentum, although it also indicates that the stock has entered an extended momentum zone where short-term volatility may increase. The ROC of +13.38% highlights strong price acceleration, while MACD remains firmly positive. CCI at +258.87 and the Stochastic reading of 97.11 confirm aggressive upside momentum, suggesting that while the trend remains strong, brief consolidations or pullbacks should be considered a normal part of the price cycle. The projected Central Pivot Range (CPR) for the next trading session has shifted sharply higher, with the projected Pivot at ₹2,402.55. A rising and wide CPR generally reflects improving market acceptance of higher prices and often supports trend continuation when accompanied by strong participation. The immediate technical focus remains on the resistance cluster between ₹2,565 and ₹2,654. Sustained trading above these levels could strengthen the existing bullish structure and bring the higher-timeframe observation zone near ₹2,817 into focus. On the downside, ₹2,314 remains the first important support, while the structural invalidation level is positioned at ₹2,191.15. From a business perspective, Azad Engineering manufactures highly engineered precision components for the aerospace, defence, energy and oil & gas sectors. Its focus on high-value engineering products, increasing global customer base and expanding manufacturing capabilities provide a constructive long-term business outlook. Support and resistance levels should be viewed as observation zones rather than predictive targets. Chart patterns, price action, volume analysis, momentum indicators and CPR are educational tools intended to help market participants understand evolving market structure within a disciplined risk-management framework.
________________________________________
⚠️ Disclaimer
This analysis is provided strictly for educational and informational purposes.
This is not financial, investment or trading advice and should not be considered a recommendation to buy or sell any security.
Stock market investments are subject to market risks, including the possible loss of capital.
Past performance, historical observations, chart patterns and technical indicators do not guarantee future results.
Please conduct your own research and consult a SEBI-registered investment adviser before making investment decisions.
STWP assumes no responsibility or liability for any financial loss arising directly or indirectly from the use of this information.  Long
Long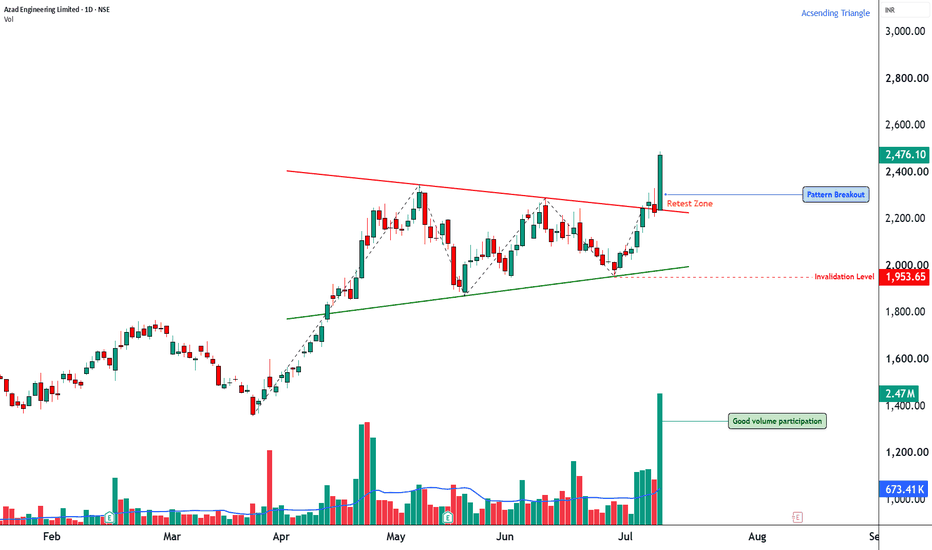
Order Blocks, Hidden Channels and the Base BreakoutsThis post is educational and observational in nature based on historical price action. It is not a forecast or a trading recommendation.
The Bullish Order Block
This is where the story gets interesting. The market fell in three consecutive red candles. The first, then the second, and then the third, which looked like the strongest continuation of selling pressure. But instead of extending the fall, that third candle reversed sharply, closing as a bullish candle that engulfed the range of all three prior red candles combined.
That sudden shift, from what looked like accelerating weakness to a powerful reversal, is what defines a bullish order block. The bottom of that entire sequence marks a major shift in market intent. It tells you that the last wave of aggressive selling was actually being absorbed by buyers the whole time. Whenever price returns to this zone in the future, it is likely to find support, since this is the origin point of the move that followed.
Hidden Parallel Channels
This is a concept I have developed through years of chart reading, and it has become something of a personal signature in how I read breakouts. Hidden channels are small, easily overlooked parallel structures that form directly around a breakout candle or breakout zone. They do not announce themselves, and most traders never notice them sitting there.
When a hidden channel exists around a breakout area, it significantly reduces the reliability of that breakout. Price may appear to break free, pull in buyers, and then get pulled right back inside the channel, turning what looked like a clean breakout into a fakeout.
The Bigger Framework
This is the core principle I follow. Never take a breakout at an all time high. Never take a horizontal breakout in isolation. Always look for a base breakout, meaning a breakout that originates from a demand zone or order block, since that is where genuine accumulation has occurred. And even then, always check for hidden parallel channels around that breakout area, because their presence alone can be enough to turn a high probability base breakout into a low probability fakeout.
 Long
Long
Ola Electric: Waiting for the Final ShakeoutOla Electric continues to trade under pressure, and I believe the stock is approaching a crucial decision zone. Despite negative sentiment, this is not where I want to chase shorts. Instead, I am waiting for one final trap move before considering fresh accumulation.
Technical Overview
CMP: ₹40.39
Trading below the 21 EMA and 55 EMA, indicating short-term weakness.
Price is also below the daily pivot of ₹41.50, keeping bears in control.
Immediate support lies around ₹40.20, followed by ₹39.40–38.10.
My View
I expect one more sharp dip below ₹40 to trigger panic selling and stop-loss hunting.
If that happens and the stock quickly reclaims ₹40 with strong buying, I will start accumulating.
That would indicate sellers are getting exhausted and demand is returning.
Trading Plan
Accumulation Zone:
₹39–40 after a false breakdown.
Confirmation:
Sustained move back above ₹40.
Stop Loss:
₹38 (closing basis).
Targets:
₹44
₹48
₹52
Supporting Factors
Analyst sentiment remains weak, with 75% Sell ratings and no Buy recommendations.
The stock has declined over 10% in the last week, reflecting continued pessimism.
Price is trading below key moving averages, keeping the short-term trend bearish.
Final View
The current trend is still weak, so I am not buying yet.
I will wait for one final shakeout below ₹40. If price reclaims and sustains above that level, I believe the risk-reward improves significantly, and that could mark the beginning of the next recovery leg.
This analysis is for educational purposes only and not financial advice.
#OlaElectric #TechnicalAnalysis #PriceAction #SwingTrading #IndianStockMarket #NSE  Long
Long
 Long
Long
 Long
Long
 Long
Long
 Long
Long
 Long
Long
Swing trading stocks for this weekBusiness Overview:
TVS-E is an ISO certified transaction Automation Products company. It is in the business of IT peripherals, point-of-sale solutions, field support, and infra-managed services for IT. Company's portfolio cater to the entire lifecycle management process, including product ideation, manufacturing, customer support services, warranty management, and end-of-life services.
Product Portfolio:
a) Input Devices: Keyboards (Mechanical & Membrane), Mouse (Optical), Barcode Scanner (1D & 2D) and Document Scanner (Auto document feeder)
b) Computing Devices: Point of Sale (POS) Systems (Desktop, Handheld, Tablet) and Cash Register (Billing Systems)
c) Validation Devices: Cash Counters and Fingerprint Recognition (FPR) Integrated Devices (Keyboards, Tablets, Mobile Printers, and Handheld Devices)
d) Output Devices: Printers (Dot Matrix Printers, Thermal Receipt Printers, Label & Barcode Printers, Passbook Printers) and Consumables (Paper Rolls, Ribbons, Print Heads)
Service Portfolio
Customer Support Services (post-sales services for OEMs)
** a) Services:** Break-fix & Repair Services, Installation & Demo Services, IT Infrastructure Management (IMS), E-Auction Services, Remote Tech Support & Call Center, and Repair.
Service Centers & Support Infrastructure
The company has a robust service and sales network with 500+ service partners, 4,000+ sales partners, and coverage across 18,500+ pin codes. Its customer support infrastructure includes a 130-seat multi-language call center and 5,000+ feet-on-street sales and service representatives.
Service Clients
a) IT & Peripherals: Amazon, HP, DELL, Acer, etc.
b) Bank: SBI, ICICI Bank
c) IT IMS: TVS, ITC, Idemia, etc,.
d) Audio Lifestyle & Consumer Electronics: Harman, Samsung, Amazon
e) Solar: Hinduja Renewables and TATA Power Solar
f) Banking Technology: PhonePe, RazorPay, Hitachi, etc.
Product and Solution cliens
a) Retail: Landmark, Westside, Starbucks, Zudio, Barbecue Nation, Bata, Mcdonalds etc,.
b) Healthcare & Hospitality: Apollo, Cafe Coffee Day, Pizza Hut
c) Manufacturing: TVS and Tata
d) BFSI (Banking, Financial Services, and Insurance): LIC, HDFC, Central Bank of India, Union Bank, ICICI Bank, etc,
e) Government Entities: Bharat Petroleum, Nabard, Indian Railway, etc.
Manufacturing Facility
Co. has its facility at Tumakuru, Karnataka spanning 26.4K sq.m., with two manufacturing blocks with six production lines and a dedicated office block. It has an annual production capacity of 300K keyboards and 560K POS & DMP units. The site includes a Class 10,000 cleanroom for PCBA & display panel repairs and a 130-seat, multi-language customer service center.  Long
Long
 Long
Long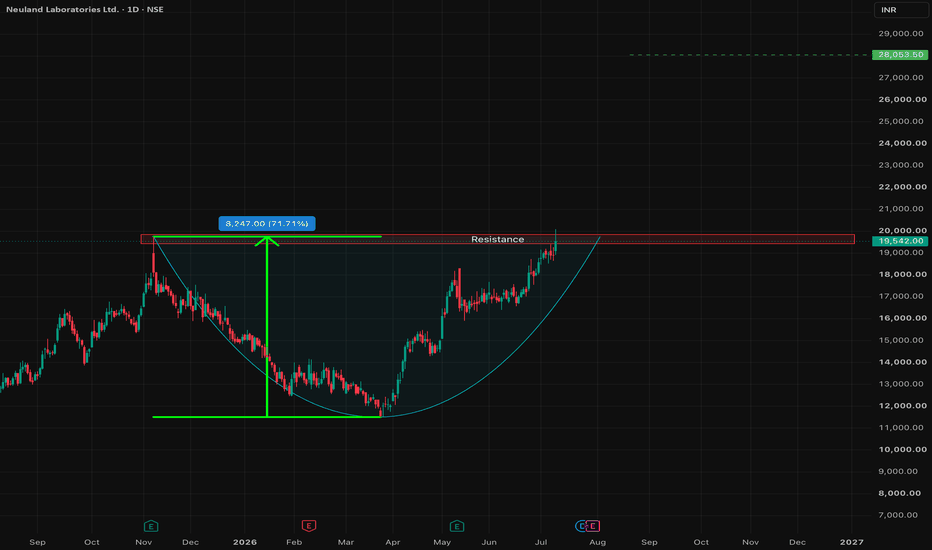
 Long
Long
 Long
Long
 Long
Long
 Long
Long
KAYNES TECHNOLOGY – Daily Chart Analysis The chart indicates that Kaynes Technology is approaching a crucial resistance zone after recovering from a sharp correction. The stock has started forming a higher base and is now testing a level that has rejected price multiple times in recent weeks.
1. Multiple Resistance Tests
The ₹3,380–₹3,420 zone (red dashed line) has acted as a strong resistance.
The stock has attempted to cross this level three times (red arrows) but failed on
2. Important Support Zone
The green arrows highlight a very important support area around:
₹2,950–₹3,050
Every time the stock reached this region:
Buyers entered.
Selling dried up.
Long lower shadows appeared.
Price reversed upward.
Three successful tests of the same support indicate:
Demand is much stronger than supply at these levels.
The more times a support survives, the stronger it generally becomes.
This is the foundation of the current recovery.
Moving Average Analysis
20-Day SMA (Blue)
Current price is trading above the short-term moving average.
This indicates
Short-term momentum is improving.
Buyers are returning.
Pullbacks are getting bought.
The slope of the moving average has also started turning upward.
This is the first positive sign.
200-Day SMA (Orange)
The 200-Day SMA is still far above the current price.
This tells us:
The long-term trend is still not bullish.
Institutional investors usually become much more aggressive once price reclaims the 200-Day moving average.
Until then,
the recovery remains an intermediate rally.
Candlestick Structure
Recent candles show:
Small real bodies.
Higher lows.
Strong closing prices.
Buyers absorbing selling pressure.
Instead of sharp declines,
the stock is now consolidating just below resistance.
This is generally considered healthy.
Markets often pause before making a decisive move.
Technical Concerns
⚠️ The stock remains below the 200-Day SMA, so the long-term trend has not yet turned positive.
⚠️ Resistance around ₹3,400 is still active and has rejected price several times.
⚠️ A breakout without strong volume may lead to another false move.
Kaynes Technology appears to be transitioning from a correction phase into a potential recovery. The repeated defense of the ₹2,950–₹3,050 support zone, coupled with higher lows and improving short-term momentum, suggests that accumulation is underway. The ₹3,380–₹3,420 resistance zone is now the key level to watch. A decisive close above this range, supported by strong volume, would confirm a breakout and could pave the way for a rally toward ₹3,600–₹4,150 in the medium term. Until that confirmation occurs, traders should remain patient, as the stock is still in a consolidation phase just below a critical supply zone.  Long
Long
EXIDEIND - Repeating W-Pattern Structure on the Monthly ChartAfter studying the long-term price behavior of EXIDEIND, one thing stands out clearly — the stock has a tendency to form multiple W-type reversal structures on the higher time frame before moving into the next leg of the trend.
On the monthly chart, this pattern has appeared more than once in the past. Each time the stock went through a phase of correction or consolidation, it gradually built a base, formed a W-like structure, and then resumed the broader uptrend with strength.
What makes the current structure interesting is that price once again appears to be developing in a similar way. The stock has already gone through a meaningful correction from its highs, spent time consolidating, and is now attempting to rebuild strength from lower levels. If this structure continues to play out the way it has in the past, it could act as the foundation for the next major move.
So the main idea here is not to treat this as a short-term setup, but to look at it from a broader structural perspective. The historical behavior suggests that EXIDEIND tends to create these rounded W-type formations over time, and if the current one confirms, the stock may be setting up for another strong leg on the upside.
In short, this chart becomes interesting because of the repetition of structure. The back study shows that similar formations have appeared multiple times before, and the current price action is once again shaping up along those lines.
This is just my technical observation based on historical price structure and pattern behavior. Always manage risk accordingly.  Long
Long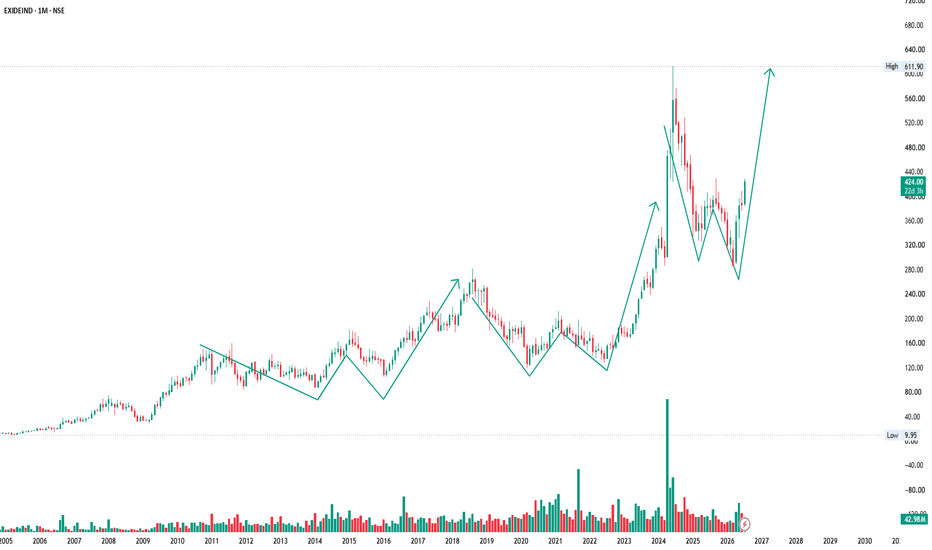
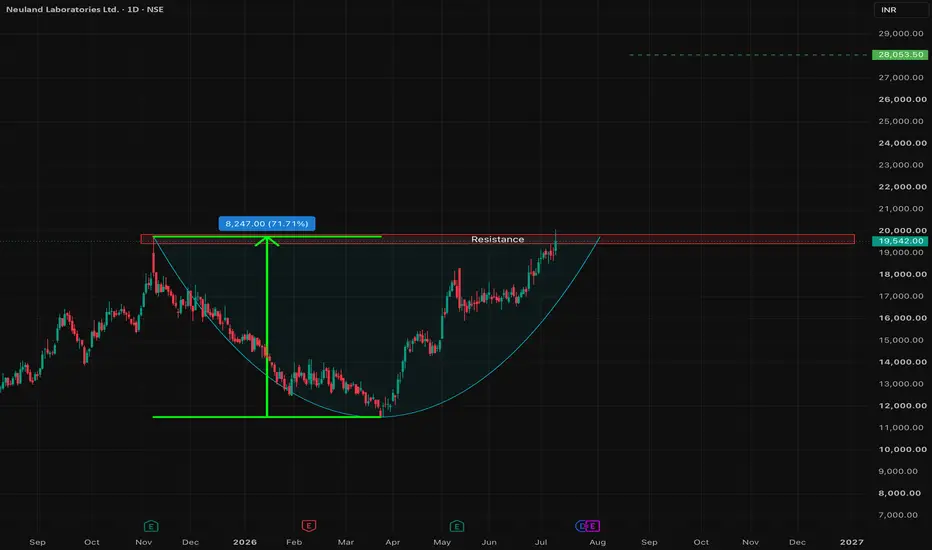
Neuland Laboratories Ltd. (1W) – Multi-Month Breakout Signals📈 Neuland Laboratories Ltd. (1W) – Multi-Month Breakout Signals Fresh Strength 🚀
Neuland Laboratories has delivered a strong breakout after months of consolidation and is now trading near a key resistance zone around ₹19,700. The steady rise, backed by strong bullish candles, suggests that buyers remain firmly in control. The next few weekly closes could determine whether the stock enters a fresh price discovery phase. 👀
🔍 Technical Highlights
✅ Strong Recovery from the Bottom:
After finding support near ₹11,500, the stock has staged an impressive rally, gaining momentum with a clear sequence of higher highs and higher lows.
✅ Testing a Major Resistance Zone:
Price is now challenging the ₹19,700 resistance, a level that previously acted as a significant supply area. A decisive breakout above this zone would strengthen the long-term bullish outlook.
✅ Healthy Bullish Structure:
Unlike a sharp one-time spike, the rally has been gradual and sustainable, indicating consistent buying interest and strong trend development.
🎯 Measured Move Projection:
If the breakout above ₹19,700 is confirmed on a weekly closing basis, the chart projects a potential move towards the ₹28,000 zone, implying an upside of approximately 40% from the breakout level.
⚠️ What Traders Should Watch
🔹 A weekly close above ₹19,700 with sustained momentum would confirm the breakout.
🔹 Any pullback that successfully retests ₹19,700 as support would further validate the bullish trend.
🔹 Chasing extended rallies carries higher risk. Waiting for confirmation or a healthy retracement may offer a better risk-reward opportunity.
📌 Key Levels
🟢 Breakout Level: ₹19,700
🛡️ Major Support: ₹18,000 followed by ₹16,500
🎯 Potential Target: ₹28,000
💡 Final Thoughts
Neuland Laboratories is knocking on the door of a significant technical breakout. The stock has transitioned from a prolonged consolidation into a strong uptrend, and a sustained move above ₹19,700 could trigger the next major rally. As always, confirmation is key before assuming continuation.
📢 Do you think Neuland Laboratories is ready for a fresh all-time breakout, or will it consolidate before the next move? Share your views below! 👇 Long 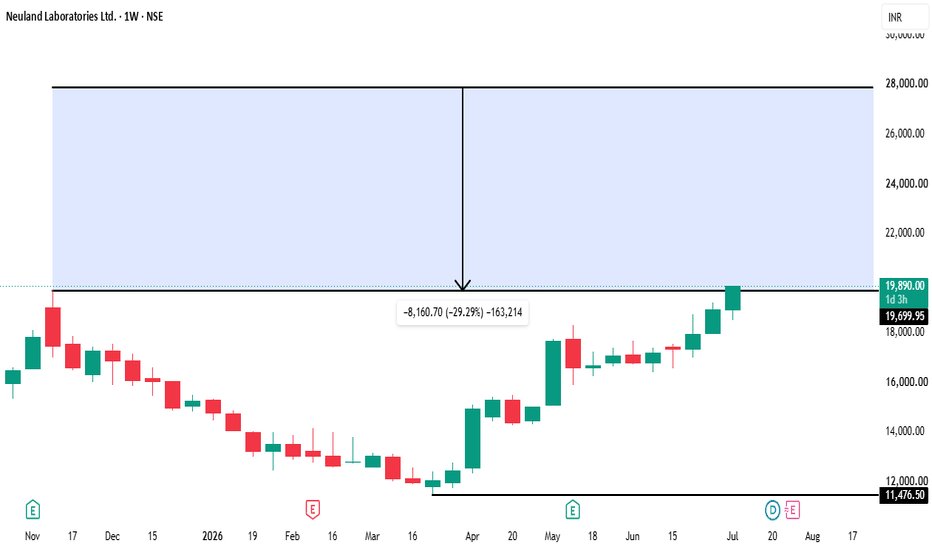
Azad Engineering Ltd. (1W) – Breakout Confirmed📈 Azad Engineering Ltd. (1W) – Breakout Confirmed, Eyes on the Next Expansion 🚀
Azad Engineering has delivered a powerful breakout after a prolonged consolidation, signaling renewed bullish momentum. The stock has reclaimed key resistance levels and is now attempting to continue its upward trajectory, making it one of the charts worth tracking closely. 👀
🔍 Technical Highlights
✅ Breakout Above Major Resistance:
The stock has decisively moved above the ₹2,080 resistance zone, which had capped prices for several weeks. This breakout indicates a strong shift in market sentiment.
✅ Strong Bullish Structure:
Price continues to form higher highs and higher lows, confirming a healthy uptrend. The recent breakout candle reflects aggressive buying interest.
✅ Resistance Turned Support:
The ₹2,080 zone now becomes an important support. Holding above this level would reinforce the bullish structure and improve the probability of further upside.
🎯 Measured Move Projection:
Based on the breakout range, the chart suggests a potential move towards the ₹3,000 zone over the coming weeks if momentum remains intact.
⚠️ What Traders Should Watch
🔹 A weekly close above ₹2,360 would further strengthen the breakout and signal continuation.
🔹 Any pullback that successfully holds ₹2,080 could offer a healthier continuation setup.
🔹 As the stock has rallied sharply, avoid chasing momentum. Waiting for confirmation or a retest can improve the overall risk-reward.
📌 Key Levels
🟢 Immediate Resistance: ₹2,360
🛡️ Major Support: ₹2,080
🎯 Potential Target: ₹3,000
💡 Final Thoughts
Azad Engineering has transitioned from consolidation into a potential expansion phase. With price trading above key support and momentum firmly favoring the bulls, the technical setup remains constructive. The next challenge is sustaining above ₹2,360, which could pave the way for a move towards the ₹3,000 mark.
📢 Do you think Azad Engineering is gearing up for another strong rally, or will it consolidate before the next breakout? Share your thoughts below! 👇 Long 
TCS: Long-Term Investment ThesisTCS: Long-Term Investment Thesis | High-Probability Accumulation Zone Emerging
After correcting nearly 58% from its all-time high, Tata Consultancy Services (TCS) is approaching a technically significant demand area where long-term investors should start paying attention.
The chart presents an interesting combination of strong historical support and a large Inverted Head & Shoulders (IH&S) projection, making this a compelling risk-reward setup for investors with a multi-year horizon.
Why this zone matters
🔹 1. Major Historical Support
The ₹1,800–1,900 region has acted as an important demand zone on the monthly timeframe. Price is now revisiting this area after a prolonged decline, where buyers have previously stepped in.
🔹 2. Inverted Head & Shoulders Projection
The previous multi-year Inverted Head & Shoulders breakout projected a target zone around ₹1,200–1,560 (shown on the chart).
Although the stock rallied well after the breakout, the current correction is bringing price back into the broader projected target area. Such retests of major breakout structures are often seen in long-term bull markets before the next expansion phase.
Rather than viewing this zone as weakness, long-term investors may consider it a potential accumulation region if price continues to stabilize.
🔹 3. Risk-Reward Improving
After a correction of almost 60%, downside risk begins to compress while long-term upside potential gradually improves. This doesn’t guarantee an immediate reversal, but it significantly improves the investment equation compared to buying near the highs.
⸻
Investment Strategy
✅ Investors may consider accumulating gradually rather than deploying capital all at once.
A staggered approach allows participation if the stock reverses while also leaving room to average if volatility continues.
Key Levels
Accumulation Zone: ₹1,800–1,950
Stronger Value Zone: ₹1,200–1,560 (IH&S target area shown on chart)
Long-Term View: Bullish while the broader support structure remains intact.
⸻
Markets rarely reward chasing strength—they often reward patience during periods of pessimism. TCS is approaching a region where long-term investors can begin watching for evidence of demand returning.
As always, combine technical analysis with your own research, earnings outlook, and risk management before making any investment decision.
⸻
If you like to see more posts, please do show appreciation by liking this post and following me on:
in.tradingview.com/u/lovishkhanduja/  Long
Long
 Long
Long