Adani EnterprisesSwing Trading Levels
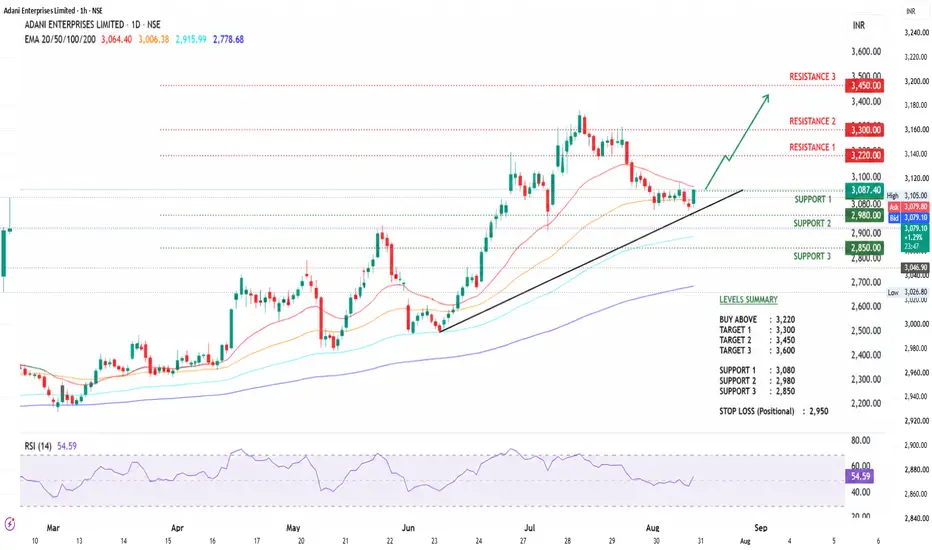
Buy Above: ₹3,220 (confirmation breakout)
Immediate Resistance:
₹3,220
₹3,300
₹3,450
Immediate Support:
₹3,080
₹2,980
₹2,850
Swing Targets
Target 1: ₹3,300
Target 2: ₹3,450
Target 3: ₹3,600 (if momentum remains strong)
Stop Loss
Aggressive: ₹3,080
Positional: ₹2,950
Technical View
Trend: Bullish
RSI is close to the higher zone, indicating strong momentum but also a possibility of short-term profit booking.
Price is trading above the 20, 50, 100 and 200-day moving averages, which supports the broader bullish trend.
Trading Plan:
Wait for a decisive breakout above ₹3,220 with strong volume for fresh long positions.
If the stock pulls back toward ₹3,080–₹2,980 and shows buying interest, that zone can also offer a favorable swing entry.
A sustained move below ₹2,950 would weaken the current bullish setup.
There has also been positive fundamental news recently, including fresh capital raising and expansion into low-carbon chemicals, which may support longer-term sentiment, although technical levels should still guide trade execution. JSW Steel JSW Steel – Key Levels
Support Zones
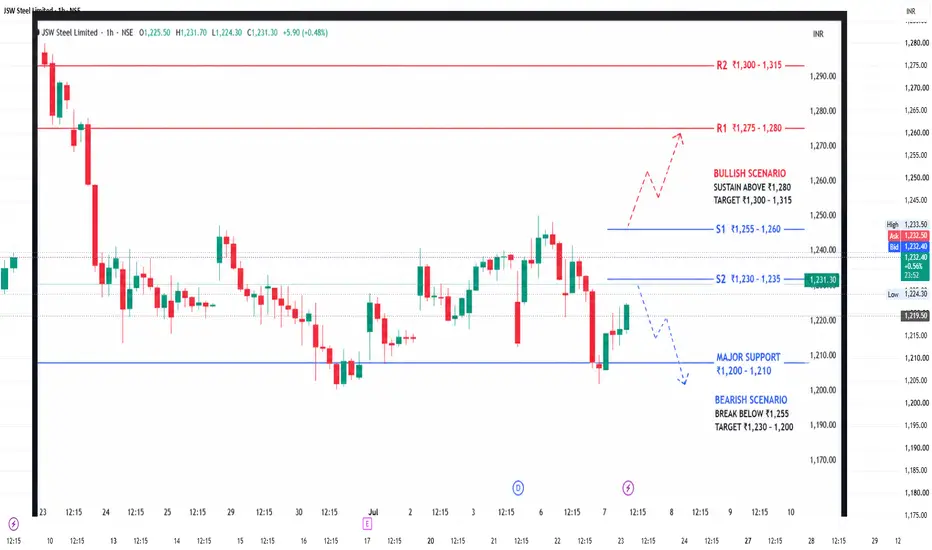
S1: ₹1,255–1,260
S2: ₹1,230–1,235
Major Support: ₹1,200–1,210
Resistance Zones
R1: ₹1,275–1,280
R2: ₹1,300–1,315
Major Breakout: Above ₹1,315 for fresh momentum.
Trading View
Bullish Scenario
Sustaining above ₹1,280 can trigger a move toward ₹1,300–1,315.
A breakout above ₹1,315 may extend the rally toward higher highs.
Bearish Scenario
A fall below ₹1,255 may lead to a decline toward ₹1,230.
Losing ₹1,200 would weaken the current bullish structure.
Trend
Short-term: Bullish
Swing trend: Bullish while above ₹1,230
Best buying zone: Near support after confirmation rather than chasing near resistance. Hindalco IndustriesHindalco Industries Key Support Levels
Immediate Support: ₹962
Strong Support: ₹954-955
Major Support: ₹945-946
Key Resistance Levels
Immediate Resistance: ₹978-983
Strong Resistance: ₹989-990
Major Resistance: ₹999-1,018
Technical Indicators
Indicator Status
RSI ~43-50 (Neutral to Weak)
MACD Slightly Negative
20 DMA Price below
50 DMA Price below
200 DMA Price above
The stock is trading below its short- and medium-term moving averages but remains above its 200-day moving average, suggesting the long-term trend is still intact while short-term momentum remains weak.
Trading View
Bullish Scenario
Buy only after a sustained move above ₹990-1,000 with strong volume.
Upside targets:
₹1,030
₹1,070
₹1,120
Bearish Scenario
If ₹960 breaks decisively:
Next supports are around ₹945 and ₹930.
Weakness could accelerate.
Swing Trading Plan
Buy Zone: ₹950-965 (only if price shows reversal)
Stop Loss: ₹940
Target 1: ₹990
Target 2: ₹1,020
Target 3: ₹1,060
Risk-reward improves if entries are closer to the support zone rather than chasing strength.
Fundamental Outlook
Hindalco remains one of India's leading aluminium producers, and its long-term outlook continues to be supported by:
Aluminium demand from infrastructure, EVs, and renewable energy.
Recovery expectations for its subsidiary Novelis.
However, the sector could face increased competition following the announced entry of the Adani–IHC joint venture into the aluminium business.
Overall Rating
Short-term (1–4 weeks): Neutral to slightly bearish.
Medium-term (3–6 months): Constructive if it reclaims ₹1,000.
Long-term (1–3 years): Bullish, assuming aluminium demand and earnings remain supportive. UltraTech Cement🔑 Key Resistance Levels
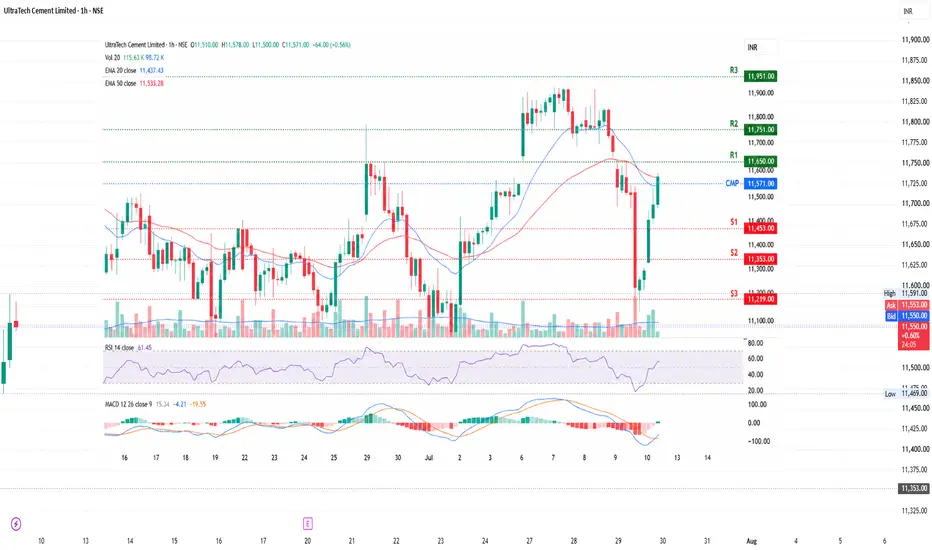
R1: ₹11,650
R2: ₹11,751 (recent swing high)
R3: ₹11,950–11,975 (major breakout zone)
🛡️ Key Support Levels
S1: ₹11,453
S2: ₹11,353
S3: ₹11,219 (strong demand zone)
🎯 Trading Levels
Bullish Setup
Sustained move above ₹11,650 can target:
₹11,751
₹11,850
₹11,950
Bearish Setup
Fall below ₹11,453 may lead to:
₹11,353
₹11,219
📊 Current View
CMP: ~₹11,571
Immediate bias: Mildly Bullish
Momentum improves only after a decisive close above ₹11,650.
As long as price remains above ₹11,453, buyers retain a near-term advantage.
⭐ Key Zone to Watch
Support Zone: ₹11,450–11,500
Resistance Zone: ₹11,650–11,750
Breakout Level: Above ₹11,751
Breakdown Level: Below ₹11,453 Bajaj Finance📊 Key Support Levels
₹1,000–1,010 – Immediate support (psychological and pivot zone)
₹990–995 – Strong buying zone
₹975–980 – Major support; a close below this can weaken the trend.
🚀 Resistance Levels
₹1,025–1,035 – Immediate resistance
₹1,040–1,050 – Breakout zone
₹1,080–1,100 – Positional target if the breakout sustains.
📈 Trading View
Bullish above: ₹1,035
Targets: ₹1,050 → ₹1,080 → ₹1,100
Bearish below: ₹990
Downside targets: ₹975 → ₹955
📌 Technical Outlook
The long-term trend remains positive, although the stock has recently seen some profit booking after approaching its 52-week high.
A sustained move above ₹1,035–1,050 would strengthen bullish momentum.
Traders should watch for volume confirmation on any breakout  Long
Long
 Long
Long
Capri Global Capital Ltd. (1W) – Breakout at the Edge 📈 Capri Global Capital Ltd. (1W) – Breakout at the Edge of a Major Resistance 🚀
Capri Global Capital has staged an impressive recovery after months of accumulation and is now approaching a critical resistance zone around ₹252. The price action suggests that bulls are firmly in control, but the next few weekly candles will determine whether this move evolves into a larger trend. 👀
🔍 Technical Highlights
✅ Strong Bullish Momentum:
The stock has rallied sharply from the ₹150 support zone, forming a sequence of higher highs and higher lows, a classic sign of a strengthening uptrend.
✅ Approaching Multi-Month Resistance:
Price is now testing the ₹252 resistance, a level that previously acted as a supply zone. A decisive breakout above this level could attract fresh momentum buying.
✅ Healthy Trend Structure:
The recent rally has been supported by consistent bullish candles, indicating sustained buying interest rather than a one-day spike.
🎯 Measured Move Projection:
If the breakout above ₹252 is confirmed on a weekly closing basis, the chart projects a potential move towards the ₹350–₹355 zone, representing an upside of nearly 40% from the breakout level.
⚠️ What Traders Should Watch
🔹 A weekly close above ₹252 with follow-through buying would confirm the breakout.
🔹 A successful retest of ₹252 as support would further strengthen the bullish outlook.
🔹 If the stock fails to sustain above resistance, expect a short-term consolidation before the next directional move.
📌 Key Levels
🟢 Breakout Level: ₹252
🛡️ Major Support: ₹220 followed by ₹150
🎯 Potential Target: ₹350–₹355
💡 Final Thoughts
Capri Global Capital is at a technically significant point. After emerging from a prolonged consolidation, the stock is knocking on the door of a major resistance zone. A confirmed breakout could mark the beginning of a fresh medium- to long-term uptrend, while disciplined traders may prefer waiting for confirmation rather than chasing the rally.
📢 Will ₹252 finally give way and open the path toward ₹350+, or will the stock pause for another consolidation? Share your views below! 👇  Long
Long
Ruby Mills Ltd. (1W) – Multi-Year Breakout Loading?📈 Ruby Mills Ltd. (1W) – Multi-Year Breakout Loading? 🚀
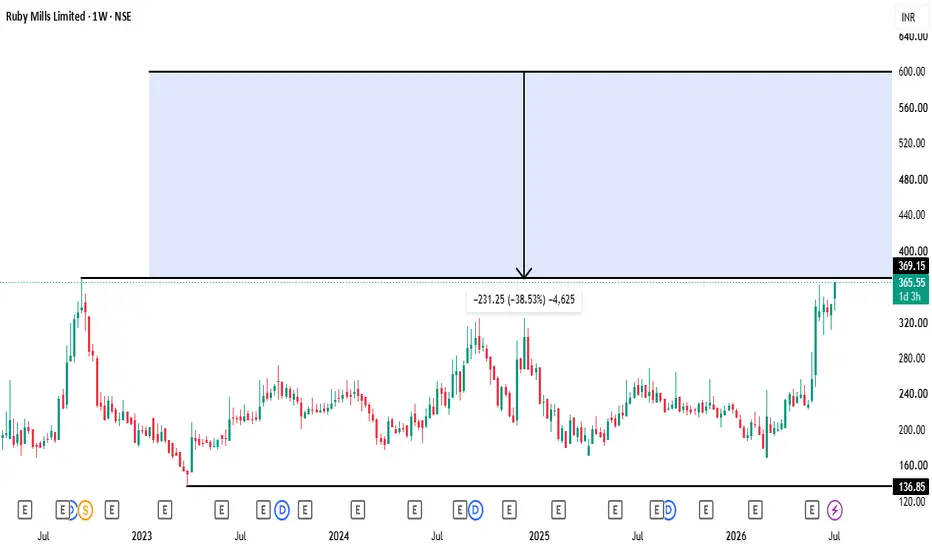
After spending several years in a broad consolidation, Ruby Mills Ltd. has staged an impressive comeback and is now testing a major resistance zone around ₹369. This level has historically acted as a strong supply area, making the coming weeks crucial for the stock. 👀
🔍 Chart Highlights
✅ Strong Recovery:
The stock has rallied sharply from its 2026 lows, showing renewed buying interest and a clear shift in momentum.
✅ Major Resistance Test:
Price is now challenging the ₹369 resistance, a level that previously rejected buyers. A decisive weekly close above this zone could trigger the next leg of the uptrend.
✅ Bullish Price Structure:
The formation of higher highs and higher lows indicates that buyers are gradually taking control, improving the long-term technical outlook.
🎯 Measured Move Target:
If the breakout is confirmed, the measured move points towards the ₹600 zone, offering a potential upside of nearly 60% from the breakout level.
⚠️ What Traders Should Watch
🔹 A strong weekly close above ₹369 with sustained buying would validate the breakout.
🔹 If price faces rejection at resistance, expect a healthy pullback or consolidation before another breakout attempt.
🔹 Avoid chasing extended moves—waiting for confirmation or a successful retest often provides a better risk-reward setup.
📌 Key Levels
🟢 Breakout Level: ₹369
🛡️ Major Support: ₹320–₹330
🎯 Potential Target: ₹600
💡 Final Thoughts
Ruby Mills is approaching a make-or-break technical level. A confirmed breakout above multi-year resistance could signal the beginning of a fresh long-term uptrend. However, patience is key—confirmation always outweighs anticipation.
📢 Are you watching this breakout? Do you expect ₹369 to be cleared this time, or will the stock consolidate first? Share your view below! 👇  Long
Long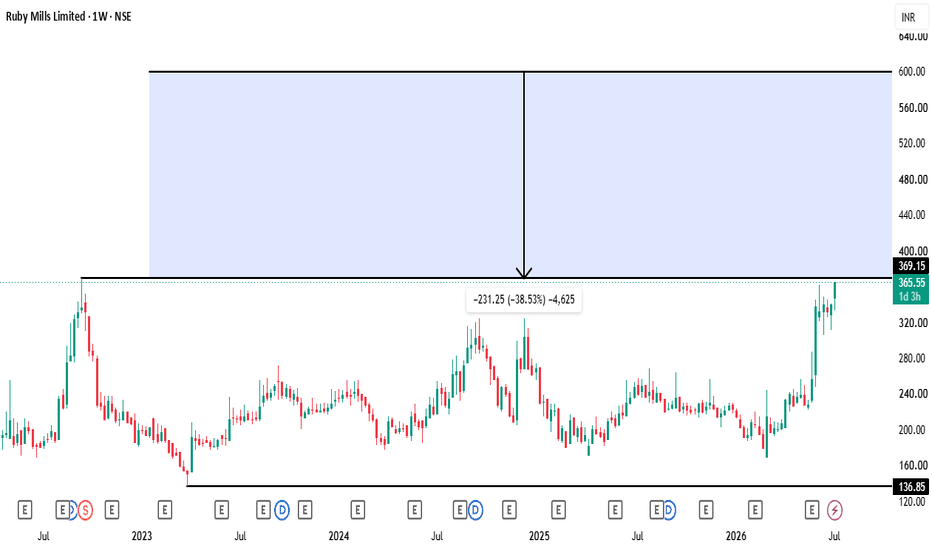
 Long
Long
Insolation Energy LtdDate 09.07.2026
Insolation Energy
Timeframe : Day Chart
About:
Insolation Energy Ltd is engaged in the business of manufacturing solar panels and modules of high efficiency of various sizes. The company's 200 MW SPV Module manufacturing unit is located in Jaipur, spread over more than 60,000 Sq. ft area with the latest machinery
Market Position:
The company holds a prominent position as the largest manufacturer of solar panels, batteries, and inverters in North India, based in Jaipur, Rajasthan. It is ranked amongst the top-10 position PV manufacturers in India
Distribution Network:
The company has completed 500+ projects and maintains a network of 700+ channel partners across 100+ districts
Blockbuster Fiscal Performance (FY26):
(1) Revenue/Turnover: Rose 61.02% YoY to ₹2,163.52 Cr
(2) Net Profit : Surged 59.34% to ₹200.47 Cr
(3) EBITDA: Jumped 76.50% to ₹304.62 Cr
Robust Financial Health:
The firm was ranked 1st among its global listed peers for financial stability by Dutch-German consultancy firm SINOVOLTAICS. It was also featured in Forbes India’s 'Best Under A Billion' list
Massive Order Book:
Possesses a robust executable pipeline of over ₹2,500+ Crore spread across rooftop solar, government distribution schemes, and EPC execution
Why it is a good long-term bet:
India's push to reach 500 GW of renewable energy by 2030 guarantees multi-year demand tailwinds. Once Insolation’s 4.5 GW solar cell factory goes live in late 2026, its dependence on China drops significantly, and profit margins will structurally expand.
Regards,
Ankur Singh  Long
Long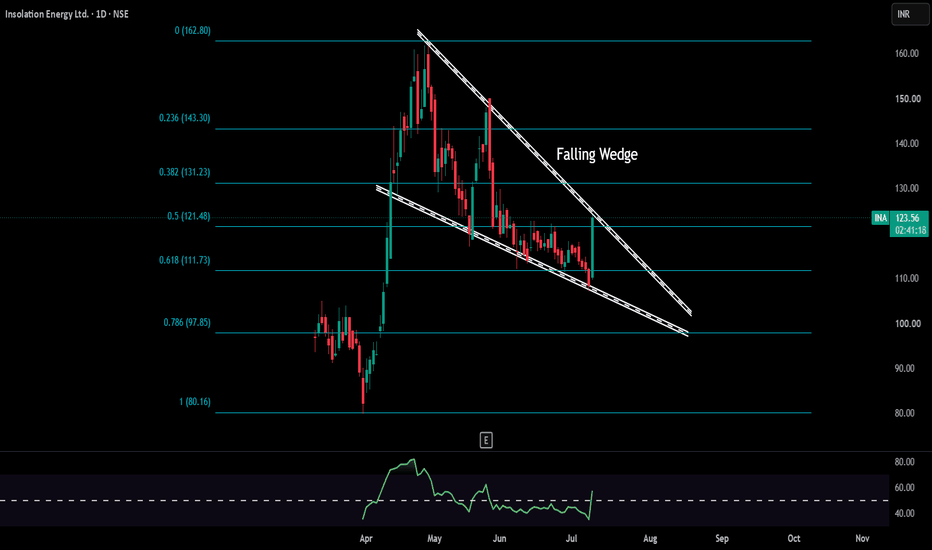
 Long
Long
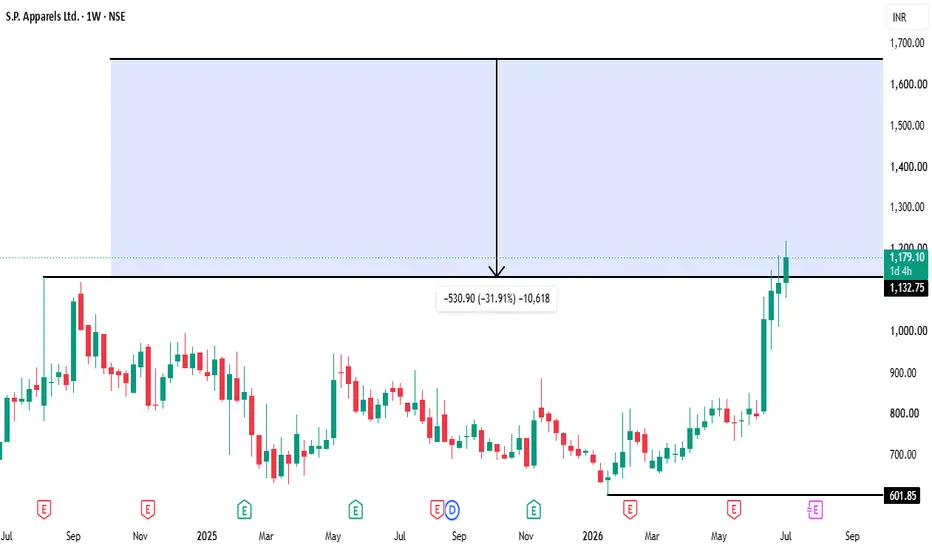
S.P. Apparels Ltd. (1W) – Breakout or Beginning of a Bigger Tren📈 S.P. Apparels Ltd. (1W) – Breakout or Beginning of a Bigger Trend? 🚀
After spending nearly two years in consolidation and correction, S.P. Apparels has finally delivered a strong bullish breakout with exceptional momentum. 💥
🔹 Key Observations:
✅ Price has broken above the long-standing resistance around ₹1,130, a level that previously acted as a major supply zone.
📊 The breakout is supported by large bullish weekly candles, indicating aggressive institutional buying.
📈 Higher highs and higher lows are now visible, confirming a shift in the long-term trend.
🎯 The measured move projection from the base suggests a potential upside towards the ₹1,650–₹1,700 zone if momentum continues.
⚠️ What to Watch Next:
A successful retest of ₹1,130 as support would strengthen the bullish case.
Sustaining above the breakout level is crucial. A failure to hold could result in a temporary pullback before the next move.
Momentum traders may look for continuation patterns instead of chasing extended candles.
💡 Trading Plan:
📌 Resistance turned support: ₹1,130
📌 Bullish above: ₹1,130
📌 Potential Target Zone: ₹1,650–₹1,700
📌 Risk management remains essential—avoid FOMO and wait for confirmation if entering fresh positions.
Overall, the chart has transitioned from a prolonged accumulation phase into a potential long-term expansion phase. The coming weeks will reveal whether this breakout develops into a sustained uptrend. 📈🔥
What are your thoughts? Is this the start of a new bullish cycle or just a breakout rally? Share your view below! 👇  Long
Long
CLEAN | Chemical Turnaround Watch, ₹820–860 Key Resistance ZoneClean Science & Technology Ltd. (CLEAN) is showing signs of base formation after a prolonged correction, but the chart still needs stronger confirmation before calling it a full trend reversal.
On the higher timeframe, the stock appears to be attempting a recovery from the lower support region. The broader ₹650–735 zone remains important because this is the area where buyers seem to be defending structure. If this support belt continues to hold, the probability of a medium-term recovery attempt remains open.
At the same time, the real test is on the upside. The ₹820–860 zone looks like the main resistance / supply region. This zone may decide whether the stock remains in a range-bound recovery or begins a stronger structural turnaround.
So for now, this is not a confirmed breakout chart yet. It is more of a chemical-sector turnaround watch where the next move depends on whether price can sustain above the overhead resistance zone with better participation.
My view:
The chemical / specialty chemical sector does have turnaround potential over time if margin pressure eases, export demand improves, and sentiment normalizes. But in charts like CLEAN, it is better to wait for price confirmation, because sector recovery stories often take time to translate into sustained stock moves.
Key levels:
Support zone: ₹650–735
Near resistance: ₹820–860
Stronger improvement only if: price sustains above this resistance belt
Risk area: failure to hold the broader support zone may keep the stock in a weak range
For now, CLEAN looks like a recovery attempt / turnaround watch, where possible path only if structure sustains.
Shared only for educational study and chart-tracking purpose. This is not a buy/sell recommendation or investment advice. I am not a SEBI-registered advisor. Please do your own research or consult a qualified financial advisor before taking any investment decision. I am not responsible for any profit or loss based on this post.
#CLEAN #CleanScience #CleanScienceAndTechnology #ChemicalStocks #SpecialtyChemicals #NSE #ChartStudy #WeeklyChart #SupportAndResistance #TrendAnalysis #StockMarketIndia STANLEY | Base Formation Near Support, ₹172 Weekly Breakout WatcAfter a long corrective phase, Stanley Lifestyles looks like it is trying to build a base near an important support area.
On the broader structure, the ₹140–125 zone stands out as a strong support region. Price has started stabilizing after a prolonged decline, and short-term momentum is showing early improvement. However, the larger reversal is still not confirmed.
What stands out
Stock is attempting to hold above the recent base area.
Broader correction seems to be slowing down.
Weekly momentum is improving from weak levels.
The structure may turn stronger only if price starts sustaining above nearby resistance.
Key levels to track
Support: ₹140–142
Major support zone: ₹125–140
Near resistance: ₹160
Trend-change / breakout watch: ₹172 weekly closing
View
For now, this looks more like a base formation and recovery watch than a confirmed breakout.
If the stock gives a strong weekly close above ₹172, then the structure may start shifting in favor of a broader uptrend attempt. In that case, ₹190–210 could become the next important zone to watch only if the structure sustains.
If price fails to reclaim that band, the stock may continue to move in a range and keep revisiting the support area.
Conclusion:
₹140–125 remains the key support base, while ₹172 is the important weekly confirmation level for a possible uptrend.
Shared only for educational study and chart-tracking purpose. This is not a buy/sell recommendation or investment advice. I am not a SEBI-registered advisor. Please do your own research or consult a qualified financial advisor before making any investment decision.
#STANLEY #StanleyLifestyles #NSE #WeeklyChart #ChartStudy #TechnicalIndicators #SupportAndResistance #TrendAnalysis #IndianStocks #StockMarketIndia Layered Structures: Multi patterns formations Explained The Ascending Parallel Channel
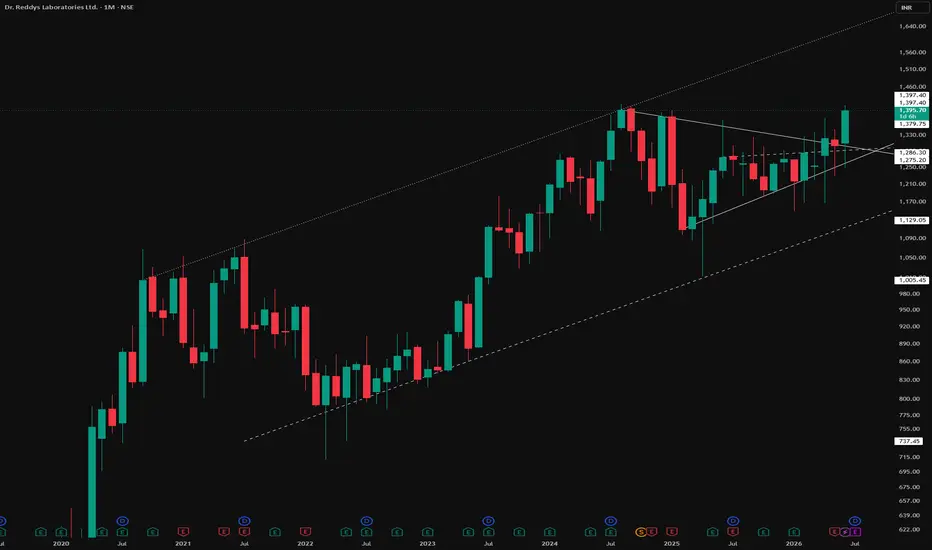
Marked by the dotted lines, this is a rising channel — two parallel trendlines, both sloping upward, containing price action between them. It reflects a steady, structured uptrend where price oscillates between a rising support line and a rising resistance line.
The Symmetrical Triangle Within It
Inside this channel, a symmetrical triangle has formed — converging highs and lows compressing into a tighter range. What stands out here is its location: this triangle consolidated near the upper half of the channel, not near the base.
Why Location Matters
This is the core lesson of this chart. The same pattern can behave very differently depending on where it forms inside a larger structure:
1) When consolidation happens near the bottom of a channel, a breakout from there is often referred to as a base breakout — these tend to be the cleaner, more reliable setups to observe, since price is breaking out from a zone of accumulated support.
2) When consolidation happens near the top of a channel, a breakout from there is more of a horizontal top breakout — these are generally less favorable for trading and are better suited for observation only.
The Bigger Picture
This chart is a reminder that multiple patterns often exist within each other, and recognizing not just the pattern but where it sits inside the broader structure is what separates surface-level pattern reading from a deeper understanding of price behavior.
Disclaimer: This post is for educational and informational purposes only. It does not constitute financial advice, a forecast, or a recommendation to buy, sell, or hold any security. Please conduct your own research and consult a licensed financial advisor before making any investment decisions.
MEDANTA | Hospital Stock Near Weekly Breakout — ₹1,400 Zone WatcGlobal Health Ltd — Weekly Chart Study
NSE: MEDANTA
MEDANTA is showing a strong weekly recovery attempt after taking support from lower levels. Price has recovered well and is now trading near an important trendline and breakout confirmation zone.
Chart observations:
Price is holding above the important ₹1,300 support area.
Weekly RSI is in a strong zone, showing improving momentum.
Weekly MACD is improving, suggesting that downside pressure is reducing.
Monthly structure is also improving after the recent recovery.
The key breakout confirmation zone is near ₹1,380–1,400.
The key zone to track now is the ₹1,380–1,400 area. Sustained weekly closing above this zone can strengthen the breakout structure further. On the upside, important resistance zones are visible near ₹1,500–1,520, followed by ₹1,850 as a broader Fibonacci reference zone.
On the downside, ₹1,300–1,310 remains the important near support zone. Below that, ₹1,240 and ₹1,175 are broader support zones to track. If price fails to sustain above ₹1,300, the current breakout attempt may need more time.
Key levels:
Near support: ₹1,300–1,310
Major support: ₹1,240 / ₹1,175
Breakout confirmation zone: ₹1,380–1,400
Resistance watch: ₹1,500–1,520
Broader Fibonacci reference: ₹1,850
For now, MEDANTA looks like a healthcare-sector breakout watch setup, but stronger confirmation will depend on sustained weekly closing above ₹1,380–1,400 with healthy volume.
Shared only for educational study and chart-tracking purpose. This is not a buy/sell recommendation or investment advice. I am not a SEBI registered advisor. Please do your own research or consult a qualified financial advisor before taking any investment decision. I am not responsible for any profit or loss based on this post.
#MEDANTA #GlobalHealth #HospitalStocks #HealthcareStocks #NSE #WeeklyChart #BreakoutWatch #ChartStudy #TechnicalAnalysis #StockMarketIndia  Short
Short
 Long
Long
 Long
Long
Reversal in Kalyan jewellers - Potential uptrendAt the **current market price (CMP) of ₹434**, the setup becomes more interesting because the stock has bounced nearly **30% from the major support around ₹337**, but it is **still below the long-term descending trendline**. Here's an updated TradingView idea.
---
# Kalyan Jewellers | Bulls Defend Key Support, Eyes on Trendline Breakout
**Timeframe:** Daily
**Bias:** Neutral to Bullish
**CMP:** ₹434.35
After a prolonged correction from **₹793**, Kalyan Jewellers appears to be showing early signs of accumulation. The recent sharp recovery from the **₹327–340 demand zone** came with one of the strongest volume spikes in months, suggesting buyers have stepped back into the market.
However, the broader trend remains bearish as price continues to trade below the long-term descending trendline. The next few sessions will be crucial in determining whether this is just a relief rally or the beginning of a trend reversal.
### Technical Observations
* Strong demand zone respected near **₹327–340**
* Price has formed a higher low after the recent bounce.
* Today's strong bullish candle closed near the day's high with significantly above-average volume.
* Momentum is improving, but the falling trendline remains the key hurdle.
### Resistance Levels
* **₹445–450:** Immediate resistance
* **₹470–480:** Trendline resistance
* **₹512:** Fibonacci 38.2% retracement
* **₹565:** Fibonacci 50% retracement
* **₹620:** Fibonacci 61.8% retracement
### Bullish Scenario
A decisive daily or weekly close above **₹470–480** with sustained volume would confirm a breakout from the descending trendline and could trigger a fresh positional uptrend.
### Targets
* 🎯 Target 1: **₹512**
* 🎯 Target 2: **₹565**
* 🎯 Target 3: **₹620**
* 🎯 Long-term Target: **₹790** (Previous swing high)
### Risk Management
* **Aggressive traders:** Can hold above **₹420** with a stop-loss below **₹395**.
* **Positional investors:** Prefer waiting for a confirmed breakout above **₹470–480**.
* **Major invalidation:** Weekly close below **₹327**.
### Trading Strategy
* **Current Hold Zone:** ₹430–445
* **Fresh Buy Zone:** On breakout above ₹470–480 with strong volume
* **Profit Booking Zone:** ₹510–565 initially
---
### Conclusion
The correction appears to be slowing near a historically strong support zone, and the recent high-volume bounce indicates renewed buying interest. Nevertheless, the long-term downtrend has **not yet been broken**. A sustained move above the descending trendline could transform this recovery into a fresh bullish trend, while failure near resistance may lead to another retest of lower levels.
Disclaimer: This analysis is for educational purposes only and should not be considered investment advice. Always use proper risk management before entering any trade.