MOSCHIP: Structural Breakout & Momentum AccelerationFollowing a prolonged, multi-month horizontal consolidation phase established in December 2025, MOSCHIP has demonstrated a clean structural breakout above its historical trading range. The price action indicates a decisive shift in market structure from a neutral accumulation phase to an active markup phase, signaling that buyers have successfully absorbed overhead supply at the prior resistance.
The validity of this directional expansion is reinforced by a noticeable spike in relative volume, confirming institutional interest and high conviction behind the move.
A fresh bullish crossover on the MACD line above the signal line confirms accelerating upward velocity. The Relative Strength Index has printed above 66. While this level approaches the traditional "overbought" threshold, in the context of a fresh range breakout, it typically underscores strong, high-velocity bullish momentum rather than immediate buyer exhaustion.
From a tactical execution standpoint, chasing the immediate extension carries elevated near-term risk. A classic trend-following approach would anticipate a localized mean reversion or a formal retest of the prior resistance-turned-support zone. If the breakout zone holds on a corrective pullback, the next resistance will be 279 with support place at 192.
Disclaimer: This analysis is strictly for educational and informational purposes and does not constitute financial, investment, or legal advice. The charts and technical setups discussed represent hypothetical market observations and past performance is not indicative of future results. Trading equities involves significant financial risk. Individuals must perform their own due diligence or consult with a registered financial advisor before executing any market positions. The author holds no accountability for individual trading outcomes.  Long
Long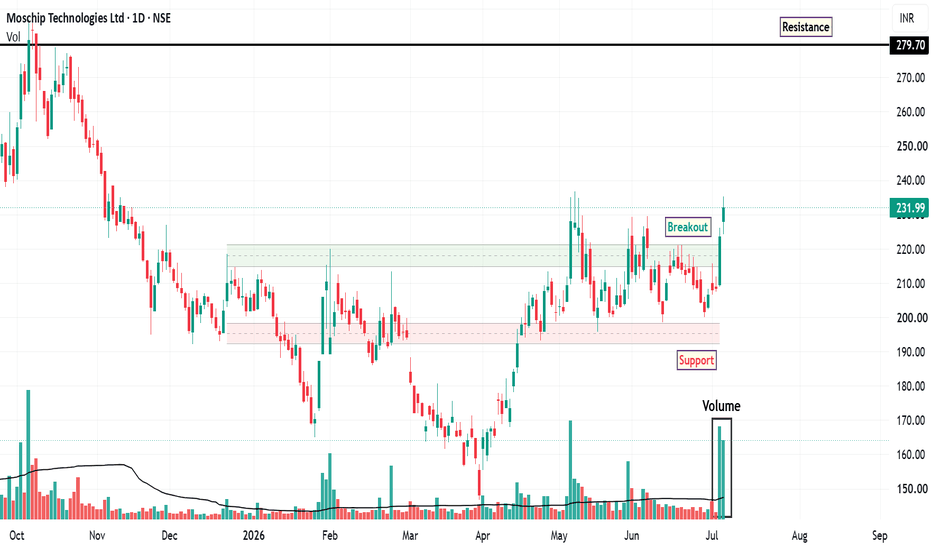
HDFC Bank: Early Signs of StabilizationHDFC Bank has undergone a meaningful correction, with the stock trading roughly 30% below its 52-week high. Following this prolonged downtrend, recent price action suggests that the stock may be entering a stabilization phase, supported by improving technical structure and momentum indicators.
One of the more constructive aspects of the current setup is the stock’s repeated ability to hold above a marked support zone, which may also be viewed as a discount or value area from a chart-based perspective. Multiple successful retests of this region indicate that buying interest has continued to emerge near lower levels, helping to establish a potential base.
The stock has also managed to close above its 20-day EMA, which may be interpreted as an early indication of improving short-term strength. While a single close above the moving average does not confirm a full trend reversal on its own, sustained price action above this level can often signal a gradual shift in sentiment.
Another supportive factor is the gradual increase in daily trading volume, which suggests improving market participation. Rising volume during a recovery phase is often monitored as a sign that the stock may be attracting renewed interest after an extended period of weakness.
From a momentum perspective, the MACD has delivered a bullish crossover on the weekly timeframe, which is typically considered more significant than signals on lower timeframes. This development may indicate that downside momentum is easing and that buyers are beginning to regain influence over the broader trend.
Despite the improving setup, the RSI and the presence of minor supply zones suggest that the stock may still experience short-term consolidation or a pullback before attempting a stronger directional move. In this context, the area around ₹757 may serve as an important level to monitor, particularly if the stock retraces to retest support before deciding its next move.
Based on the current structure, the following chart levels appear important:
Major resistance: near ₹819 , where prior supply may emerge
Stoploss: below the marked support zone on the chart
Disclaimer: This analysis is provided strictly for educational and informational purposes only. It reflects a technical interpretation of price action and indicators and should not be construed as investment advice, a solicitation, or a recommendation to buy, sell, or hold any security. Market conditions can change quickly, and investors should conduct their own due diligence or consult a licensed financial advisor before making any investment decisions.  Long
Long

 Long
Long
Long 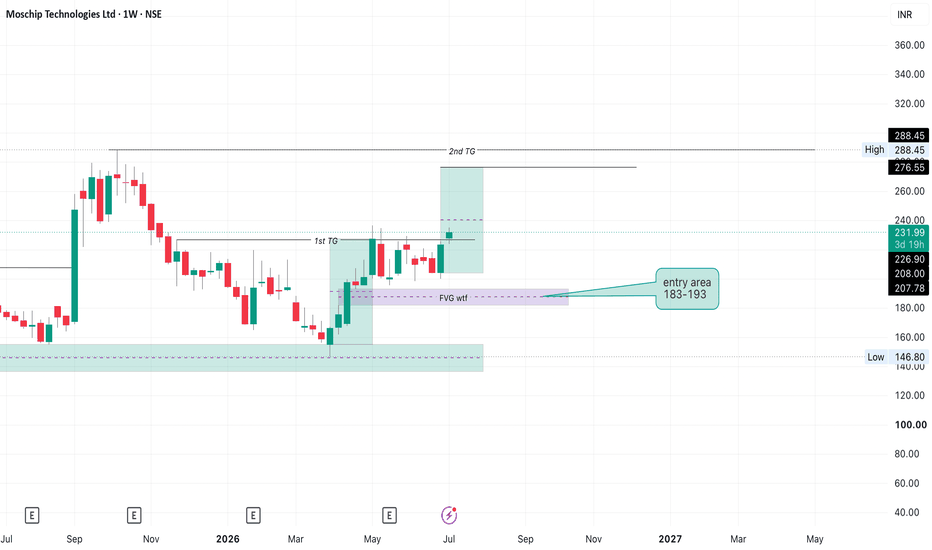
DELHIVERY — IPO Base Breakout on the Weekly ChartSince listing in mid-2022, Delhivery has carved out a massive multi-year IPO Base — exactly the kind of long, deep structure O'Neil describes for newly listed stocks that need time to shake out weak hands and build institutional sponsorship before a real move can begin.
The Structure:
📌 Listed ~₹560–650 in 2022, then corrected hard into a base low near ₹235 by early 2025 — a deep first-stage shakeout
📌 Multi-year rounding/cup formation from 2023 through 2026, with a clear left side, base, and now a right side forming higher lows into resistance
📌 Pivot/Buy Point: 500.00 — the level marking the top of the base structure
This Week's Breakout:
📌 O510.95 → H523.00 → L508.15 → C519.65 (+2.40%) on strong weekly volume (7.2M shares)
📌 Weekly close decisively above the 500 pivot and above the prior swing high resistance zone (~485–495) — this is a textbook Minervini-style breakout: tight price action into resistance, followed by an expansion candle with volume confirmation
📌 Multiple weekly volume spikes over recent months into the base's right side show accumulation building well before the actual breakout — smart money often shows up early
RS Line — The Key Confirmation:
📌 The Relative Strength line has been carving out its own bottoming pattern since late 2024, now curling up sharply alongside price
📌 Per Weinstein's Stage Analysis, this is the RS line transitioning from Stage 1 (basing) into Stage 2 (advancing) — a stock only qualifies as a true leader when RS confirms price strength, and that's happening here in real time
📌 RS making new highs alongside the breakout is the single most important technical confirmation in this setup — it separates genuine institutional leadership from a stock simply moving with the market.
Levels to track:
Support: 500 pivot (former resistance, now the line in the sand) and 457.70 (dashed support)
Next resistance: psychological/round-number zone, watch how price behaves on any pullback to the pivot
A multi-year IPO Base breaking out on strong volume with RS confirming — this is the type of setup Minervini and Weinstein both emphasize as high-probability: long consolidation + volume expansion + leading relative strength.
Not investment advice — just sharing my technical analysis. 📊
 Long
Long
 Long
Long
 Long
Long
 Education

 Education

 Long
Long
 Long
Long
IDFCFIRSTB:VCP/Tight Consolidation Near HighsIDFC First Bank appears to be developing a constructive continuation pattern after a strong breakout advance of approximately 23% from the previous base. Following the impulsive move, price has entered a narrow consolidation range with contracting price swings, suggesting supply absorption and preparation for a potential continuation move.
Technical Observations
Strong Prior Advance: Price rallied strongly from the previous base, indicating momentum and accumulation.
VCP Characteristics: Pullbacks have become progressively smaller, reflecting reduced selling pressure and tightening price action.
Higher Low Structure: Buyers continue stepping in at higher levels, maintaining a constructive bullish structure.
Consolidation Near Highs: Rather than retracing deeply, price is holding near recent highs, which is often observed in stronger momentum candidates.
Relative Strength Improvement: Relative strength has moved into positive territory and continues trending higher versus the broader market.
Supply Absorption: Multiple tests around the resistance area have failed to produce meaningful selling, suggesting overhead supply may be getting absorbed.
Key Levels
Immediate Support: ₹78–78.5
Swing Low Support: ₹76.8–77.9
Entry Zone: ₹80.5–81
Target 1: ₹84–85
Target 2: ₹88–90
Trade Plan
The preferred setup is participation around current levels or on a decisive close above the ₹80.5–81 resistance zone. The consolidation structure provides a relatively favorable risk-to-reward profile with risk defined below the recent swing low.
Suggested risk management for this setup would be a stop loss below ₹76.8–77, as a break below this level could invalidate the tightening structure and increase the probability of deeper consolidation.
Summary
IDFC First Bank is showing characteristics commonly seen in momentum continuation setups: strong prior advance, tight price action near highs, improving relative strength and VCP-like contraction. The stock is approaching a potential decision point where a breakout could trigger the next phase of the trend.
Disclaimer: Educational purpose only. Not a recommendation to buy or sell securities. Please manage risk appropriately.  Long
Long
MANKIND:VCP/High Tight Consolidation within an Ongoing UptrendMankind Pharma appears to be forming a constructive continuation structure after a strong impulsive move of nearly 38% from the prior base. Instead of giving back a large portion of gains, the stock has moved into a relatively tight consolidation near highs, which is often seen in stronger momentum names.
Technical Observations
Strong Prior Expansion: Price advanced sharply from the previous consolidation zone, indicating institutional participation and strong momentum.
Constructive Pullback: The correction after the rally has remained shallow rather than aggressive, showing limited selling pressure.
VCP Characteristics: Price swings appear to be contracting with smaller pullbacks, suggesting supply absorption.
Higher Low Structure: Buyers continue to step in at higher levels, maintaining bullish market structure.
Tight Price Action Near Highs: Strong stocks typically spend time consolidating close to highs rather than correcting deeply.
Relative Strength Support: Relative strength remains constructive and continues to hold positive territory.
Key Levels
Immediate Support: ₹2,455–2,480
Major Support Zone: ₹2,420–2,450
Breakout Level: ₹2,550–2,570
Target 1: ₹2,700
Target 2: ₹2,850–2,900
Trade Plan
A decisive close above the ₹2,550–2,570 zone with expansion in volume could confirm the next leg of the trend. The preferred setup would be continuation from this tightening structure with price remaining above the recent swing lows.
For risk management, maintaining a stop below the recent consolidation support zone would keep risk controlled while preserving a favorable reward profile.
Aggressive traders can enter at the current level with a tight stop loss as defined on the chart.
Summary
Mankind Pharma is displaying several characteristics of a momentum continuation setup: strong prior advance, tightening price action, controlled pullback and continued relative strength. The stock now appears to be approaching an important decision point where a breakout could trigger another expansion phase.
Disclaimer: Educational purpose only. Not a recommendation to buy or sell securities. Please manage risk appropriately.  Long
Long
 Long
Long
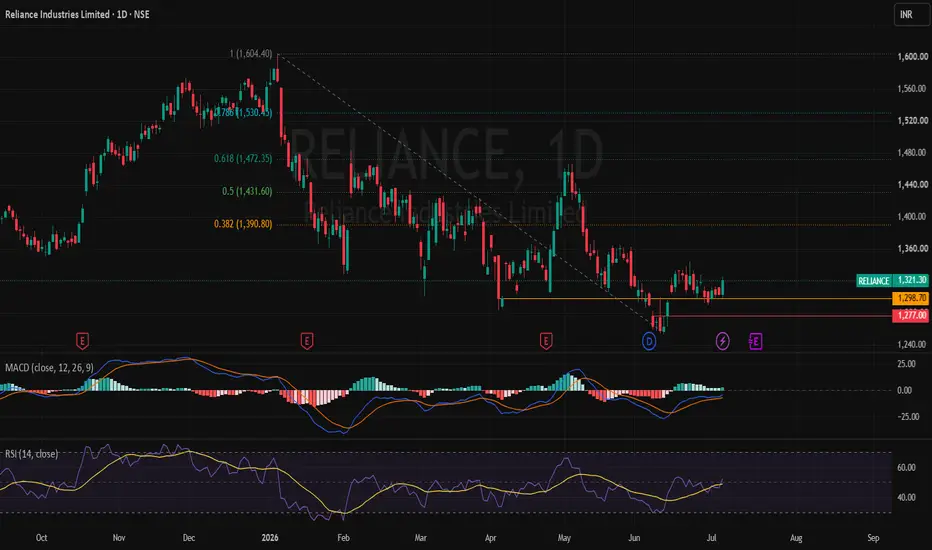
RELIANCE | Nifty Heavyweight Rebound — ₹1,390 Zone WatchReliance Industries Ltd — Short-Term Chart Study
NSE: RELIANCE
Reliance is showing a short-term rebound attempt from the lower support zone after a corrective move from recent highs. Price has taken support near the ₹1,277–1,300 area and is now trying to sustain above the short-term recovery zone.
Chart observations:
Price is holding above the recent support area.
Daily RSI has moved back above the mid-zone, showing improving momentum.
Daily MACD is also improving, suggesting downside pressure is reducing.
The first important resistance zone is near ₹1,390.
Bigger confirmation is still pending on weekly structure.
The key area to track now is the ₹1,315–1,330 zone. If price sustains above this area, the next important resistance zone comes near ₹1,390–1,410.
On the downside, ₹1,298–1,300 is the near support zone, while ₹1,277 is the important risk zone to track. If price fails to hold this area, the rebound setup may weaken.
Key levels:
Near support: ₹1,298–1,300
Major support / risk zone: ₹1,277
Sustain zone: ₹1,315–1,330
Resistance watch: ₹1,390–1,410
Higher resistance: ₹1,430 / ₹1,470
For now, Reliance looks like a short-term rebound setup from support, but stronger confirmation will depend on sustained price action above ₹1,390–1,410 with healthy volume.
Shared only for educational study and chart-tracking purpose. This is not a buy/sell recommendation or investment advice. I am not a SEBI registered advisor. Please do your own research or consult a qualified financial advisor before taking any investment decision. I am not responsible for any profit or loss based on this post.
#RELIANCE #RelianceIndustries #Nifty50 #NiftyHeavyweight #NSE #DailyChart #ChartStudy #TechnicalAnalysis #StockMarketIndia  Long
Long
whatever size your business is, the answer is DelhiveryDELHIVERY CMP 324
Delhivery provides a full range of Logistics services, including delivery of express parcels and heavy goods, PTL freight, TL freight, warehousing, supply chain solutions, cross-border Express, freight services, and supply chain software. The company also offers value-added services such as e-commerce return services, payment collection and processing, installation & assembly services, and fraud detection.
This is just to boost my confidence. No Suggestions for buying.
Disclosure: I am not SEBI registered. The information provided here is for educational purposes only. I will not be responsible for any of your profit/loss with these suggestions. Consult your financial advisor before making any decisions.
Long 
AMBER ENTERPRISES | Positional Trade SetupTechnical View
AMBER is trading within a well-defined Ascending Triangle, supported by a series of higher lows and a strong horizontal resistance zone. The price has repeatedly respected the rising support trendline, indicating sustained buying interest despite short-term corrections.
The current consolidation appears constructive. A decisive breakout above the resistance zone may trigger the next leg of the uptrend.
Trade Setup
CMP: ₹7,484
Add on Dips: Around ₹7,200
Stop Loss (Closing Basis): ₹6,989
Target Levels
🎯 Target 1: ₹8,228
🎯 Target 2: ₹8,666
🎯 Target 3: ₹8,888
🎯 Target 4: ₹9,111
🎯 Target 5: ₹9,333
🎯 Target 6: ₹9,666
Trading Strategy
* Fresh positions may be considered around the current market price.
* Additional accumulation may be considered near ₹7,200 if the stock witnesses healthy corrective moves.
* Maintain a strict Closing Basis Stop Loss at ₹6,989.
* Consider partial profit booking at successive targets while trailing the stop loss (TSL) to protect gains.
Technical Highlight
* Pattern: Ascending Triangle
* Trend: Bullish
* Support: Rising Trendline
* Resistance: ₹8,228 Zone
* Time Horizon: Positional (Medium Term)
Disclosure: This technical view is based on price action and chart analysis. The analysis reflects the current market structure and is subject to change based on evolving market conditions. There are no guaranteed returns in the stock market. Investors should assess their risk profile and follow appropriate risk management before making any investment decisions.
 Long
Long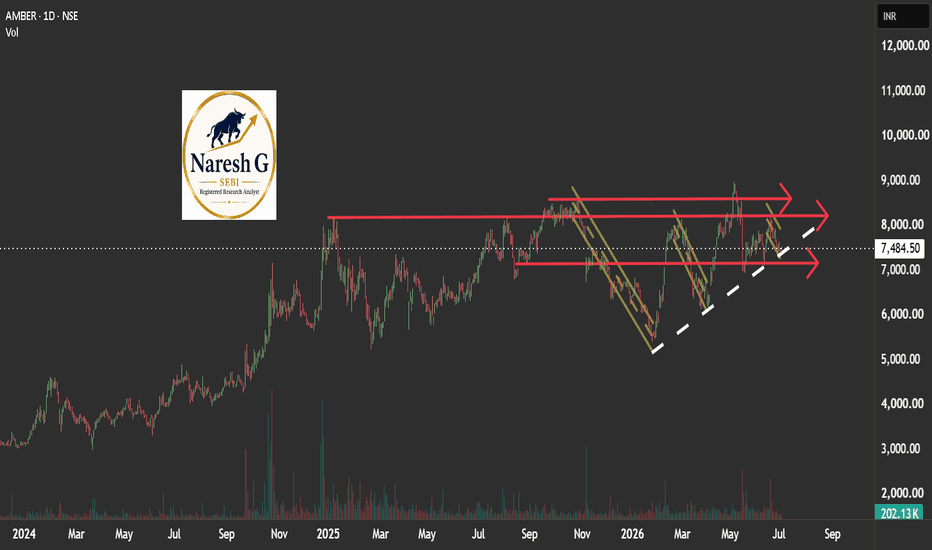
DCXINDIA | Defence Electronics Recovery — Trendline Breakout DCX Systems Ltd — Weekly Chart Study
NSE: DCXINDIA
DCXINDIA is showing a fresh weekly recovery attempt after a prolonged corrective phase from higher levels. Price has recovered from the lower base zone and is now testing an important falling trendline area.
The weekly structure is gradually improving. RSI has moved back above the mid-zone, showing better momentum, while MACD has turned positive, indicating that downside pressure is reducing.
The key zone to track now is the ₹208–220 area. Sustained weekly closing above this zone can strengthen the recovery structure and may confirm better trend improvement. Until then, this remains a trendline breakout attempt, not a fully confirmed breakout.
On the upside, important resistance zones are visible near ₹230–240, followed by ₹260–275 and ₹300–320 as broader reference zones.
On the downside, ₹198–200 remains the near support zone, while ₹185–190 is the broader support area to track. A move below this zone can weaken the current recovery structure.
Key levels:
Support: ₹198–200
Major support: ₹185–190
Recovery / breakout watch zone: ₹208–220
Resistance: ₹230–240 / ₹260–275 / ₹300–320
For now, DCXINDIA looks like a defence electronics recovery setup near trendline resistance, but stronger confirmation will depend on sustained weekly closing above the breakout zone with healthy volume.
Shared only for educational study and chart-tracking purpose. This is not a buy/sell recommendation or investment advice. I am not a SEBI registered advisor. Please do your own research or consult a qualified financial advisor before taking any investment decision. I am not responsible for any profit or loss based on this post.
Chart observations:
Weekly structure is improving after a long correction.
Price is testing the falling trendline area.
RSI has moved back above the mid-zone.
MACD has turned positive, showing improving momentum.
Confirmation is still pending above the ₹208–220 zone.
#DCXINDIA #DCXSystems #DefenceStocks #ElectronicsManufacturing #NSE #WeeklyChart #ChartStudy #TechnicalAnalysis #StockMarketIndia