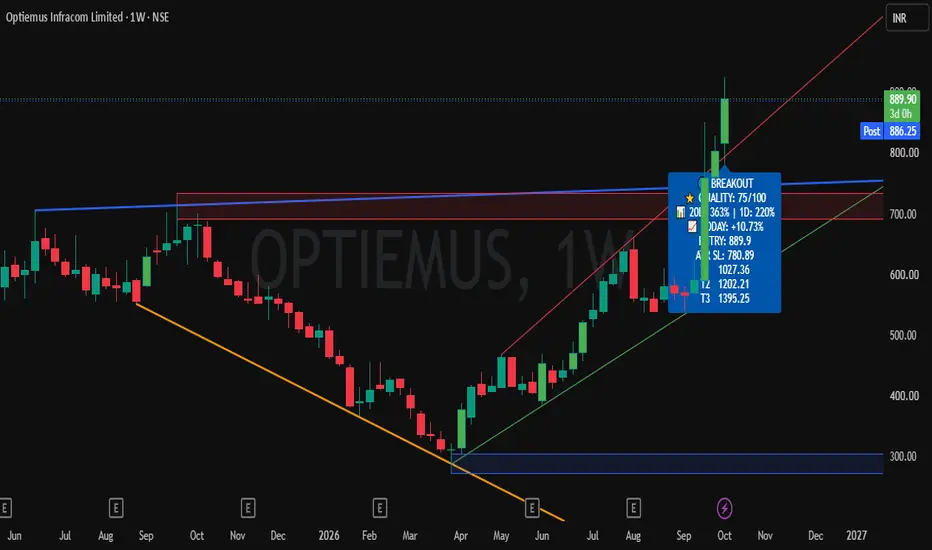
OPTIEMUS — SWING TRADING WEEKLY SETUPOPTIEMUS — SWING TRADING WEEKLY SETUP
Entry, Stop Loss & Targets Are Clearly Defined — Helping You Plan Your Trade With Confidence.
📊 Stock Strength: 75/100
(Note: Higher score indicates stronger stock conditions, not guaranteed returns.)
A bullish breakout has appeared on the 1W timeframe with positive price action and strong volume expansion.
🔄 Trade Type: Swing Trade — Weekly
────────────────────
🎯 TRADE LEVELS
ENTRY: ₹890
🛑 STOP LOSS
ATR SL: ₹781
🎯 TARGETS
T1: ₹1027
T2: ₹1202
T3: ₹
Buy Today, Sell Tomorrow for 3-5% - Daily Breakout SetupKINGFA — BTST BREAKOUT SETUP
Entry, Stop Loss & Targets Are Clearly Defined — Helping You Plan Your Trade With Confidence.
📊 Stock Strength: 90/100
(Note: Higher score indicates stronger stock conditions, not guaranteed returns.)
A bullish breakout has appeared on the 1D timeframe with positive price action and strong volume expansion.
🔄 Trade Type: BTST
────────────────────
🎯 TRADE LEVELS
ENTRY: ₹6940.
🛑 STOP LOSS
ATR SL: ₹6607.
🎯 TARGETS
BTST Target: 3–5%
────────────────────
📈 VOLU
RELIANCE Long Setup at Multi-Year Weekly Support RangeReliance Industries (RELIANCE) has been consolidating within a broad, well-defined rectangular range on the weekly timeframe since mid-2024.
The price has consistently respected the lower boundary as a heavy demand zone.
Recently, the price retested this major macro support level around 1,180–1,215 and is currently showing a bullish bounce.
Entering near the bottom of a prolonged horizontal channel offers a highly favorable risk-to-reward ratio.
This long bias is supported by two key technica
Buy Today, Sell Tomorrow for 3-5% - Daily Breakout SetupFINEORG — BTST BREAKOUT SETUP
Entry, Stop Loss & Targets Are Clearly Defined — Helping You Plan Your Trade With Confidence.
📊 Stock Strength: 100/100
(Note: Higher score indicates stronger stock conditions, not guaranteed returns.)
A bullish breakout has appeared on the 1D timeframe with positive price action and strong volume expansion.
🔄 Trade Type: BTST
────────────────────
🎯 TRADE LEVELS
ENTRY: ₹5514
🛑 STOP LOSS
ATR SL: ₹5297
🎯 TARGETS
BTST Target: 3–5%
────────────────────
📈 VOLU
DPABHUSHAN Weekly Breakout Supported by Exceptional VolumeD. P. Abhushan Ltd. has staged a powerful bullish breakout on the weekly timeframe.
The price action shows that the stock had been forming a broad consolidation base over the last couple of years, facing strict overhead resistance near the 1,900 level (indicated by the horizontal red line).
The most recent weekly candle decisively shattered this resistance, closing at 2,153.2 and registering a substantial gain of +14.90%.
This breakout is heavily validated by the volume; a towering green volume
AS MARKETS COOL OFFAs the markets cool off, this trade on HUDCO can be good as this is a good support level, but i won't take big risk personally as it can go to 90-100 also from here.
Good levels, I'd personally aim for a 4-5 % pull back and then a 20-25 % gain.
ENtry- 155-150
Tp- 194-195
sl- 90-100
SMCGLOBAL Multi-Year Resistance Breakout by Massive VolumeOn the weekly timeframe, SMC Global Securities Ltd. has executed a textbook technical breakout from a prolonged consolidation base.
The stock had been battling a stiff horizontal resistance ceiling around the 90.78 mark for an extended period.
Recently, the price shattered this level with a strong bullish weekly candle, touching a high of 120.00 before settling at its current level of 109.90.
Crucially, this price action is validated by remarkably high trading volume—indicated by the towering
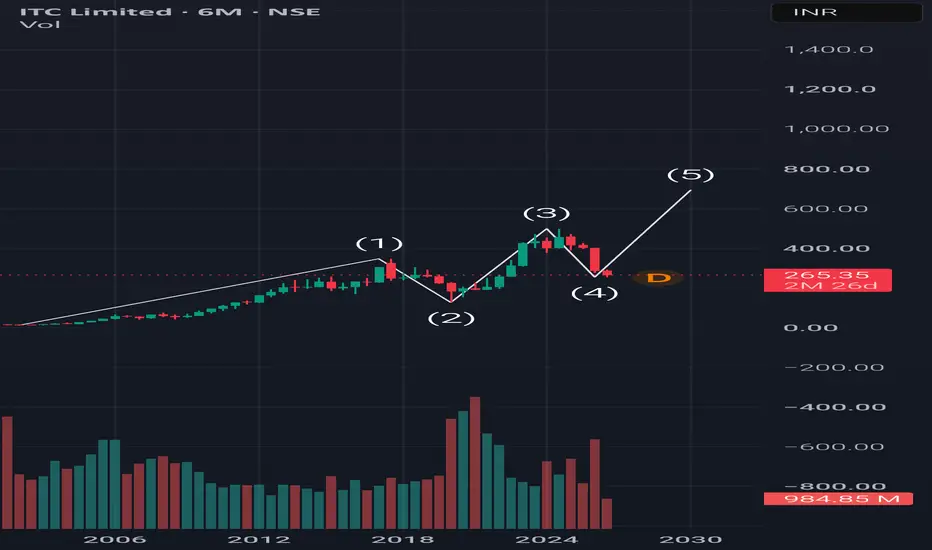
ITC Bullish Reversal It's now or Never, Elliot Wave Theory suggests a new set rally for the stock fundamentally the company has become very agressive with the target to become biggest FMCG player . Company being absolutely debt free LIC major holding excellent divends for the buyers it's like everything is becoming too good to be true.
This is the best value for long term investors hold in cash allocate 25% portfolio.
Do your own research I am not a financial advisor.
Voltas Ltd - Harmonic XABCD Crab pattern -Bullish Reversal setup## 📈 Voltas Ltd. — Technical Setup
Voltas is showing a **potential bullish reversal setup** after a prolonged decline. The chart highlights a **PRZ / Crab 1.618 harmonic zone** around the ₹1,070–₹1,095 area, where price has started showing a reaction.
### 🔑 Key Levels
* **CMP:** ₹1,116
* 🟢 **Entry / Support Zone:** ₹1,080–₹1,095
* 🔴 **Invalidation / SL:** ₹1,070
* 🎯 **First upside zone:** ₹1,232–₹1,240
* 🚀 **Extended target:** ₹1,416
### 📊 Setup View
Price has reached the marked harmonic co
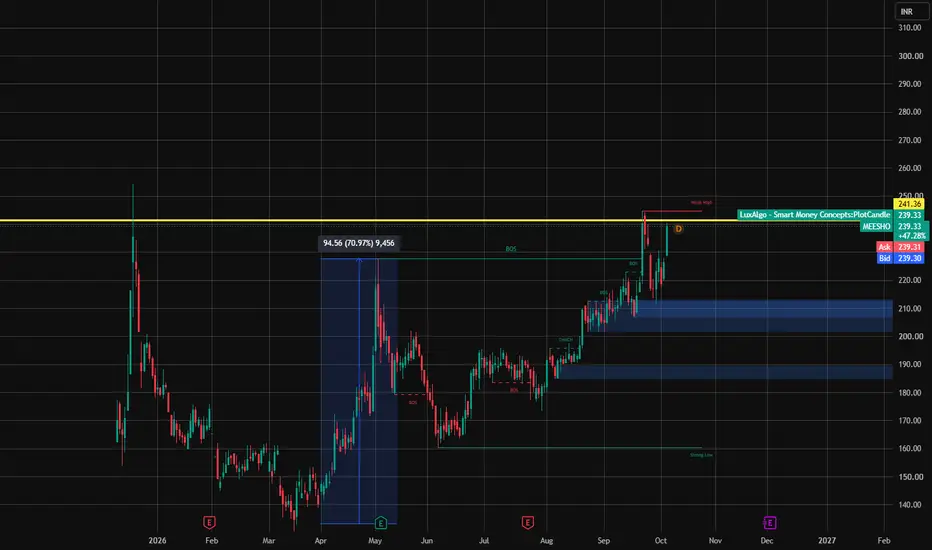
Meesho: Growth is strong, but profit is still far awayI went through Meesho's ratios and financials. One thing first: if you look only at headline numbers, the picture will be incomplete.
What looks good ✅
→ FY26 net sales of ₹12,626 cr, up 34.5%
→ Almost no debt, with interest of only ~₹9 cr
→ Current ratio of 1.55, and cash up from ₹147 cr to ₹620 cr
→ Asset-light model: asset turnover of ~1.7 and near-zero receivables
What needs a closer look ⚠️
→ FY26 expenses grew 41.6% against 34.5% sales growth, so costs outpaced revenue
→ PBIDT went from
INDOAMIN Technical Analysis & Trade Setup
Symbol: INDOAMIN (Indo Amines Limited) — Daily Timeframe (NSE)
Current Price: ₹165.20 (+3.17% intraday surge)
Market Structure: Following an extended corrective cycle down to its macro structural low near ₹81.90, the stock formed a rounded double-bottom accumulation base and printed a clear sequence of higher lows. Price has logged a strong bullish momentum candle, breaking out above its local base resistance.
Key Technical Trade Levels
Entry Zone: ~₹164.75
IRCTC - Falling Channel | Reversal From SupportPrice is moving into a falling channel and showing a reversal from support. doing average at this level advisable sir.
🔹 Demand zone + channel support: ₹445-455
🔹 Resistance: ₹480-490, then ₹560
DISCLAIMER
This channel is for educational and self-analysis purposes only.
We share technical levels, charts, and market insights based on publicly available information and multiple sources. These are not financial or investment recommendations.
I am not a SEBI-registered analyst. Please consult your
DPWIRES Technical Analysis & Trade Setup
Symbol: DPWIRES (DP Wires Limited) — Daily Timeframe (NSE)
Current Price: ₹194.20 (+3.07% intraday surge)
Market Structure: Following an extended corrective sequence down to the structural low near ₹125.02, the stock executed a multi-month rounding accumulation base and printed a series of higher lows. Price has logged a strong expansion candle, breaking out above its dynamic horizontal base resistance.
Key Technical Trade Levels
Entry Zone: ~₹194.09 – ₹194.
ONE POINT ONE SOLUTIONS LTD — ELLIOTT WAVE & PRICE STRUCTUREOne Point One Solutions is currently showing a potentially important Elliott Wave completion and accumulation structure.
The larger price structure appears to have completed a corrective W-X-Y pattern, with the recent price action developing from the ₹40–52 support/accumulation region. The stock has subsequently broken above the descending corrective trendline, indicating improving bullish momentum.
🔹 Key Technical Structure
The larger corrective structure appears to form a W-X-Y three-wave co
Uptrend Stock has been in an uptrend for quite a long time on the 2-hour chart. We see it went to an all-time high and then took a downward journey towards the 200 EMA. Now it took support at the 200 EMA and filled the last bearish fair value gap that was formed during the downtrend. Now it can start its upward journey again.
Shattering the Downtrend!Pattern Structure: The price action reveals a maturing descending wedge, compressing volatility toward a decisive resolution and signaling a major shift in market structure.
Volume Analysis: Notable spikes in volume during the trendline breach confirm strong institutional conviction, validating the breakout and reducing the risk of false breakouts.
Supply and Demand: A robust horizontal support zone provides a reliable demand floor, successfully absorbing selling pressure to fuel the upside m
ONEPOINT- Multi-Year Base Formation Hinting at a Structural TrenAfter spending nearly two years under a declining trendline, the stock has gradually stopped making lower lows and started building a series of higher lows and higher highs.
✅ Multi-Year Descending Trendline Under Pressure
The stock has remained below a falling trendline since the 2024 peak. Every rally during this period faced rejection at lower levels.
Today, price is once again approaching the same trendline, but under very different conditions. Instead of rising from weakness, it is adva
Vineet Lab(VINYLAB)–3 Failed Rallies,A nice setup worth watchingSome charts tell a story of momentum.
Others tell a story of persistence. Vineet Laboratories belongs to the second category.
For nearly three years, the stock has remained trapped beneath a relentless descending trendline, with every recovery eventually meeting supply and fading away. What makes the current setup interesting is not the rally itself, but the pattern that has developed beneath that resistance.
✅ Three Distinct Bottoming Cycles
Since the 2025 lows, the stock has gone through mul