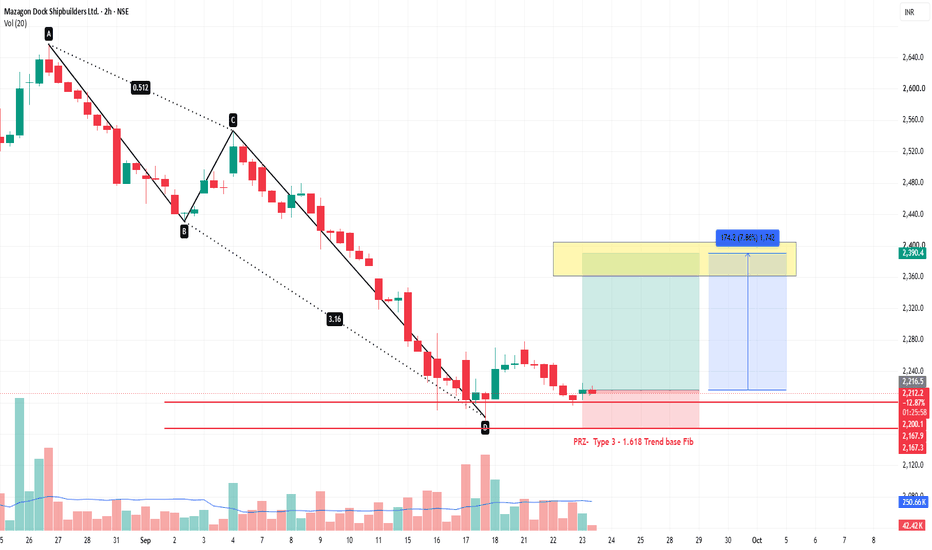
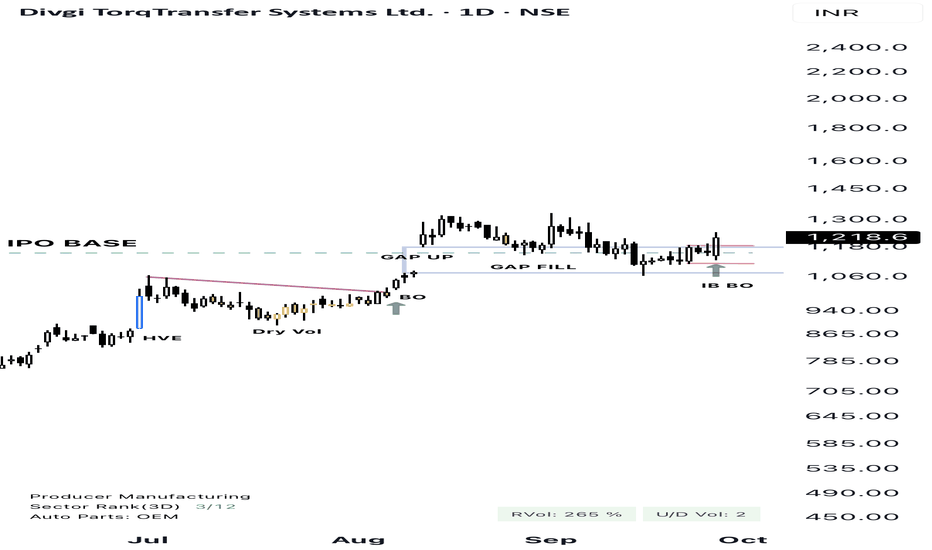
Mazagon Dock Shipbuilders Ltd โ 2HTF HARMONIC Setup ABCD Pattern## ๐ข Mazagon Dock Shipbuilders Ltd. โ 2H Technical Setup
Mazagon Dock is showing a **potential bullish reversal setup** after a prolonged decline. The chart marks a **PRZ / Type-3 harmonic zone** around the โน2,200โโน2,217 area, where price has started consolidating.
### ๐ Key Levels
* **CMP:** โน2,217
* ๐ข **Entry Zone / PRZ:** โน2,200โโน2,217
* ๐ข **Reversal Support ZONE / PRZ:** โน2,200 โ โน2,167
* ๐ด **Major support:** โน2,167โโน2,168
* ๐ฏ **Resistance / Target Zone:** โน2,360โโน2,400
* **Projected move
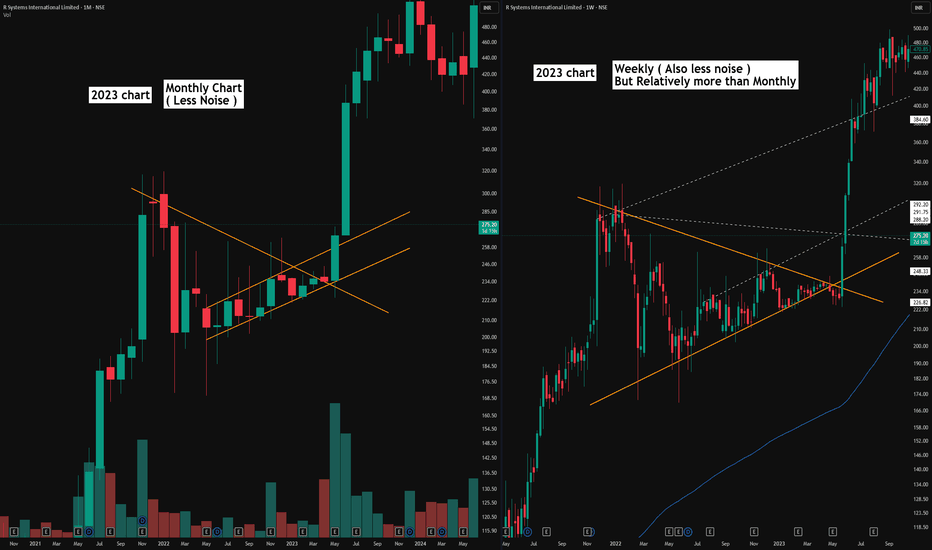
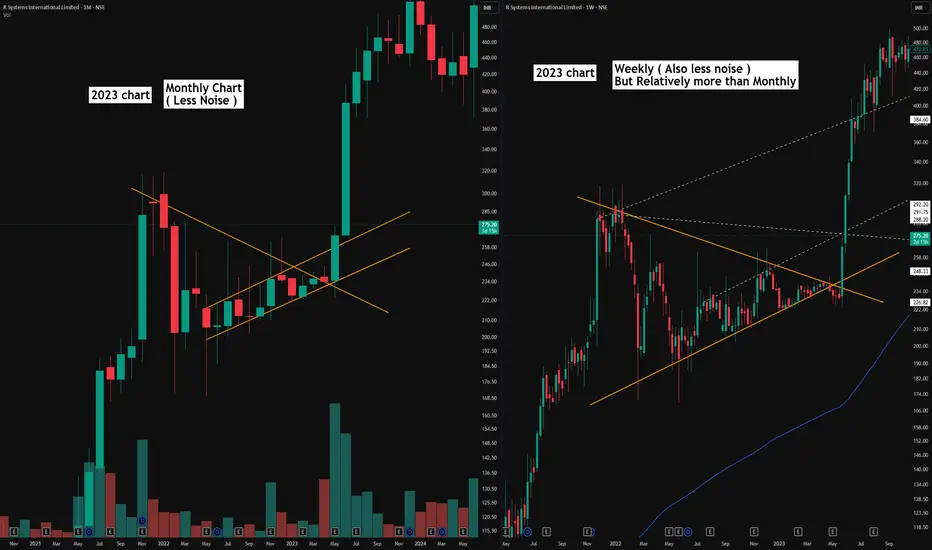
Your Chart Isnโt Difficult - Your Timeframe Might BeHistorical 2023 chart shared strictly for educational purposes to explain multi-timeframe technical analysis. No current market view or recommendation is being expressed.
Sometimes the problem isn't the chart.
Itโs the timeframe you're trying to read it on.
This historical 2023 example shows the same market structure from two different perspectives.. Weekly vs Monthly.
On the Weekly chart , there is naturally more information. More candles create more visible swings, potential support/resis
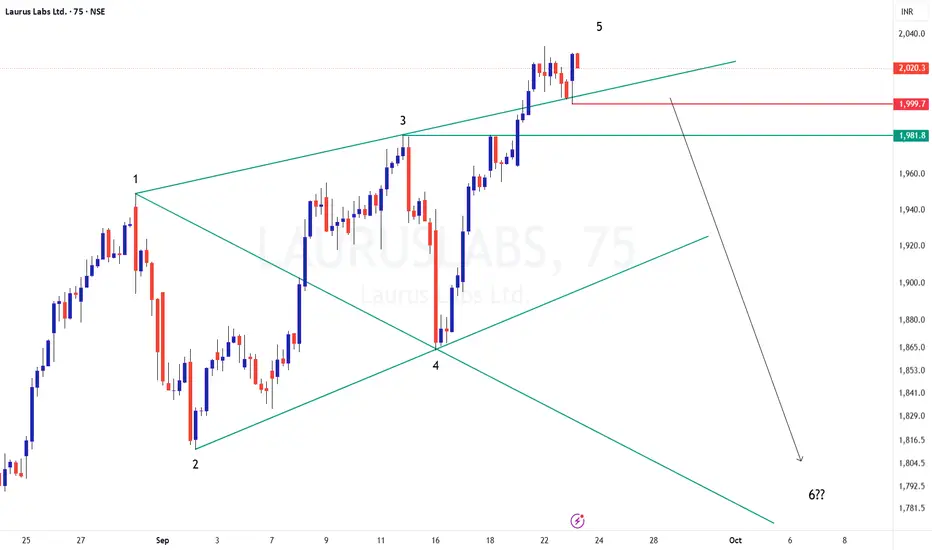
WOLFEWAVE FORMATION in LAURUSLABSCMP: 2022
TF: 75 minutes
Drawings are self explanatory.
Will have to wait for the price to come back inside the upper trendline to take the trade... with SL at price closing above that TL or Swing high
Could be a good set up for Oct series
Disclaimer: I am not a SEBI registered Analyst and this is not a trading advise. Views are personal and for educational purpose only. Please consult your Financial Advisor for any investment decisions. Please consider my views only to get a different per
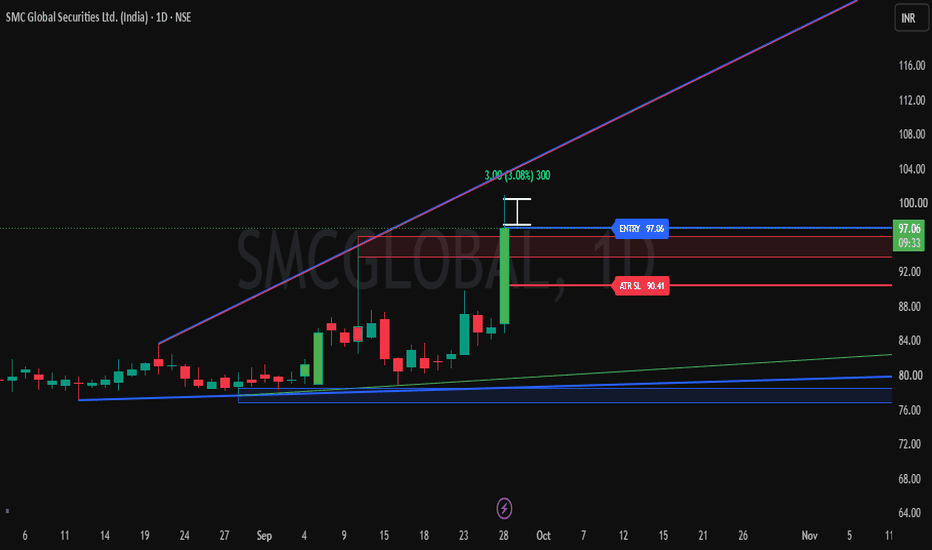
SMCGLOBALSMCGLOBAL is showing a bullish market structure with a clear Higher HighโHigher Low (HH-HL) formation. After making a low near 54, the stock gradually recovered and faced resistance around the 74 zone.
It eventually gave a strong breakout with volume, followed by a controlled pullback, which is a healthy sign in an uptrend. Price has successfully taken support above the previous resistance, indicating that resistance has now turned into support.
The EMAs are well aligned, and today's bullish
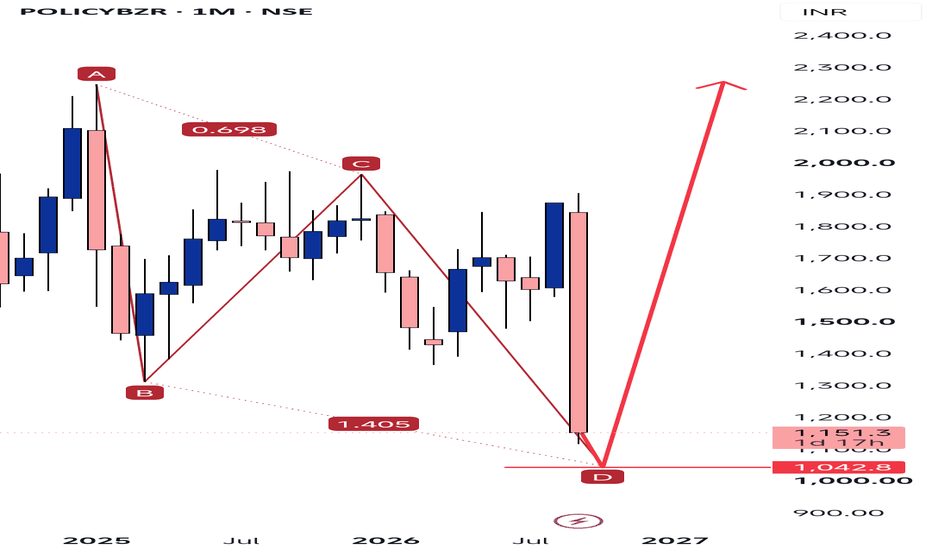
POLICYBZR โ Monthly Technical Analysis
POLICYBZR | 1M | NSE | CMP: โน1,151
The monthly chart is approaching a major long-term structural support around โน1,043, marked as D on the chart. The price action from A โ B โ C โ D shows a large corrective structure, and the current zone is important for determining whether a long-term reversal develops.
๐น 1. AโBโCโD Structure
A: ~โน2,300
B: ~โน1,300
C: ~โน1,950
D: ~โน1,043
Current price: โน1,151
The decline from A โ B was followed by a substantial recovery toward C, but the subsequent C
Elecon Engineering โ 4H Technical Setup
Current price: โน479
Chart: 4H | NSE
What the chart shows: Price has made a strong recovery from the โน402โ420 zone.
A sharp bullish move has taken price back toward the โน458โ486 demand/resistance area.
Price is currently around โน479, sitting inside this zone, so confirmation is important before calling a breakout.
The next major resistance/supply zone is approximately โน540โ556.
The chart also marks the previous high around โน576.
๐ฏ Levels shown on the chart
Level Significance
โน458โ486 Cu
BUY TODAY SELL TOMORROW for 5%DONโT HAVE TIME TO MANAGE YOUR TRADES?
- Take BTST trades at 3:25 pm every day
- Try to exit by taking 4-7% profit of each trade
- SL can also be maintained as closing below the low of the breakout candle
Now, why do I prefer BTST over swing trades? The primary reason is that I have observed that 90% of the stocks give most of the movement in just 1-2 days and the rest of the time they either consolidate or fall
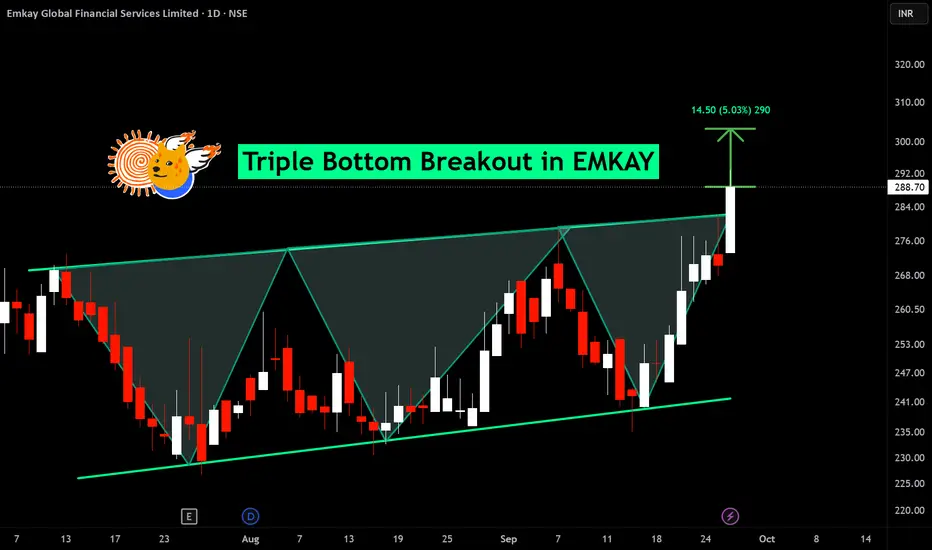
Triple bottom breakout in EMKAY
BUY TODAY SELL TOMORROW for 5%
BUY TODAY SELL TOMORROW for 5%DONโT HAVE TIME TO MANAGE YOUR TRADES?
- Take BTST trades at 3:25 pm every day
- Try to exit by taking 4-7% profit of each trade
- SL can also be maintained as closing below the low of the breakout candle
Now, why do I prefer BTST over swing trades? The primary reason is that I have observed that 90% of the stocks give most of the movement in just 1-2 days and the rest of the time they either consolidate or fall
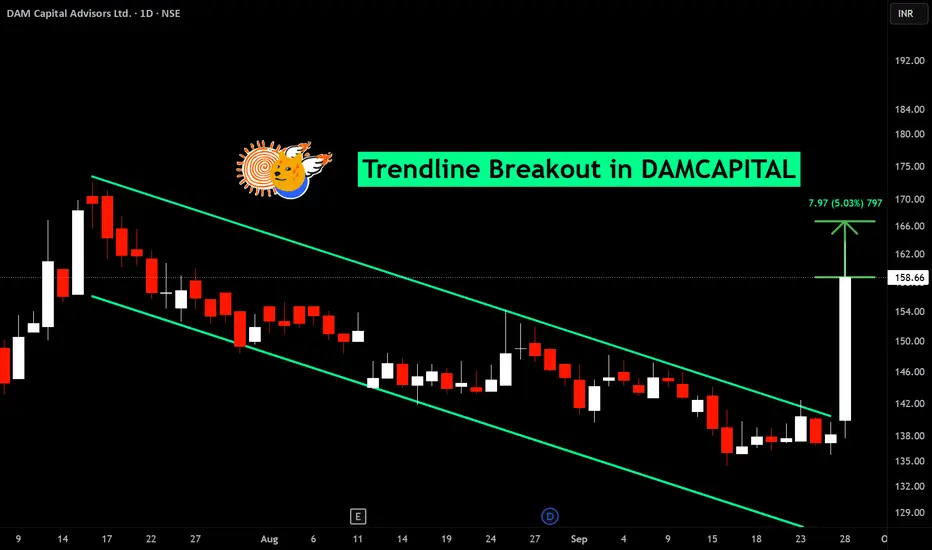
Trendline breakout in DAMCAPITAL
BUY TODAY SELL TOMORROW for 5%
Is the 36โ38% Crash a Buying Opportuny in Policybazaar?
Data reference: The analysis used information available as of 28 September 2026, when PB Fintech was trading around โน1,156 after a sharp decline.
Recent fall: The stock dropped about 36% in one day, falling from โน1,886.30 to โน1,207.20 on 24 September, after IRDAI released a consultation paper.
Main trigger: Investors feared that proposed lower commission and Expense of Management limits could reduce PB Fintech's future revenue and profitability.
Regulatory proposals: IRDAI has proposed tigh
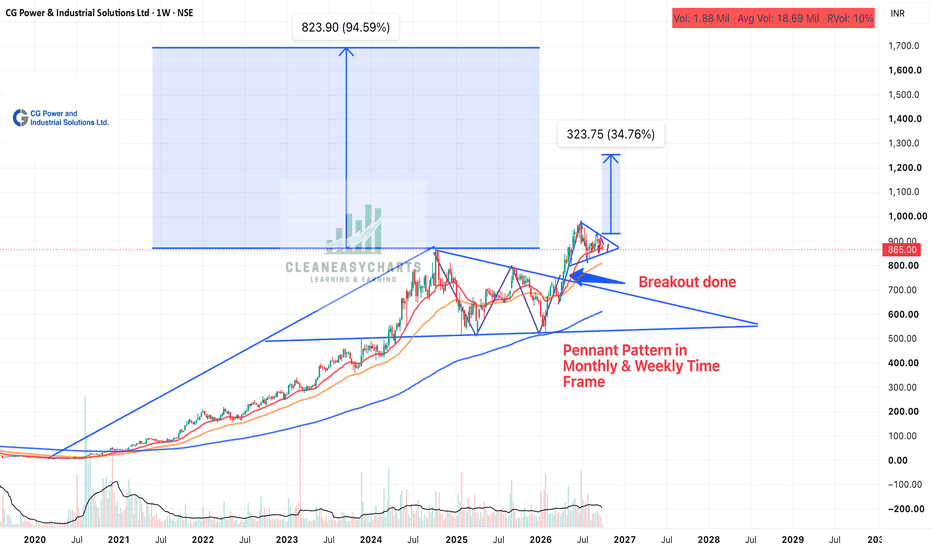
CG Power - Double Pennant PatternCG Power has given a breakout from Pennant Pattern on Monthly time frame and now it is making same pattern on weekly time frame. Fe points which make this stock great.
Fundament:
1. Great Q1 result - profit increased by 25%, though sale was only increased by 16%
2. 17000 crores order book
3. Increasing capacity from 75000 MVA to 120000 MV
4. Orders flowing from data center push, industrial capex, grid expansion - got 900 crores worth order from a US Company
Technically:
1. It has given a br
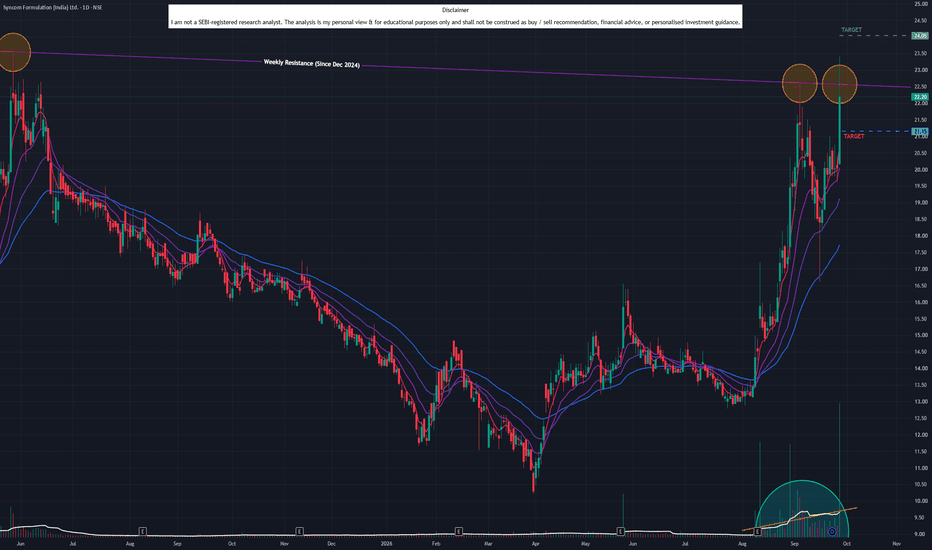
Syncom Formulations (D): RESISTANCE TEST ALERTTimeframe: Daily | Chart Scale: Linear
Explosive +10.72% surge today backed by a massive 82.45M volume spike! ๐ฅ
Technical Highlights:
โ ๏ธ Resistance Test: Pushed into a major angular resistance (active since Dec '24) but couldn't secure the daily close.
โ
Volume: Surging volume across multiple days shows persistent buyer accumulation.
โ
Momentum: Short-term EMAs in positive crossover (Daily/Weekly/Monthly). MACD & RSI rising. ๐
Key Levels to Watch:
๐ฏ Target: 24 (Contingent
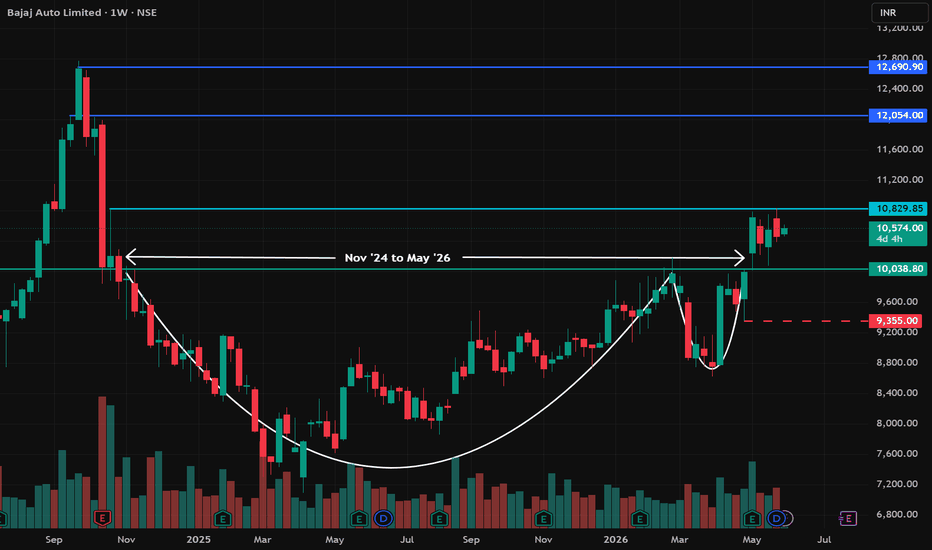
Consolidation after PatternThe cup and handle pattern is a bullish continuation chart pattern that indicates a potential upward price movement after a basing phase. It consists of a rounded bottom (the cup) followed by a smaller pullback (the handle) before a breakout above the previous high.
After completion of this pattern, now the stock is in a bit of consolidation. A breakout of this consolidation phase (close above 10830) is where one can enter with the Red (dash) line {at 9355} as a strict stoploss on a losing basi
DAM Capital Advisors (D): DUAL RESISTANCE BREAKOUTTimeframe: Daily | Chart Scale: Linear
Explosive +14.82% surge today backed by a massive 18.84M volume spike! ๐ฅ
Technical Highlights:
โ
Dual Breakout: Cleared & closed above an angular resistance (Jan '26) AND a horizontal resistance (Aug '26).
โ
Volume Reversal: Sudden, massive volume spike violently breaking a "dry volume" trend.
โ
Momentum: MACD & RSI rising (Daily/Weekly).
โ ๏ธ Caution: Awaiting short-term EMA positive crossover for full confirmation. ๐
Key Levels to Watch:
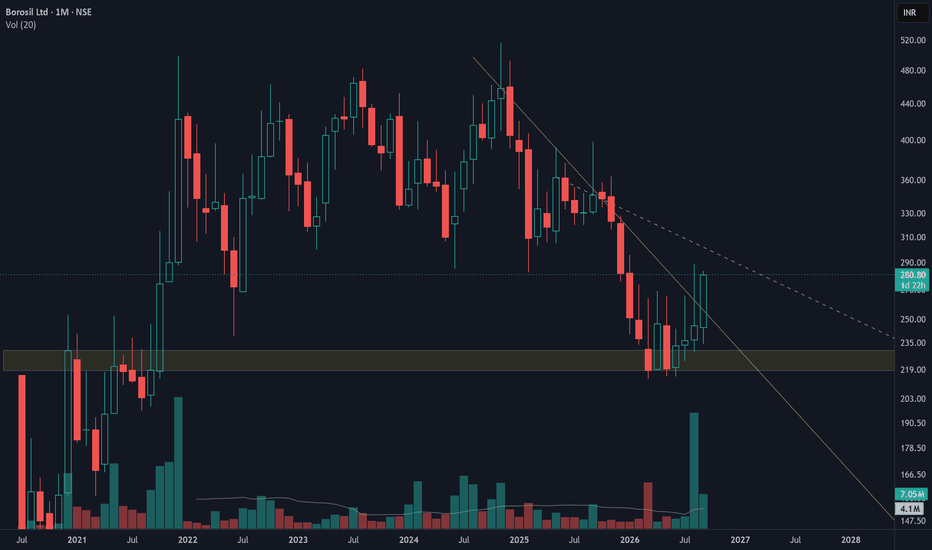
From the Ashes of Downtrend, a New Dawn?Analysis for Borosil Limited:
Price broke out above a descending trendline, indicating a potential bullish reversal. This followed consolidation within a clear support zone. Recent volume spikes suggest strong buying interest. Place your stop-loss just below the recent swing low. Initial targets are the previous swing highs or resistance levels.
White Dashed line Represents Hidden Resistance on the Chart.
Disclaimer:
This Post is Purely Educational; it is Not a Forecast or a Trading Recommen
R Systems International (D): DUAL RESISTANCE BREAKOUTTimeframe: Daily | Chart Scale: Linear
Explosive +16.80% surge today backed by a massive 61.31M volume spike! ๐ฅ
Technical Highlights:
โ
Dual Breakout: Cleared & closed above an angular resistance (Mar '26) AND a horizontal resistance (Sept '26).
โ
Volume Reversal: Sudden, massive volume spike violently breaking a "dry volume" sideways trend.
โ
Momentum: Short-term EMAs in positive crossover (Daily). MACD & RSI rising (Daily/Weekly). ๐
Key Levels to Watch:
๐ฏ Target: 295
๐ก
Retracement started ..looking for next buying zoneINDOMIM LTD
reached the target and now started to look for support
Next support is
1st 1133 to 1083
2nd 1029 to 1017
This must happen before next quarter unaudited result..
Which is planned may be on next month..
After that again booom
#indomim
#buyatdip
#dip
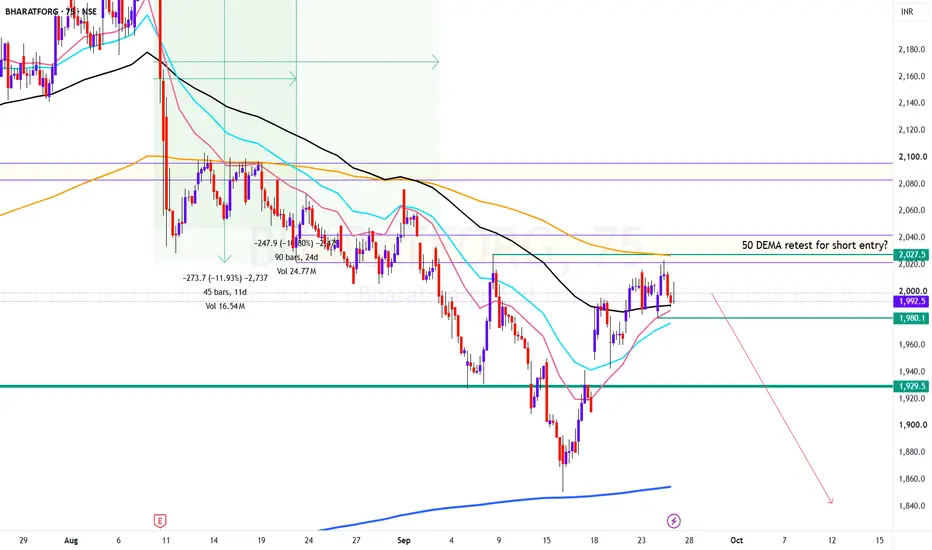
IShort
Low risk short set up in BHARATFORGTF: 75 Minutes
CMP: 1995
Price is getting rejected from 50 DEMA (breakdown on 11th AUG) and retest done today).
With Stops above 2050 on daily close basis, this looks like a very good short set up for October series.
Also, the square of 45 is at 2025, and the price is unable to move past that.. we could use the level as a reference point
In terms of waves, the price has completed the terminal 5 and is due for a deep correction
Disclaimer: I am not a SEBI registered Analyst and this i
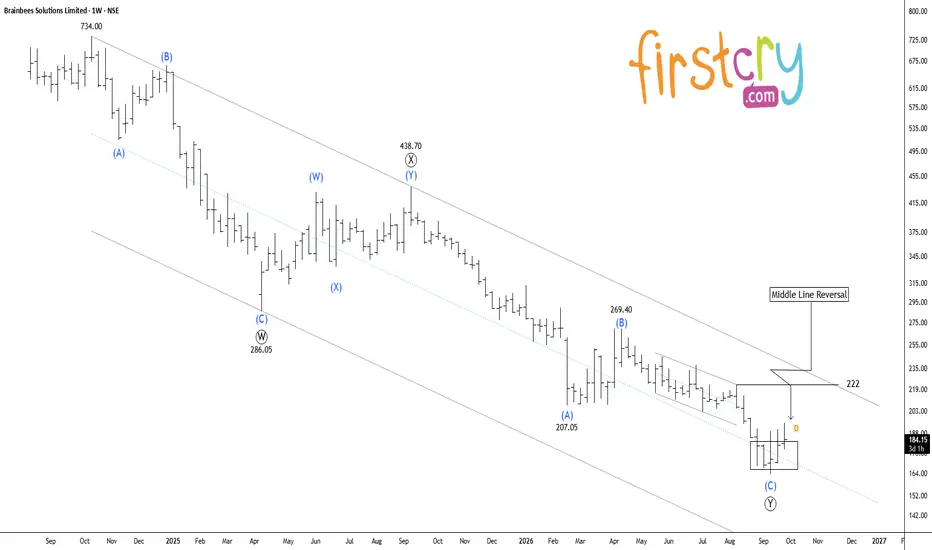
FirstCry: Potential Reversal SetupFirstCry is showing signs of a possible reversal after a long downtrend. The stock has been trying to form a base near the recent low, and the chart shows โน222 as the main level to watch. If the stock breaks and sustains above โน222, the reversal could gain strength. For now, the trend is still weak, so confirmation is important before calling it a clear trend reversal.
By @BrightRally_Research
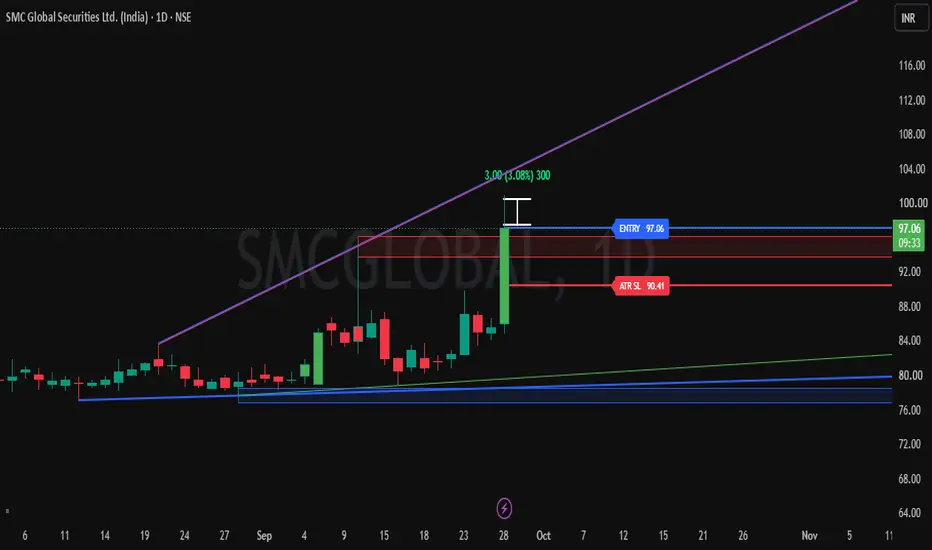
Buy Today, Sell Tomorrow for 3โ5% โ Daily Breakout SetupSMC GLOBAL SECURITIES LIMITED (INDIA) โ BTST BREAKOUT SETUP
Entry, Stop Loss & Targets Are Clearly Defined โ Helping You Plan Your Trade With Confidence.
๐ Stock Strength: 100/100
(Note: Higher score indicates stronger stock conditions, not guaranteed returns.)
A bullish breakout has appeared on the 1D timeframe with positive price action and strong volume expansion.
๐ Trade Type: BTST
โโโโโโโโโโโโโโโโโโโโ
๐ฏ TRADE LEVELS
ENTRY: โน97
๐ STOP LOSS
ATR SL: โน91
๐ฏ TARGETS
BTST Target: 3%
โโโ
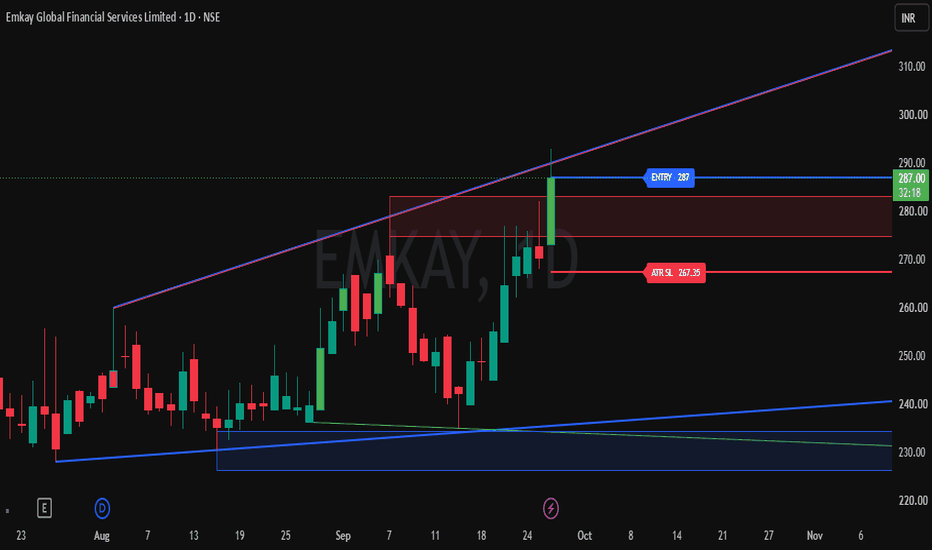
Buy Today, Sell Tomorrow for 3โ5% โ Daily Breakout SetupEMKAY GLOBAL FINANCIAL SERVICES LIMITED โ BTST BREAKOUT SETUP
Entry, Stop Loss & Targets Are Clearly Defined โ Helping You Plan Your Trade With Confidence.
๐ Stock Strength: 100/100
(Note: Higher score indicates stronger stock conditions, not guaranteed returns.)
A bullish breakout has appeared on the 1D timeframe with positive price action and strong volume expansion.
๐ Trade Type: BTST
โโโโโโโโโโโโโโโโโโโโ
๐ฏ TRADE LEVELS
ENTRY: โน286
๐ STOP LOSS
ATR SL: โน266
๐ฏ TARGETS
BTST Target: 3โ5%
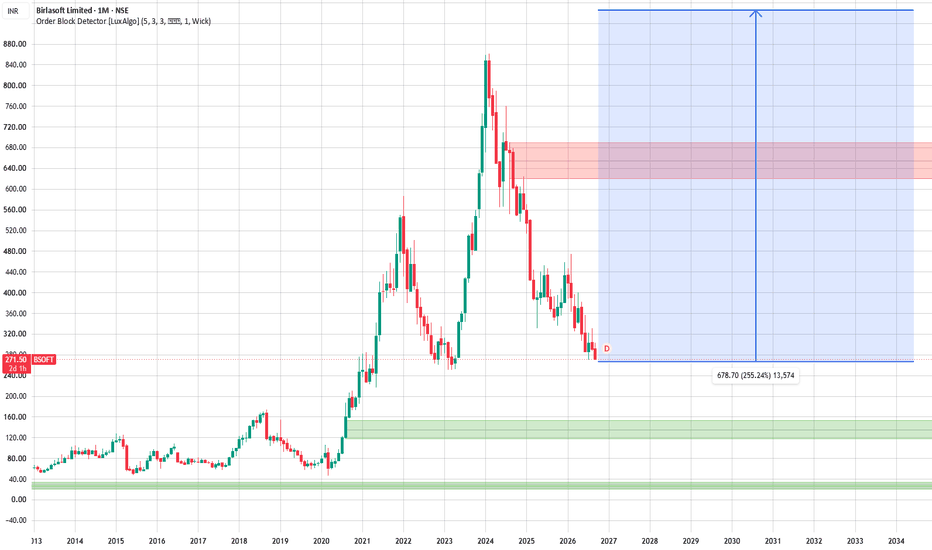
Birlasoft (BSOFT) โ Massive Monthly Setup After 70%+ Correction?๐ข Business Profile
Birlasoft is a global IT services company focused on AI, Cloud, Data, ERP and digital transformation. It serves enterprises across sectors such as Manufacturing, BFSI, Energy & Utilities, and Life Sciences.
The company is increasingly positioning itself around AI-led enterprise transformation, creating an opportunity to move beyond traditional IT services.
๐ Future Growth Catalysts
AI & GenAI adoption across enterprise clients
Revenue growth recovery after a period of slowe
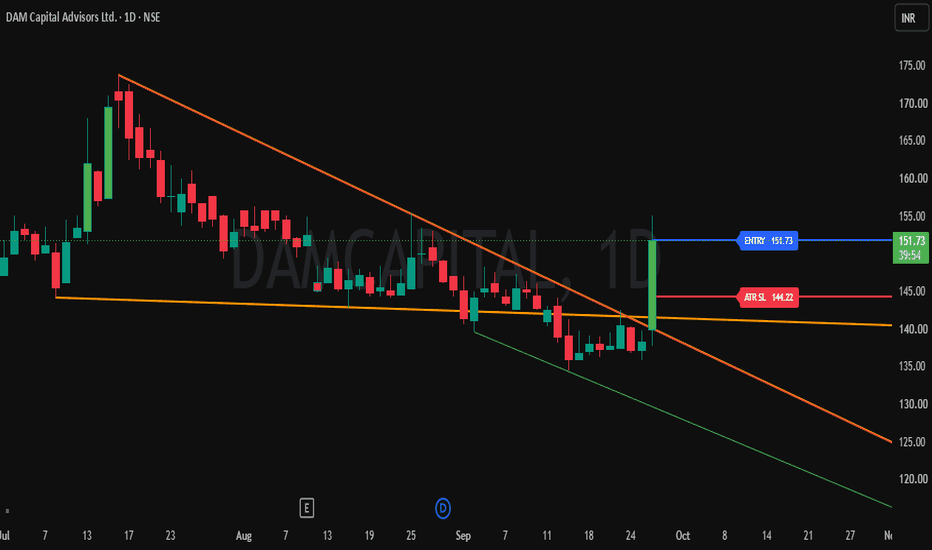
Buy Today, Sell Tomorrow for 3โ5% โ Daily Breakout SetupDAM CAPITAL ADVISORS LTD. โ BTST BREAKOUT SETUP
Entry, Stop Loss & Targets Are Clearly Defined โ Helping You Plan Your Trade With Confidence.
๐ Stock Strength: 69/100
(Note: Higher score indicates stronger stock conditions, not guaranteed returns.)
A bullish breakout has appeared on the 1D timeframe with positive price action and strong volume expansion.
๐ Trade Type: BTST
โโโโโโโโโโโโโโโโโโโโ
๐ฏ TRADE LEVELS
ENTRY: โน152
๐ STOP LOSS
ATR SL: โน144
๐ฏ TARGETS
BTST Target: 3โ5%
โโโโโโโโโโโโโ
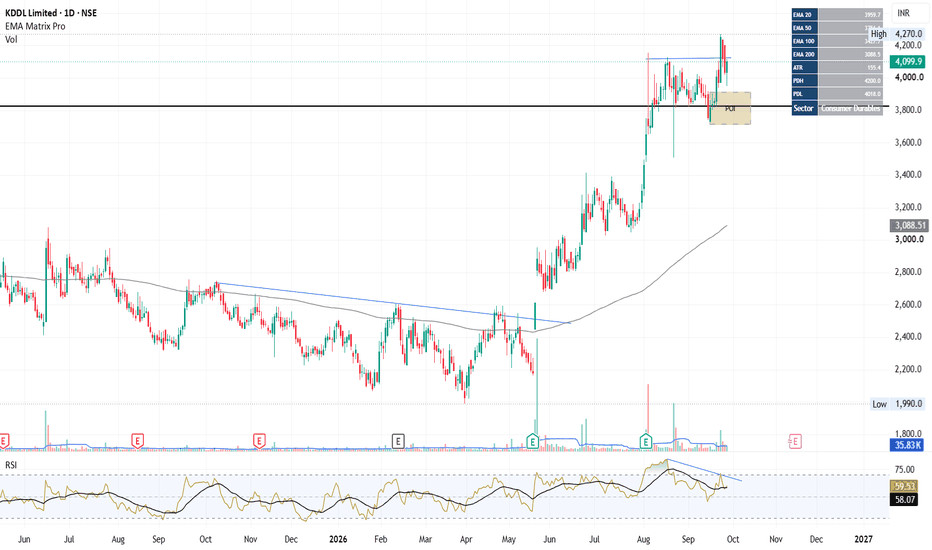
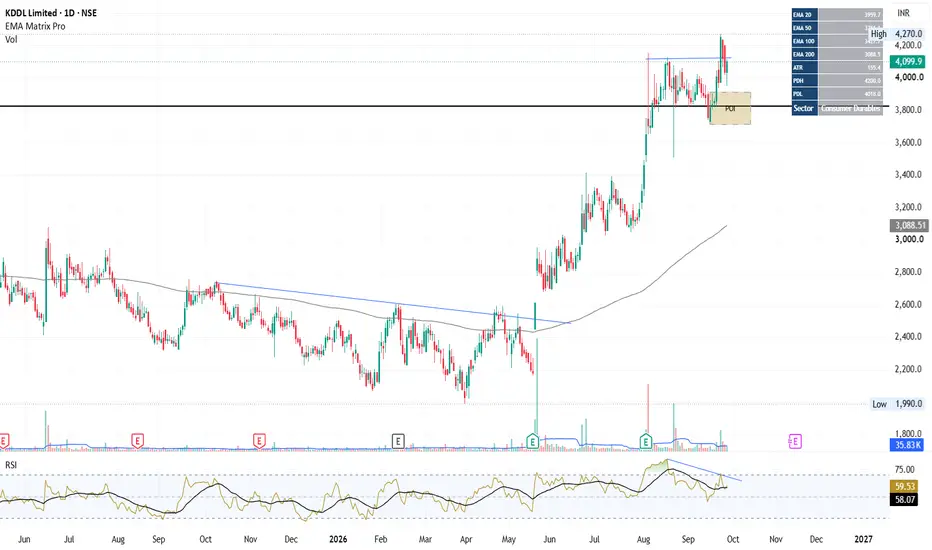
KDDL : Expressing strengthNSE:KDDL is still expressing good strength against the relative strength of all over market.
Key Observations:
Price is holding above all key EMA/s represents the underlying strength in price.
Trend is in totally favor and stock is at Stage 2.
Above Previous ATH, price halted in sideways base with reduced volume participations.
After a decent base since a month, price tried to escape base with volume expansion.
After taking buy side liquidity sweep, price on pullback with low volume