• Products
  • Community
  • Markets
  • Brokers
  • More
Get started
  • Markets
  • /India
  • /Stocks
  • /Ideas
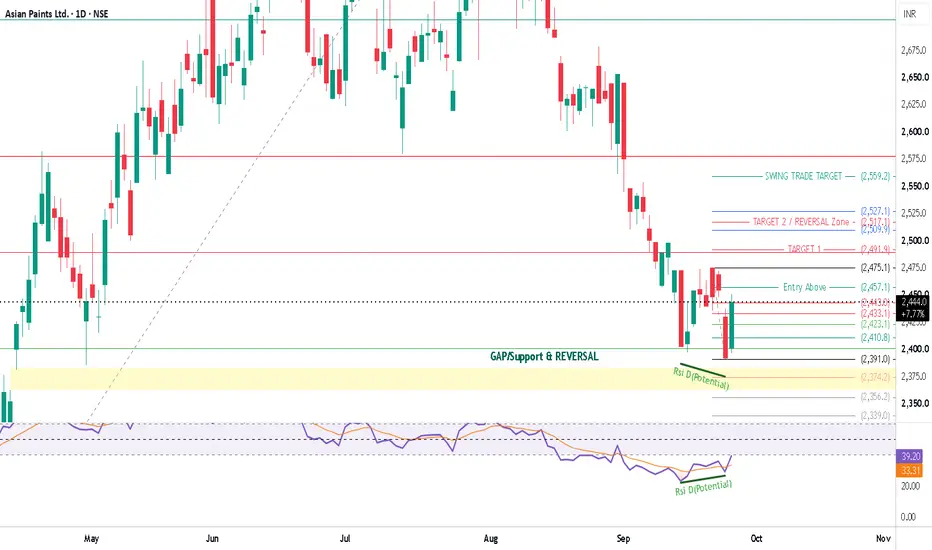
Asian Paints – Daily Analysis – Up to 4.16% UPSIDE Potential. NSE:ASIANPAINT Asian Paints Ltd. is attempting a technical reversal on the daily chart after experiencing a steep correction from its high. Price recently swept into a lower demand area, creating a base low at ₹2,356.20 inside the major GAP/Support & REVERSAL box ( ₹2,356.20 – ₹2,391.00 ). This lower test is accompanied by a clear RSI Bullish Divergence (Rsi D Potential) , as the RSI oscillator makes higher lows against lower price levels. Currently trading at ₹2,444.00 (+2.14%), p
NSE:ASIANPAINTLong
by JaiLaxmiMata
The Golden Marubozu Trap : A Price Action Strategy StudyThis historical March 2026 study demonstrates a framework I call the Golden Marubozu Trap Setup. Using older than 3 months charts here to showcase a concept for educational purposes only It starts on the Monthly timeframe. First, I identify a significant Swing Low → Swing High and apply Fibonacci retracement across the move. The key observation comes when price produces a strong bearish monthly candle and pushes below the 61.8% Fibonacci retracement. At first glance, the breakdown looks dec
NSE:DLFLong
by Apoorv-Dubey_SEBI-RA
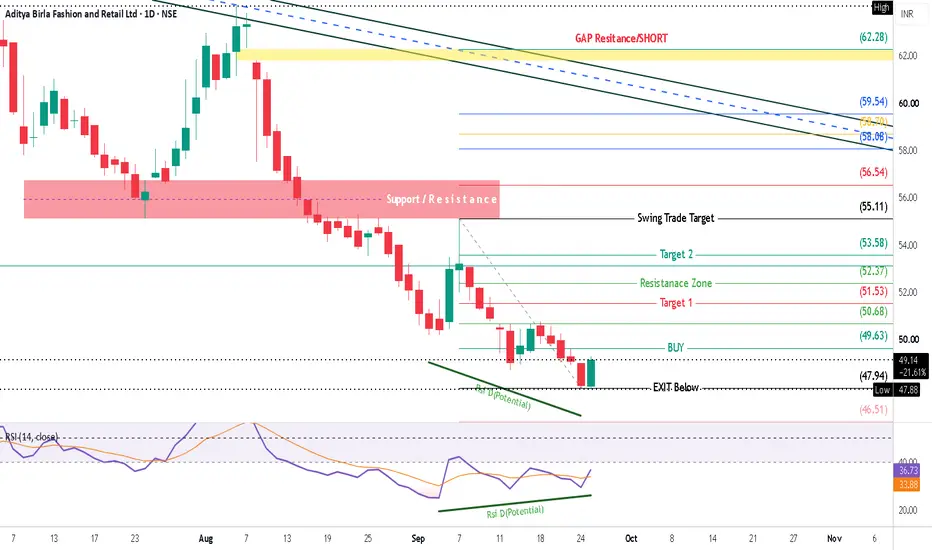
ABFRL – Daily Analysis – 4.5% to 11.5% UPSIDE Potential.NSE:ABFRL Aditya Birla Fashion and Retail Ltd (ABFRAL) is attempting to form a short-term base on the daily chart following a steep decline from its swing high above ₹62.00 . Price recently established a lower low around ₹47.88 , accompanied by an early RSI Bullish Divergence (Rsi D Potential) signal, as the RSI indicator printed a higher low against declining price levels. Currently trading at ₹49.14 (+2.25%), the stock is coiling below the BUY trigger level at ₹49.63 , setting up
NSE:ABFRLLong
by JaiLaxmiMata
BEL: Big Move Ahead? Breakout vs BreakdownBHARAT ELECTRONICS LTD. (BEL) – TECHNICAL ANALYSIS Chart Timeframe: Daily CMP: ₹393.55 Setup: Descending Channel + Support Zone + Elliott Wave Structure 1. Key Technical Observation BEL has been trading inside a well-defined descending channel since the March 2026 high. Price has now reached an important support zone of ₹382–389 , where previous price reactions are visible. The stock is currently trading around ₹393.55, slightly above this support area. This makes ₹382–389 an imp
NSE:BELLong
by LiveTradingBox
1
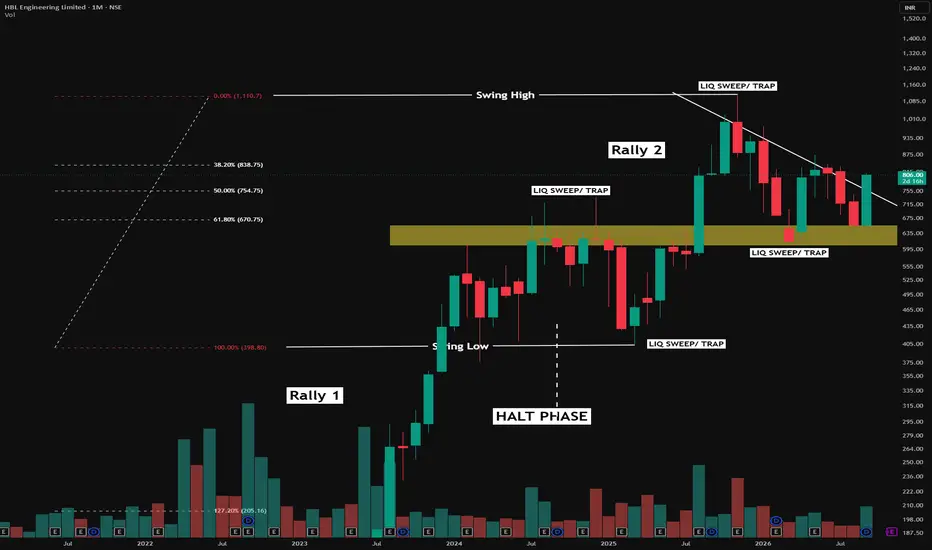
Rally Halt Rally: The Simple Cycle Most Traders IgnoreHistorical chart older than three months, shared solely for educational purposes to explain market structure and technical-analysis concepts. No current market view or recommendation is being expressed. When viewed candle by candle, markets can look complicated. Zoom out to the monthly timeframe, and the structure can become surprisingly simple.Noiseless This historical chart demonstrates a cycle I repeatedly study. Rally 1 : Price enters a strong expansion phase. As momentum builds, atte
NSE:HBLENGINELong
by Apoorv-Dubey_SEBI-RA
OPTIEMUS It partnership with CMF Brand, circuit hit. After 20%, then another 20% circuit. Let the price fall a little, let it touch 10–20 EMA support. I will enter after it supports. This time will not enter above high because those who entered after the news will book profit and exit. Let the weak hands exit. SL must be hard.
NSE:OPTIEMUSLong
by Parlar2302
KROSS ; En: 284Breaking all-time high of Sept 24. Big green candle with volume breaks the level. Let the stock take 10–20 EMA support, then enter above 284.
NSE:KROSS
by Parlar2302
INDORAMA ; En: 113It is breaking 2004 high. Entry at 113 level. 9–10% SL, target near 159, 2nd target 209. But it is on a larger timeframe. What we can do is initially book 15–20%, then exit . Monthly chart to understand, weekly to take trade.
NSE:INDORAMALong
by Parlar2302
AGI ; En: 891Not a very satisfying chart but looks like it can break Oct 25 level. If it breaks, target can be 1080. Maximum chances it will hit SL. Can be traded with strict SL. I think the 1080 to 1146 journey will be much smoother
NSE:AGILong
by Parlar2302
AVADHSUGAR ; En: 892Price already moved from 646 to 885. Now some volume candles created. A little time correction, then enter above 891.
NSE:AVADHSUGARLong
by Parlar2302
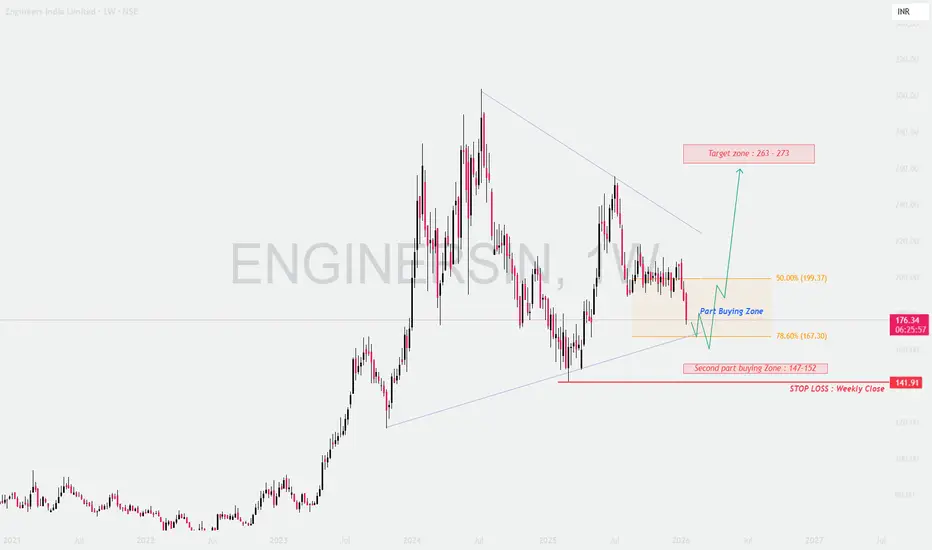
ENGINERSIN : at a Make-or-Break Weekly Zone📊 Engineers India Limited – Weekly Technical View CMP: ~₹176 | Timeframe: Weekly Trend: Higher-timeframe uptrend, currently correcting 🔍 Structure After a strong rally in 2023–24, the stock is in a healthy corrective phase inside a broad rising structure. This is consolidation, not breakdown. 📌 Key Levels & Psychology 🟦 Buy Zone: ₹167–199 (50%–78.6%) • Value area after rally • Dip buyers & short covering active 🟨 Deeper Buy Zone: ₹147–152 • Panic selling exhaustion zone 🔴 Invalidation: We
NSE:ENGINERSIN
by LiveTradingBox
Updated
One point looking good from here *One Point One Solutions Ltd - ₹69.60* - *Pattern:* 2 Year Darvas Box Consolidation (2024-2026) - *Darvas Box Range:* 40 - 72 - *Breakout Level:* 69.60 - Breakout Confirmed with high volume (42M) - *Supply / Resistance Zone:* 72 - 80 (Potential selling pressure) - *Support Level:* 40.44 Educational Purpose Only - Not a Buy/Sell Recommendation | Not SEBI Registered
NSE:ONEPOINT
by TheAlkesh
3
Smart Money Footprint: Step-by-Step Price MovementNSE - The chart shows a controlled stair-step decline, where each downward move is followed by a small pause before the next leg lower. From a Smart Money perspective, this may indicate that larger participants are managing their participation gradually rather than aggressively loading positions at once. Price is now approaching the zone where strong buying interest was visible during the IPO session. This area may therefore become important for studying liquidity, absorption and buyer reaction.
N
by Arvind_Share_Academy
Bharat Forge Ltd - Inverted Head and ShouldersBharat Forge is forming a classical Inverted Head & Shoulders pattern, a potential bullish reversal structure visible on the chart. The pattern will become technically active only after a decisive breakout and sustained closing above the neckline zone. A failed breakout or rejection from the neckline would weaken the setup. The RSI has remained above the 50 level during the last several sessions, indicating improving bullish momentum and increasing buyer participation. The 50 EMA is also slopin
NSE:BHARATFORG
by Arvind_Share_Academy
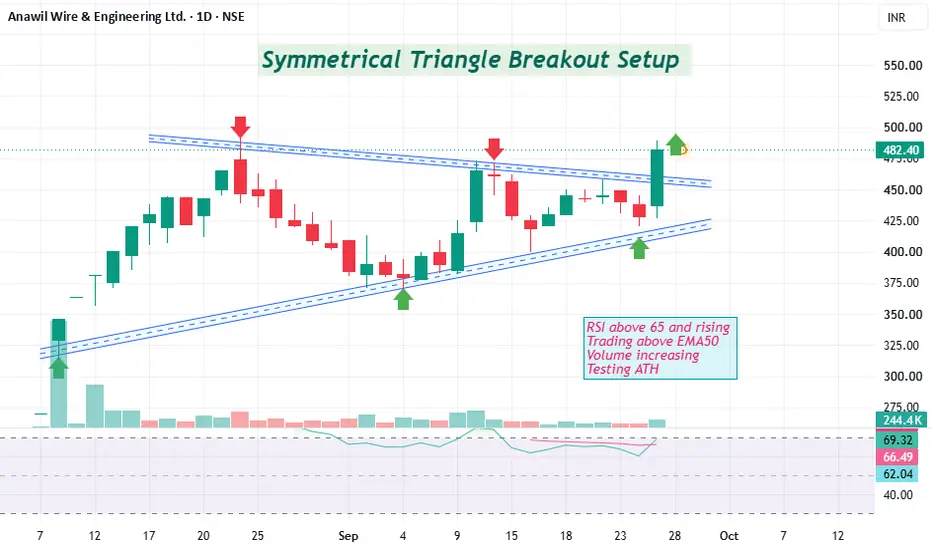
Breakout in Anawil WireSymmetrical Triangle Breakout Setup RSI above 65 and rising Trading above EMA50 Volume increasing Testing ATH Disc: for study, not a recommendation
ALong
by plus_charts
Breakout in ABDLCup & Handle Breakout Setup RSI above 65 and rising Trading above EMA50 Volume spurt 10+ months of consolidation Breaking ATH Disc: For study, not a recommendation
NSE:ABDLLong
by plus_charts
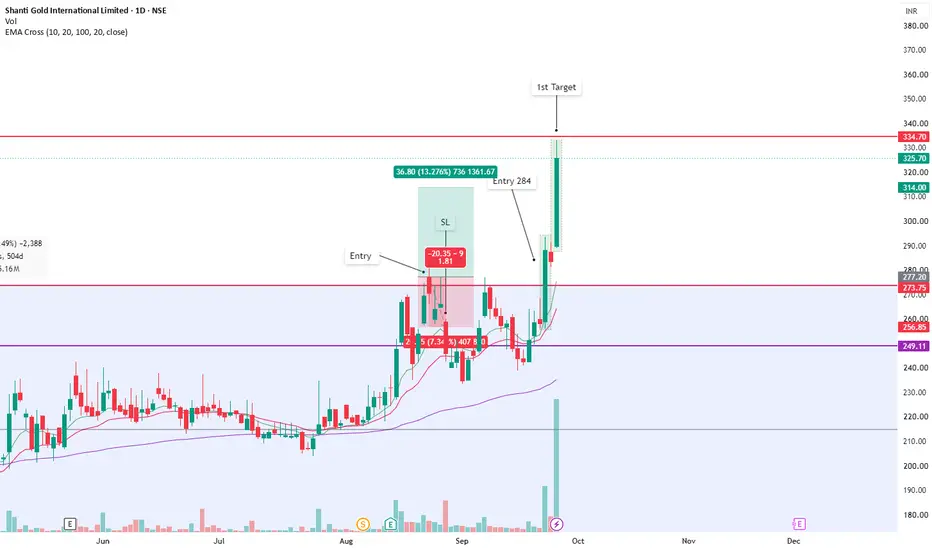
SHANTIGOLD ; En: 2841st entry on 24th August but SL hit. Re-entered at high. 1st target 334.70. Expect a little consolidation near EMA 10–20, then target 390.
NSE:SHANTIGOLDLong
by Parlar2302
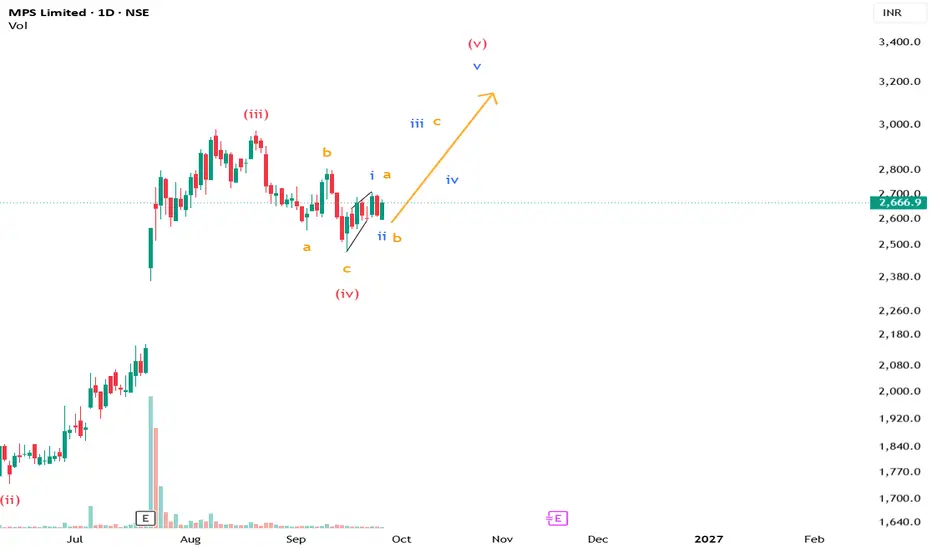
MPS – Two Counts Worth TrackingThe primary count suggests the larger Wave (iv) correction may be complete, with the next impulse developing higher. Within this move, blue Wave 1 appears to have formed as a Leading Diagonal, followed by Wave 2. There is also an alternate orange ABC count, where the correction from the recent high is still unfolding. This would mean the current bounce may be part of Wave B, with Wave C still pending. The next few sessions should help distinguish between the two structures. #MPS #ElliottWave
NSE:MPSLTDLong
by PipVoyager
HBL Engineering (HBLENGINE) Structural BreakthroughHBL Engineering (HBLENGINE) is flashing a highly anticipated structural breakout after trapping price action within a massive triangle pattern just below its previous major resistance hurdle at the 700 mark. The core intent of this trend is prolonged compression leading to institutional expansion. By consolidating tightly around the multi-month previous high of 700, the stock effectively squeezed out weaker retail hands while building energy. The creation of the triangle pattern right below a he
NSE:HBLENGINE
by thp_trading_lunatic
CHEMPLAST Bullish RSI DivergenceChemplast Sanmar (CHEMPLASTS) is flashing strong, textbook reversal signals after a prolonged, continuous downtrend. The core intent of this trend is a transition from extreme seller exhaustion to active buyer accumulation. While the falling price action suggests continued weakness, the underlying market structure reveals a completely different story. The distinct bullish RSI divergence proves that selling momentum has run out of steam, while a massive surge in trading volumes over the last few
NSE:CHEMPLASTSLong
by thp_trading_lunatic
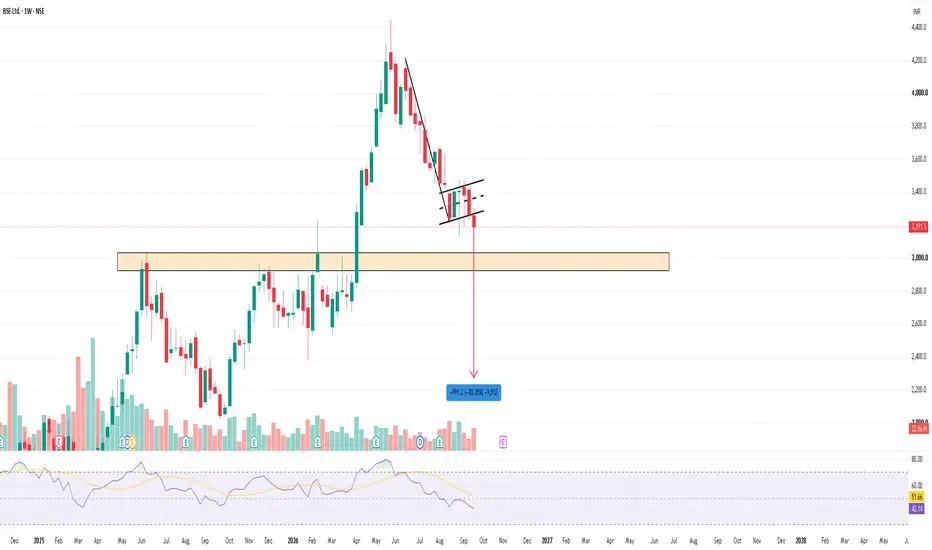
BSE Ltd — Weekly Analysis - Bearish 🔻 Inverted Flag & Pole breakdown confirmed ✅ Breakdown + retest completed, with rejection from the flag resistance. Immediate support: ₹3,000–2,950 🔻 Below ₹2,950 → ₹2,700 → ₹2,400 → ₹2,200 Major resistance: ₹3,350–3,450 Above ₹3,450 → bearish setup weakens. 📉 RSI ~42 → momentum remains weak. View: Bearish below the retest zone. The projected measured-move target from the pattern is around ₹2,200. DISCLAIMER: For educational and informational purposes only. This is my person
NSE:BSEShort
by LogicTradeRoom
KAYNES TECHNOLOGY INDIA LTD (NSE) – 1H ELLIOTT WAVE OUTLOOKNSE:KAYNES has completed a large A-B-C corrective decline from the wave (b) high near ₹7,600, with wave (a) unfolding into a full 5-wave impulse (①-②-③-④-⑤) down to the wave (c) low near ₹2,995. Wave Structure: Wave (a): 5-wave decline from ₹7,600 to the (c) low From the (c) low, a new impulse is developing: wave ① up → wave ② down → wave ③ up (strongest leg) → wave ④ pullback → wave ⑤ currently completing near ₹3,650 This wave ⑤ marks the end of minor wave 1/A Price is now expected to corr
NSE:KAYNES
by hardeepssethi
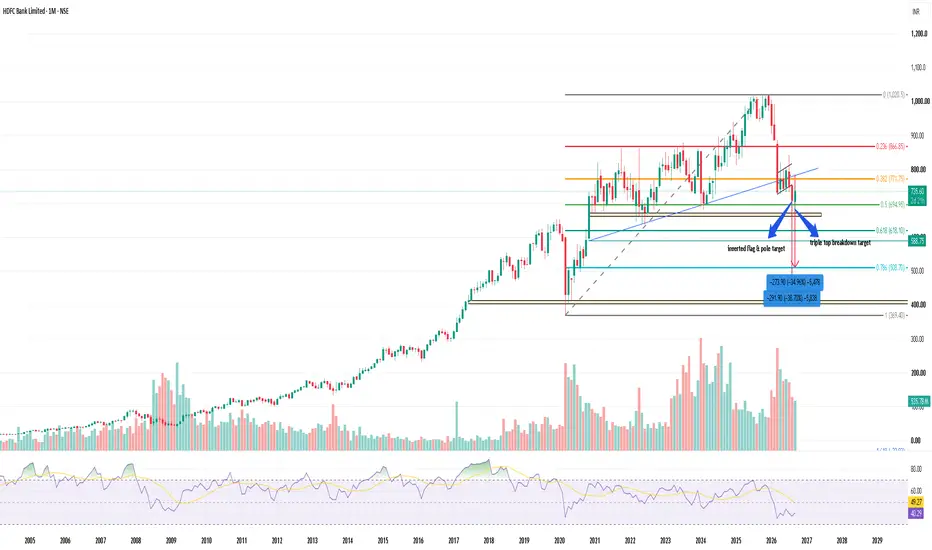
HDFC Bank — Weekly AnalysisCurrent Price : 735.60 🔴 Triple-top breakdown + Inverted Flag & Pole structure visible. Price is below 0.382 Fib ₹771.75 → resistance. ₹695 (0.50 Fib) is the key support. 🔻 Below ₹695 → ₹618 → ₹589 → ₹509 🔼 Reclaim above ₹772 → bearish setup weakens; ₹867 becomes next resistance. Key view: Structure remains bearish below ₹772, with ₹695 as the crucial breakdown level. Wait for a weekly close below ₹695 + retest for stronger downside confirmation. Bank Nifty: Sust
NSE:HDFCBANK
by LogicTradeRoom
Setup for ONGC The levels 238.35 & 237.84 will work as make or break in combination of the zone highlighted to grab opportunities for trades this week.
NSE:ONGC
by LucknowChartist
123456789101112131415161718192021222324252627282930313233343536373839404142
…999

Made by humans

Select market data provided by ICE Data Services. Select reference data provided by FactSet. Copyright © 2026 FactSet Research Systems Inc.Copyright © 2026, American Bankers Association. CUSIP Database provided by FactSet Research Systems Inc. All rights reserved. SEC filings and other documents provided by Quartr.© 2026 TradingView, Inc.

SOC 2 CompliantGDPR Compliant
More than a product
  • Supercharts
Screeners
  • Stocks
  • ETFs
  • Bonds
  • Crypto coins
  • CEX pairs
  • DEX pairs
  • Pine
Heatmaps
  • Stocks
  • ETFs
  • Crypto coins
Calendars
  • Economic
  • Earnings
  • Dividends
  • IPOs
More products
  • News Flow
  • Portfolios
  • Fundamental Graphs
  • Yield Curves
  • Options
  • Macro Maps
  • Pine Script®
  • MCP Server
Apps
  • Mobile
  • Desktop
Community
  • Social network
  • Wall of Love
  • Refer a friend
  • Creator program
  • House Rules
  • Moderators
Ideas
  • Trading
  • Education
  • Editors' picks
Pine Script
  • Indicators & strategies
  • Wizards
  • Freelancers
  • Marketplace
Tools & subscriptions
  • Features
  • Pricing
  • Market data
  • Gift plans
Trading
  • Overview
  • Brokers
  • Brokers comparison
  • The Leap
Special offers
  • CME Group futures
  • Eurex futures
  • US stocks bundle
About company
  • Who we are
  • Space mission
  • Blog
  • Help Center
  • Careers
  • Media kit
Merch
  • Tarot cards for traders
  • The C63 TradeTime
Policies & security
  • Terms of Use
  • Disclaimer
  • Privacy Policy
  • Cookies Policy
  • Accessibility Statement
  • Trust Center
  • Security tips
  • Bug Bounty program
  • Status page
Business solutions
  • Widgets
  • Charting libraries
  • Lightweight Charts™
  • Advanced Charts
  • Trading Platform
Growth opportunities
  • Advertising
  • Brokerage integration
  • Partner program
  • Education program
Community
  • Social network
  • Wall of Love
  • Refer a friend
  • Creator program
  • House Rules
  • Moderators
Ideas
  • Trading
  • Education
  • Editors' picks
Pine Script
  • Indicators & strategies
  • Wizards
  • Freelancers
  • Marketplace
Business solutions
  • Widgets
  • Charting libraries
  • Lightweight Charts™
  • Advanced Charts
  • Trading Platform
Growth opportunities
  • Advertising
  • Brokerage integration
  • Partner program
  • Education program
Look FirstLook First