• Products
  • Community
  • Markets
  • Brokers
  • More
Get started
  • Markets
  • /India
  • /Stocks
  • /Ideas
Solar Inds cmp 19654 Daily ChartSolar Inds cmp 19654 Daily Chart - Support Zone 17250 to 19500 price band - Resistance Zone 20350 to ATH 22700 price band - Strong Support Band at 18100 to 18900 price band - Breakout done from the Symmetrical Triangle pattern - Heavy Volumes spiked today by demand based buying - Price trending up shouldering the Rising Support Trendline - Anticipate for a fresh momentum based Resistance Breakout
NSE:SOLARINDS
by PIYUSHCHAVDA
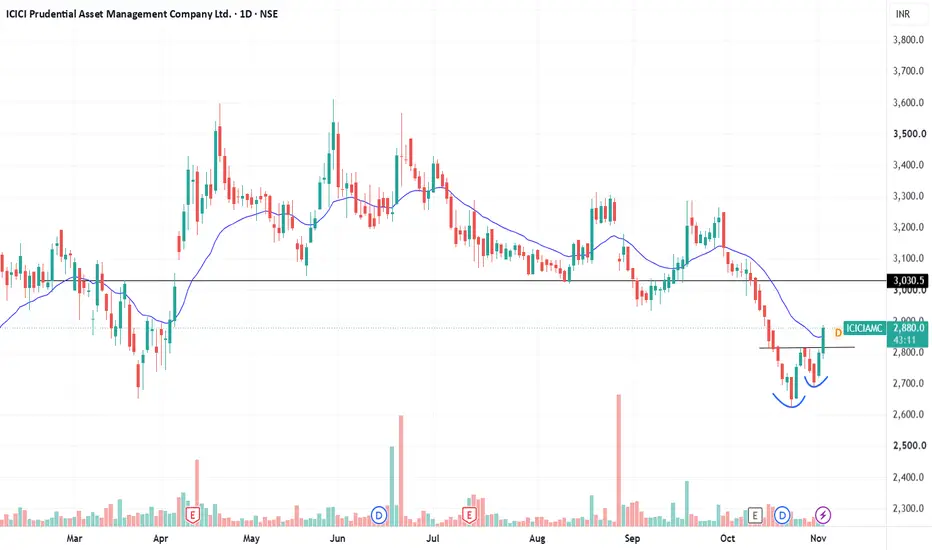
ICICIAMC DOUBLE BOTTOM BREAKOUTICICIAMC breaking double bottom pattern good RSI MACD crossover happening good volume last few days target 3030, SL 2650 may retest to 2800 level DISCLAIMER NO BUY/SELL RECOMENDATION
NSE:ICICIAMCLong
by NeetikaSri
BHARTIAIRTEL DESCENDING TRIANGLE BREAKOUTBharti Airtel breaking ascending triangle weekly good volume since last few week RSI above 60, MACD crossover done target 2170 soon SL 1900 strong support @mohammad-hassan-1750 DISCLAIMER NO BUY/SELL RECOMENDATION
NSE:BHARTIARTLLong
by NeetikaSri
BSE longAfter 5 months of consolidation (on low volumes), BSE has made a Inverted HnS on weekly and broken out of the neckline (Reversal confirmation). The Oi data shows Puts breaking down. Results next week. This name definitely needs attention by the Bulls
NSE:BSELong
by Kool_kash
Updated
1
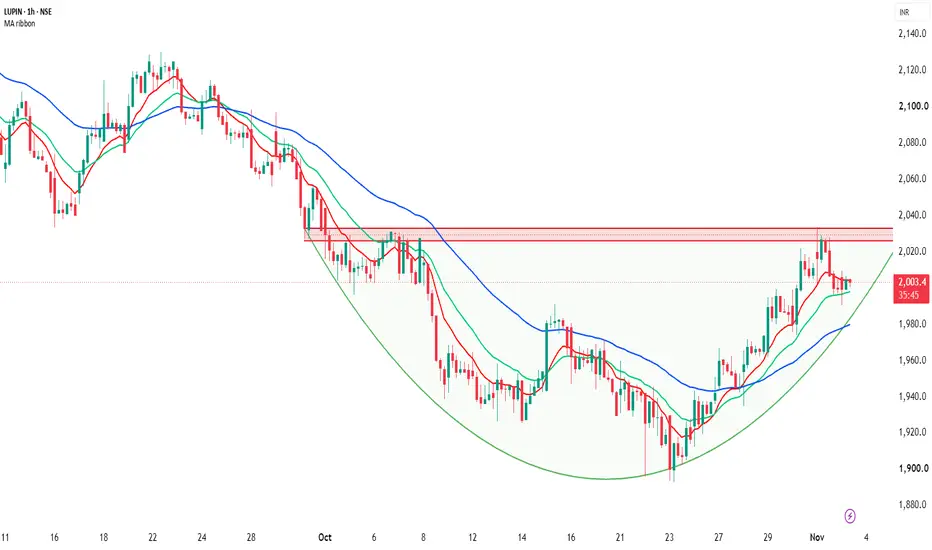
Lupin - Forming Rounding Bottom PatternLupin is showing signs of a potential Rounding Bottom formation, indicating a gradual shift in price structure from bearish to bullish. Key Technical Observations: => The rounded price structure suggests improving buying interest. => Moving averages are turning upward, indicating positive momentum. => The moving averages are aligned in the correct bullish sequence, supporting the improving trend structure. => Price is approaching an important resistance zone. Technical Perspective: A developi
NSE:LUPIN
by Arvind_Share_Academy
L&T FINANCE: Cup & HandleLTF has completed a potential Cup & Handle formation near the ₹255 resistance zone. The pattern structure is visible, but bullish confirmation is still awaited. 🎯 Key Observation: ==> Support Zone: ₹234–₹237 ==> Neckline Resistance: ₹254–₹255 ==> RSI near 64 indicates improving momentum. Technical Outlook : A decisive bullish confirmation above ₹255 needed, supported by strong volume and sustained price action, would confirm the pattern. If confirmed, the price may follow the classical Cup &
NSE:LTFLong
by Arvind_Share_Academy
CDSL – ascending triangle pattern CDSL – ascending triangle pattern 1. Strong Support Zone (₹1,160–1,200): Price is approaching a major ascending trendline support, making this an attractive potential accumulation zone. 2. Weekly RSI Near 40: RSI around 40 indicates relatively weak momentum and proximity to the lower end of its normal range, offering a potential reversal opportunity. 3. Risk-Reward Opportunity: Buying near ₹1,160 provides an opportunity to enter close to long-term support with a favourable risk-reward ratio. 4
NSE:CDSLLong
by HRpicks
4
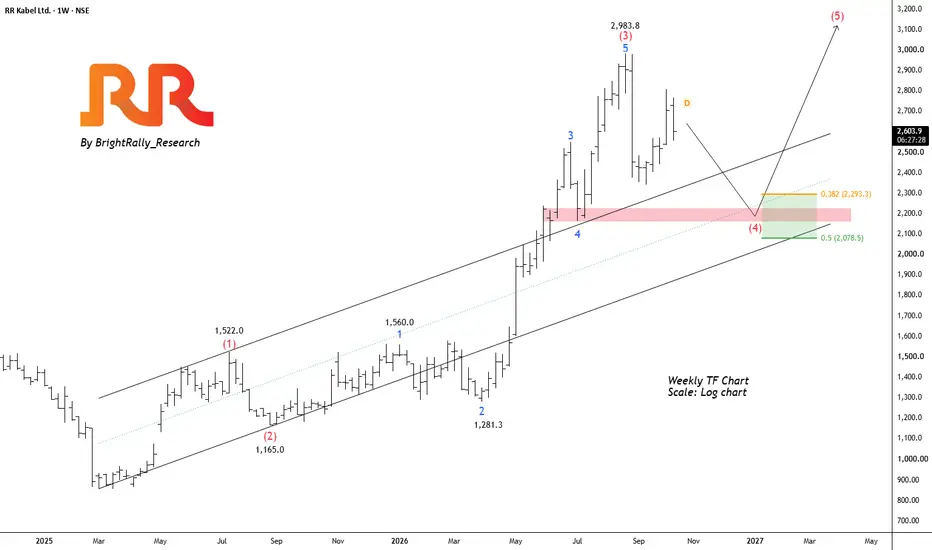
RR Kabel: Wave (4) Correction Before the Next Bullish Move?RR Kabel is showing a strong bullish Elliott Wave structure on the weekly chart, with Wave (3) reaching ₹2,983.8. The stock is now undergoing a corrective phase that could develop as Wave (4) within the broader uptrend. The rising channel continues to support the bullish structure. The ₹2,200 zone is an important support area to watch during this correction. If the price stabilizes around this level, it could complete Wave (4) and create an opportunity for the next upward move. A sustained brea
NSE:RRKABEL
by BrightRally_Research
Updated
Nelcast: From Historical Supply to a New Price StructureApoorv Dubey | SEBI Registered Research Analyst Nelcast’s monthly chart shows a sequence of historical supply, a breakout, a return to the zone and the development of a new structure. 1. Start with the supply zone The red band marks an area where price encountered resistance on earlier occasions. The reactions labelled “Supply” and “Supply 2” make it a useful historical reference. 2. Observe the breakout and return Price later moved above the band, returned to the area and then advanced again
NSE:NELCASTLong
by Apoorv-Dubey_SEBI-RA
4
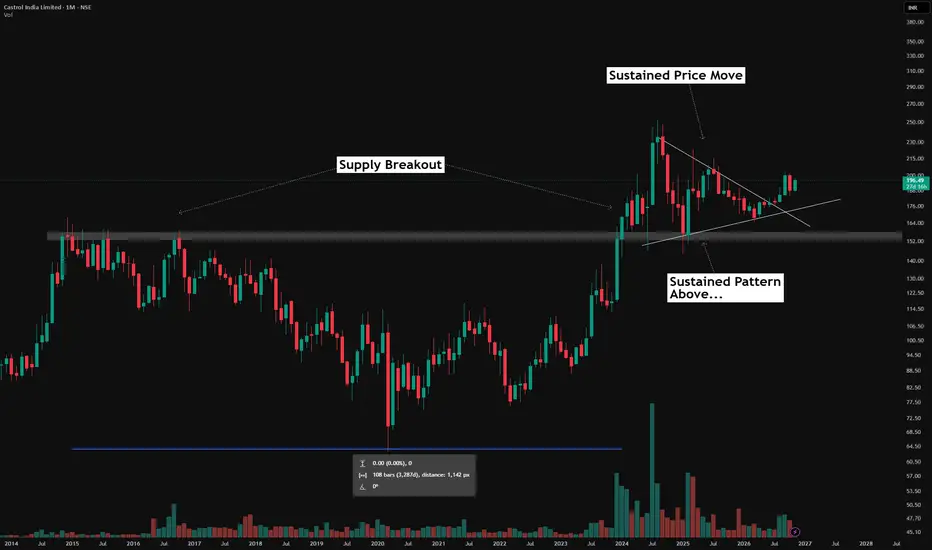
Castrol India: A 3,200-Day Base, Breakout & ConsolidationApoorv Dubey | SEBI Registered Research Analyst What happens after a stock breaks out of a long-term base? That’s the part of the chart I find most interesting. On Castrol India’s monthly timeframe, the grey band marks a historical supply area. The chart shows a broad, cup-like structure spanning more than 3,200 days before price moved above this zone. The breakout was followed by a strong advance. But rather than focus only on that initial move, I like to study what happens after price paus
NSE:CASTROLINDLong
by Apoorv-Dubey_SEBI-RA
My Price Action Framework: Fibonacci, a Slanted CT & My ConceptsApoorv Dubey | SEBI Registered Research Analyst This monthly chart of Ramkrishna Forgings illustrates how I combine familiar price action tools with my own way of drawing and interpreting a structure. Here’s a step-by-step guide you can practise on your own charts: 1. Start by zooming out Open the monthly timeframe and identify a meaningful swing low and swing high. This helps you understand the larger move before studying the correction within it. 2. Add Fibonacci retracement On an upward m
NSE:RKFORGELong
by Apoorv-Dubey_SEBI-RA
Zen Technologies: Reading a Multi-Year Symmetrical TriangleApoorv Dubey | SEBI Registered Research Analyst A symmetrical triangle can look simple: one descending line and one ascending line. The useful part is understanding what those lines tell us about the price structure. On this monthly chart of Zen Technologies, the broader rising support line has been developing for roughly 1,000 days. The descending boundary from the 2024 peak gives us a more recent converging structure to study. What is a symmetrical triangle? A symmetrical triangle forms w
NSE:ZENTECLong
by Apoorv-Dubey_SEBI-RA
2
PCBL Chemical: Buy Dips, Breakout in formationPCBL Chemical appears to be transitioning from a prolonged corrective phase into a base-building structure. The recent price action suggests that selling pressure is gradually easing and buyers are beginning to regain control. At current levels around ₹306, the stock sits at a critical inflection point, where patience and confirmation may offer a better risk-reward profile than chasing price strength. Below two different trade scenario can be drawn from the todays price action 1. Range Trading
NSE:PCBLLong
by DrPrashantVerma
Updated
5
ZEN TECHNOLOGIES – CORRECTION IN PROGRESS........??????ZENTEC – CMP: ₹1687.4; RSI: 50.70 On the monthly and weekly timeframes, the larger price structure is consistent with a completed 5-wave impulsive advance, followed by a potential ABC corrective phase. Within this structure, the C-wave appears to be developing, although the Elliott count remains a working hypothesis. On the daily timeframe, a potential double-top formation is visible around ₹2,024–2,044, with the key neckline near ₹1,600. The stock recently fell to ₹1,585.6, briefly breachin
NSE:ZENTEC
by DrPrashantVerma
Updated
4 Stock Charts + Reliance: Price Action & RSI AnalysisApoorv Dubey | SEBI Registered Research Analyst In today’s TradingView video, I analyse four stock charts alongside Reliance, today’s market hero. Using price action, RSI and my market experience, I explain how I read chart structure and momentum. For educational purposes only. This video is not a recommendation to buy, sell or hold any security.
NSE:RELIANCELong
09:42
by Apoorv-Dubey_SEBI-RA
2
WELSPUNLIV All Time High Breakout- Outperforming Nifty 50 & Nifty 500 - Volumes are good - All time High Breakout with Strong candle - Fundamentals also looking good in recent quarters
NSE:WELSPUNLIV
by Chart_Momentum
Updated
2
Menon Bearings (D): MASSIVE SURGE & RESISTANCE TESTTimeframe: Daily | Chart Scale: Linear Explosive +12.64% surge today backed by a massive 3.62M volume spike! 🔥 Technical Highlights: ✅ Breakout: Exited its recent sideways trend with serious momentum. ⚠️ Major Test: Pushed into a short-term horizontal resistance (Sep '26) but couldn't secure the close. ✅ Volume: Rising volume confirms heavy buyer accumulation. ✅ Momentum: EMAs in positive crossover (Daily/Weekly/Monthly). 🚀 Key Levels to Watch: 🎯 Target: ₹398 (Contingent
NSE:MENONBE
by Learn_with_Pth0mas
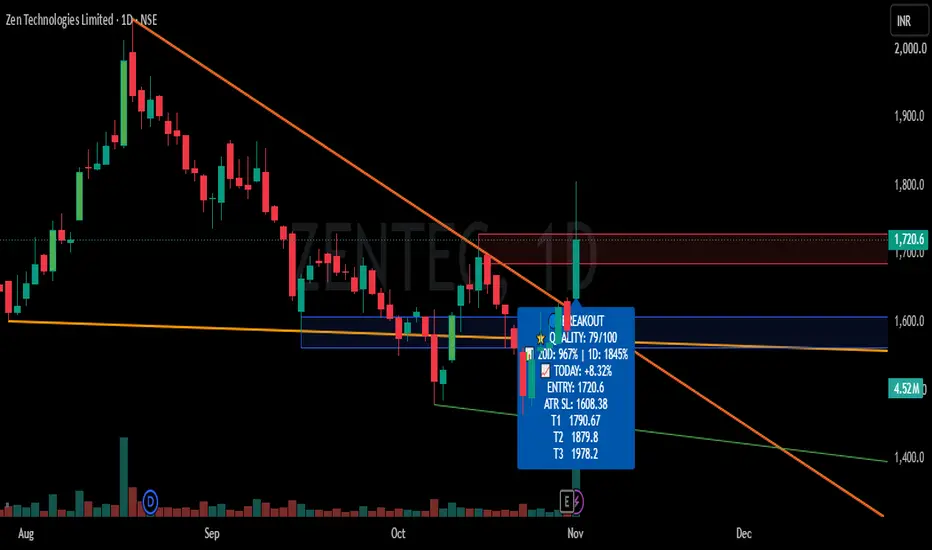
Buy Today, Sell Tomorrow for 3-5% - Daily Breakout SetupZENTECH — BTST BREAKOUT SETUP Entry, Stop Loss & Targets Are Clearly Defined — Helping You Plan Your Trade With Confidence. 📊 Stock Strength: 79/100 (Note: Higher score indicates stronger stock conditions, not guaranteed returns.) A bullish breakout has appeared on the 1D timeframe with positive price action and strong volume expansion. 🔄 Trade Type: BTST ──────────────────── 🎯 TRADE LEVELS ENTRY: ₹1721 🛑 STOP LOSS Previous Candle 🎯 TARGETS 3–5% ──────────────────── 📈 VOLUME 20D Volum
NSE:ZENTECLong
by nemichandbhati
Buy Today, Sell Tomorrow for 3-5% - Daily Breakout SetupKIRLOSBROS — BTST BREAKOUT SETUP Entry, Stop Loss & Targets Are Clearly Defined — Helping You Plan Your Trade With Confidence. 📊 Stock Strength: 69/100 (Note: Higher score indicates stronger stock conditions, not guaranteed returns.) A bullish breakout has appeared on the 1D timeframe with positive price action and strong volume expansion. 🔄 Trade Type: BTST ──────────────────── 🎯 TRADE LEVELS ENTRY: ₹1793 🛑 STOP LOSS ATR SL: ₹1675 🎯 TARGETS 3–5% ──────────────────── 📈 VOLUME 20D Volu
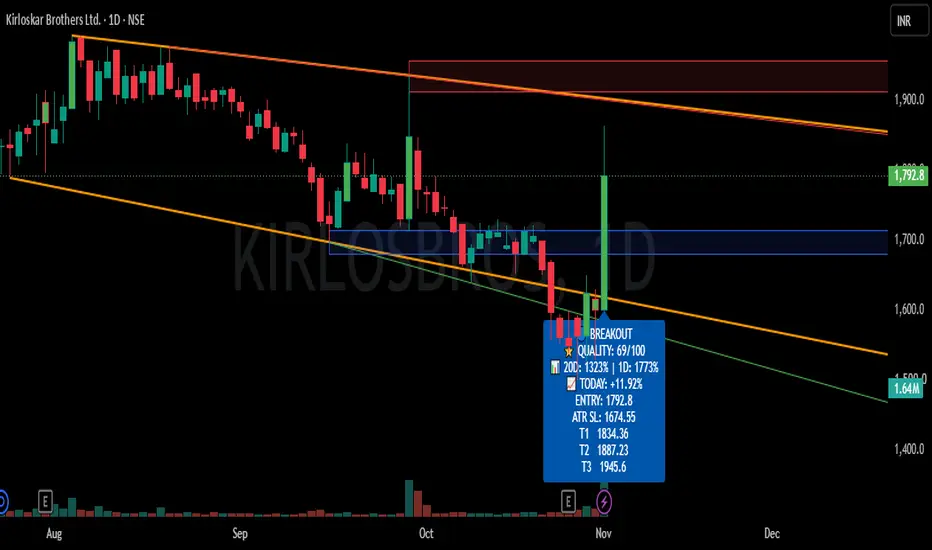
NSE:KIRLOSBROSLong
by nemichandbhati
Buy Today, Sell Tomorrow for 3-5% - Daily Breakout SetupRAJ OIL — BTST BREAKOUT SETUP Entry, Stop Loss & Targets Are Clearly Defined — Helping You Plan Your Trade With Confidence. 📊 Stock Strength: 69/100 (Note: Higher score indicates stronger stock conditions, not guaranteed returns.) A bullish breakout has appeared on the 1D timeframe with positive price action and strong volume expansion. 🔄 Trade Type: BTST ──────────────────── 🎯 TRADE LEVELS ENTRY: ₹46 🛑 STOP LOSS ATR SL: ₹43 🎯 TARGETS 5% ──────────────────── 📈 VOLUME Good ───────────
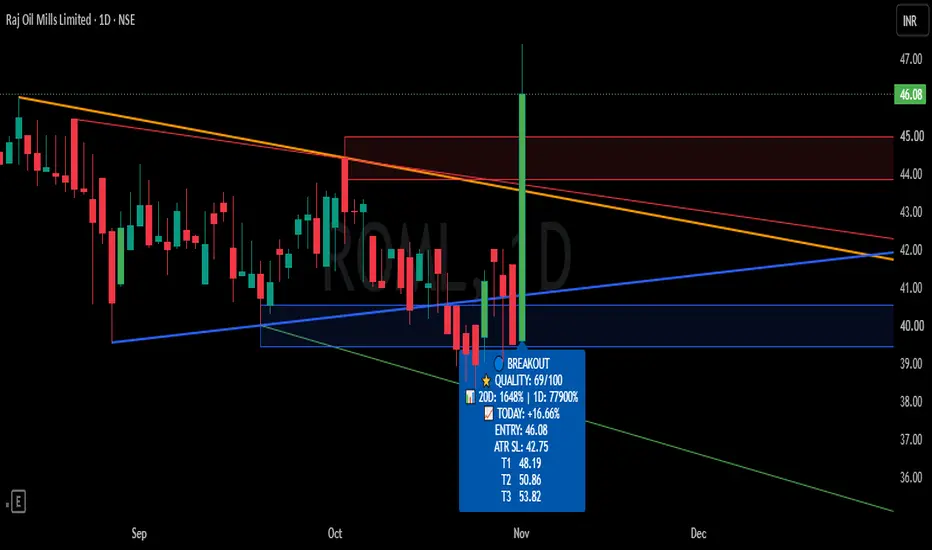
NSE:ROMLLong
by nemichandbhati
How To Understad Option?Institutional Option Trading (7 Key Points): Smart Money Activity – Institutions like banks, hedge funds, and FIIs trade options with large capital, creating strong directional moves in the market. Option Chain Analysis – They focus on OI buildup, unwinding, and PCR to identify accumulation/distribution zones. Liquidity Zones – Institutions trade where liquidity is high (ITM/ATM strikes), ensuring easy entry and exit without slippage. Hedging Strategies – Use advanced strategies like spreads
NSE:HDFCBANKEducation
23:18
by Knowledgehub
10
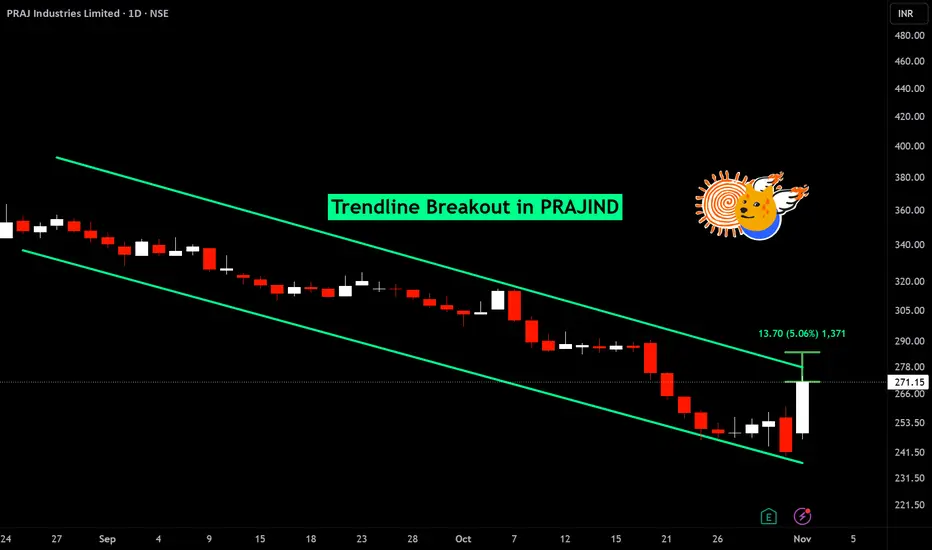
BUY TODAY SELL TOMORROW for 5%DON’T HAVE TIME TO MANAGE YOUR TRADES? - Take BTST trades at 3:25 pm every day - Try to exit by taking 4-7% profit of each trade - SL can also be maintained as closing below the low of the breakout candle Now, why do I prefer BTST over swing trades? The primary reason is that I have observed that 90% of the stocks give most of the movement in just 1-2 days and the rest of the time they either consolidate or fall Trendline breakout in PRAJIND BUY TODAY SELL TOMORROW for 5%
NSE:PRAJIND
by Kapil-Mittal
2
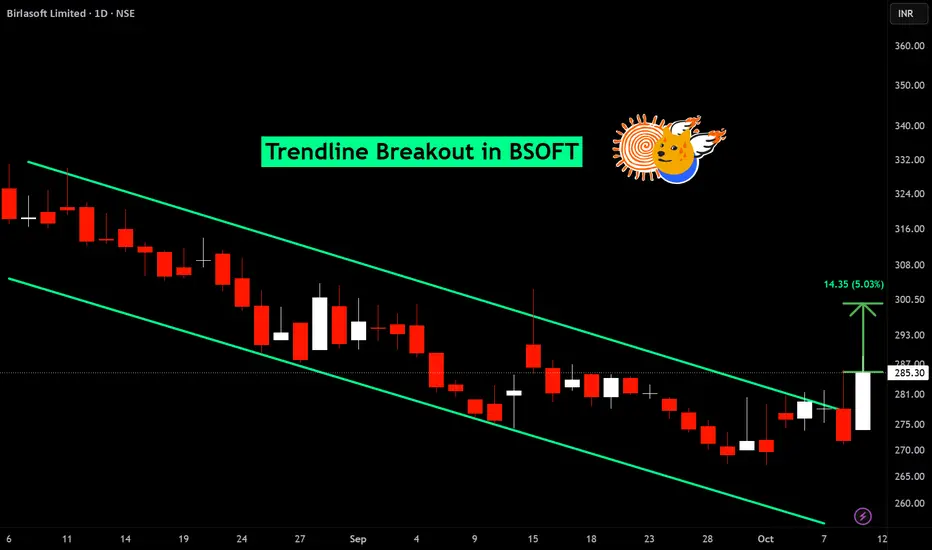
BUY TODAY SELL TOMORROW for 5%DON’T HAVE TIME TO MANAGE YOUR TRADES? - Take BTST trades at 3:25 pm every day - Try to exit by taking 4-7% profit of each trade - SL can also be maintained as closing below the low of the breakout candle Now, why do I prefer BTST over swing trades? The primary reason is that I have observed that 90% of the stocks give most of the movement in just 1-2 days and the rest of the time they either consolidate or fall Trendline breakout in BSOFT BUY TODAY SELL TOMORROW for 5%
NSE:BSOFT
by Kapil-Mittal
Updated
2
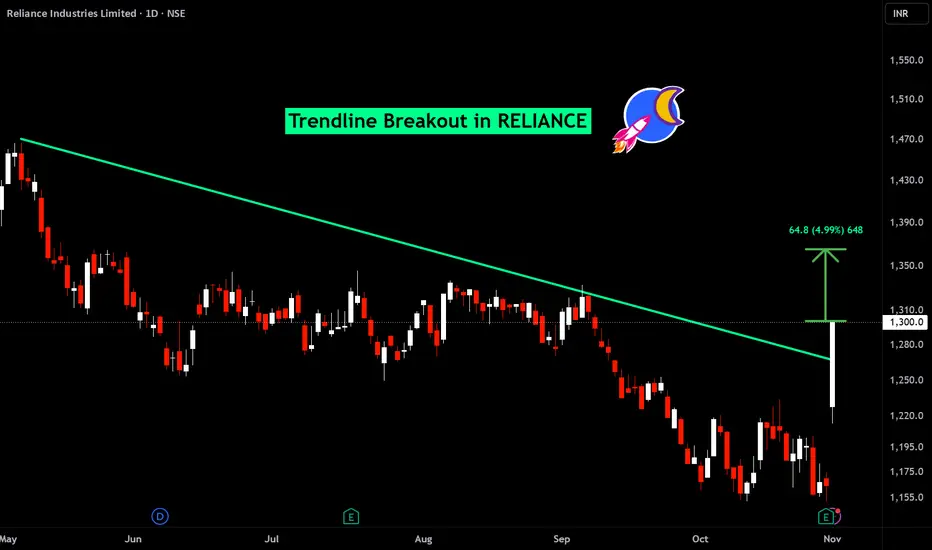
BUY TODAY SELL TOMORROW for 5%DON’T HAVE TIME TO MANAGE YOUR TRADES? - Take BTST trades at 3:25 pm every day - Try to exit by taking 4-7% profit of each trade - SL can also be maintained as closing below the low of the breakout candle Now, why do I prefer BTST over swing trades? The primary reason is that I have observed that 90% of the stocks give most of the movement in just 1-2 days and the rest of the time they either consolidate or fall Trendline breakout in RELIANCE BUY TODAY SELL TOMORROW for 5%
NSE:RELIANCE
by Kapil-Mittal
3
123456789101112131415161718192021222324252627282930313233343536373839404142
…999

Made by humans

Select market data provided by ICE Data Services. Select reference data provided by FactSet. Copyright © 2026 FactSet Research Systems Inc.Copyright © 2026, American Bankers Association. CUSIP Database provided by FactSet Research Systems Inc. All rights reserved. SEC filings and other documents provided by Quartr.© 2026 TradingView, Inc.

SOC 2 CompliantGDPR Compliant
More than a product
  • Supercharts
Screeners
  • Stocks
  • ETFs
  • Bonds
  • Crypto coins
  • CEX pairs
  • DEX pairs
  • Pine
Heatmaps
  • Stocks
  • ETFs
  • Crypto coins
Calendars
  • Economic
  • Earnings
  • Dividends
  • IPOs
More products
  • News Flow
  • Portfolios
  • Fundamental Graphs
  • Yield Curves
  • Options
  • Macro Maps
  • Pine Script®
  • MCP Server
Apps
  • Mobile
  • Desktop
Community
  • Social network
  • Wall of Love
  • Refer a friend
  • Creator program
  • House Rules
  • Moderators
Ideas
  • Trading
  • Education
  • Editors' picks
Pine Script
  • Indicators & strategies
  • Wizards
  • Freelancers
  • Marketplace
Tools & subscriptions
  • Features
  • Pricing
  • Market data
  • Gift plans
Trading
  • Overview
  • Brokers
  • Brokers comparison
  • The Leap
Special offers
  • CME Group futures
  • Eurex futures
  • US stocks bundle
About company
  • Who we are
  • Space mission
  • Blog
  • Help Center
  • Careers
  • Media kit
Merch
  • Tarot cards for traders
  • The C63 TradeTime
Policies & security
  • Terms of Use
  • Disclaimer
  • Privacy Policy
  • Cookies Policy
  • Accessibility Statement
  • Trust Center
  • Security tips
  • Bug Bounty program
  • Status page
Business solutions
  • Widgets
  • Charting libraries
  • Lightweight Charts™
  • Advanced Charts
  • Trading Platform
Growth opportunities
  • Advertising
  • Brokerage integration
  • Partner program
  • Education program
Community
  • Social network
  • Wall of Love
  • Refer a friend
  • Creator program
  • House Rules
  • Moderators
Ideas
  • Trading
  • Education
  • Editors' picks
Pine Script
  • Indicators & strategies
  • Wizards
  • Freelancers
  • Marketplace
Business solutions
  • Widgets
  • Charting libraries
  • Lightweight Charts™
  • Advanced Charts
  • Trading Platform
Growth opportunities
  • Advertising
  • Brokerage integration
  • Partner program
  • Education program
Look FirstLook First