• Products
  • Community
  • Markets
  • Brokers
  • More
Get started
  • Markets
  • /India
  • /Stocks
  • /Ideas
KPITTECH - HARMONIC ABCD Setup📈 **LONG-TERM INVESTMENT ALERT** ⚡ 🔥 **KPIT Technologies** has corrected nearly **70%** from its peak. 💎 Despite the correction, the company remains fundamentally strong with long-term growth potential. 📌 Global leader in Automotive Software & EV Technology. 📌 Strong long-term business model. 📌 Keep this stock on your watchlist for long-term investing. ⏳ Patience is the key. I expect good long-term potential from current levels. KPIT Technologies Ltd (Weekly Time Frame) – Bullish Harmonic Reversal Setup 📊 Stock: KPIT Technologies Ltd (NSE) KPIT Technologies has completed a Bullish Harmonic Pattern near the D point, where the price is finding support around the ₹525–₹560 demand zone. After a prolonged correction, the stock is showing early signs of stabilization, making this an important level to watch for a potential medium-term reversal. Technical Outlook ✅ Bullish Harmonic Pattern completed. ✅ Price is holding above the Potential Reversal Zone (PRZ). ✅ Strong support established near ₹525–₹560. ✅ A weekly close above the immediate resistance could confirm a bullish reversal. Trading Plan Entry: ₹560–₹570 Stop Loss: Below ₹525 Target 1: ₹750 Target 2: ₹900 Target 3: ₹995 Risk Management Maintain a strict stop-loss below ₹525. A weekly close below this support would invalidate the bullish harmonic setup and may lead to further downside. Conclusion: KPIT Technologies is trading near a major long-term support after completing a bullish harmonic pattern on the weekly timeframe. If buyers sustain the current levels and momentum improves, the stock could witness a recovery towards the ₹750–₹995 resistance zone over the coming weeks to months. Wait for confirmation before initiating fresh long positions. Disclaimer: This analysis is for educational purposes only and should not be considered investment advice. Always conduct your own research and follow proper risk management before investing or trading.
NSE:KPITTECHLong
by KMKB
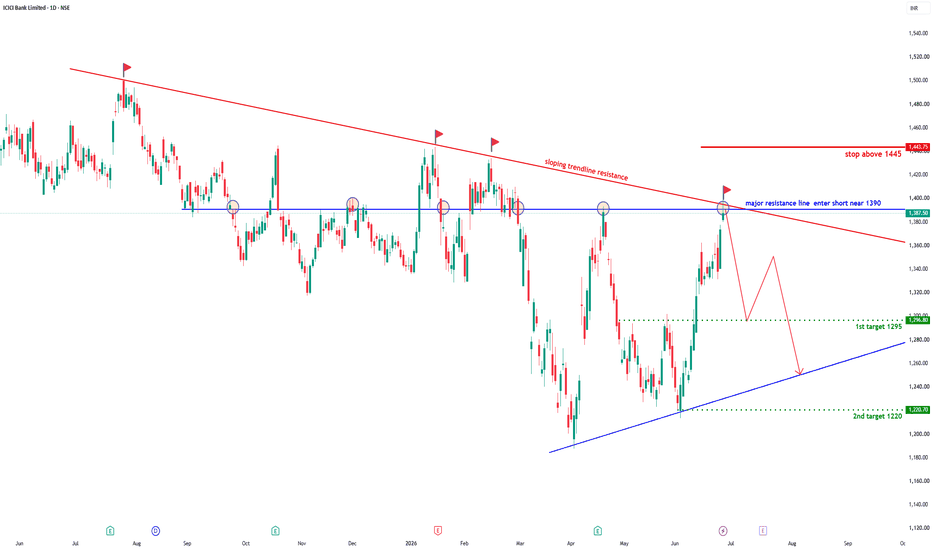
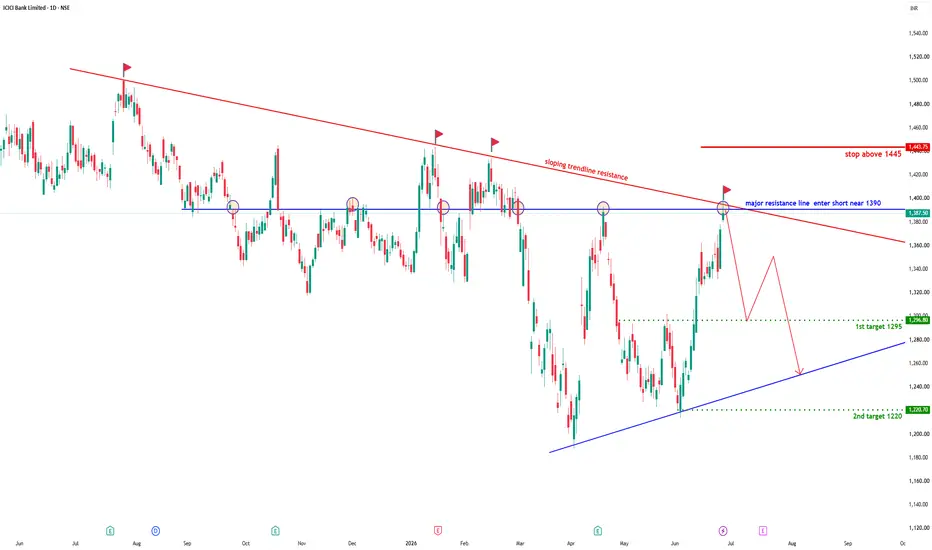
ICICI Bank – Short setup | Major Resistance + Falling TrendlineICICI Bank – High Probability Short Setup | Major Resistance + Falling Trendline Confluence Analysis ICICI Bank has rallied strongly from its recent swing low and is now approaching a significant resistance zone around ₹1390, where two major technical barriers converge: Horizontal resistance that has acted as a strong supply zone multiple times over the past several months. Long-term descending trendline resistance connecting the major swing highs. This confluence creates a high-probability area where sellers may regain control. Historically, every test of this resistance zone has resulted in sharp pullbacks, making this level worth monitoring closely for bearish confirmation. Trade Setup Entry Consider short positions near ₹1390 Prefer waiting for bearish confirmation such as: Bearish engulfing candle Shooting star Evening star Strong rejection wick Lower timeframe breakdown after rejection Avoid entering before confirmation, as resistance levels can briefly break before reversing. Stop Loss Stop Above ₹1445 A sustained close above this level would invalidate the bearish setup by confirming a breakout above both the horizontal resistance and the descending trendline. Risk management is essential. Targets Target 1 ₹1295 This is the first significant support where partial profit booking can be considered. Target 2 ₹1220 If selling pressure continues, price may revisit the rising trendline support around ₹1220, making it the second downside objective. Why This Setup? This trade is based on multiple technical factors aligning together: ✔ Long-term descending trendline resistance ✔ Multi-month horizontal resistance ✔ Previous rejection history at the same price zone ✔ Strong recovery rally into resistance ✔ Favorable Risk-to-Reward ratio if rejection occurs When multiple resistance levels overlap, the probability of institutional selling often increases. What to Watch A clean rejection from ₹1390 with increasing selling volume would strengthen the bearish case. However, if price closes decisively above ₹1445, the setup becomes invalid and short positions should be avoided. Risk Management Never risk more than 1–2% of your trading capital on a single trade. Wait for confirmation instead of anticipating the reversal. Trail your stop once Target 1 is achieved. Book partial profits at intermediate support levels if volatility increases. Conclusion The ₹1390 zone represents one of the strongest resistance areas on the ICICI Bank daily chart due to the confluence of a long-term descending trendline and repeated horizontal resistance. A confirmed rejection from this level offers an attractive short-selling opportunity with downside targets at ₹1295 and ₹1220, while maintaining a clearly defined invalidation above ₹1445. Disclaimer: This analysis is shared for educational purposes only and should not be considered financial or investment advice. Always perform your own research and use proper risk management before taking any trade.
NSE:ICICIBANKShort
by sk_4587
Updated
11
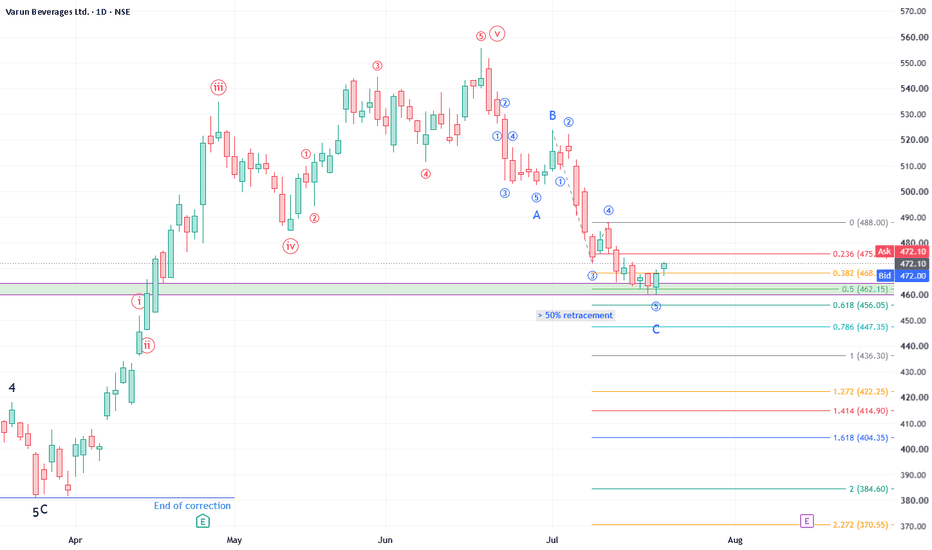
Varun Beverages - Buy Varun Beverages Following a major wave completion during July 2024, the stock went in for a long correction in the form of WXY (one Flat – Wave W, and one Zigzag – Wave Y) which got completed on 23 Mar 2026. Following the completion of correction, the stock completed its first impulse wave on 17 June 2026 as given in the chart. The correction to the present impulse was in the form a smaller zigzag which is a 5-3-5 sequence. Wave A got completed on 29 June 2026, Wave B on 1 July 2026 and Wave C was in formation. It appears that Wave 5 of said Wave C got completed at 50% of the length of Wave 1-3 on 20 July 2026. One may consider buying the stock with a stop loss of 450 which is a lower risk, high reward set up.
NSE:VBLLong
by ChartTheWave
SKYGOLD: Multi-Timeframe Breakout & Strong Momentum ContinuationOverview : Sky Gold and Diamonds Limited (NSE: SKYGOLD) is exhibiting an exceptionally strong bullish structure on the daily (1D) and weekly timeframes, currently trading near the ₹665.45 level. The price action reflects a robust multi-year price discovery phase, driven by aggressive volume expansion and exceptional top-line and bottom-line growth. Trend Direction (Moving Averages) : EMA Alignment : The stock shows a clean, textbook bullish alignment across the short-term and medium-term horizons. The 20 EMA, 50 EMA, and 200 EMA are stacked in correct bullish order with a steep upward slope, confirming strong macro and micro trend continuation without structural interference. Momentum & Oscillators (RSI, MACD, FIB) : RSI (Relative Strength Index): The daily and weekly RSI indicators are hovering in the 75–78 range. While this signals strong buyer momentum and decisive trend strength, it also indicates that the asset is in a near-term overbought state, meaning traders should watch for potential minor consolidations or shallow pullbacks. MACD : The MACD histogram continues to expand in positive territory with a clean bullish crossover, indicating increasing buying pressure. Fibonacci & Price Discovery : Having cleared all major historical resistance levels and Fibonacci extensions cleanly, the stock is currently trading in a "no-resistance" zone of price discovery. Key Levels to Watch : Immediate Support : The primary ascending trendline and breakout zone located around ₹591.92 (-10.9% from current levels). A healthy pullback to test this region would act as a major accumulation point. Resistance : There are no immediate structural overhead resistance levels within 10% of the current price due to the ongoing price discovery phase. Directional Bias: STRONG BUY (Hold / Buy on Dips) The convergence of multi-timeframe bullish alignment, stellar fundamental growth (revenue up over 77% YoY), and clean technical breakouts places the bias firmly in the "Strong Buy" camp. For New Entries : Chasing aggressively at current overbought levels carries short-term risk; waiting for a constructive retest or flag consolidation near the ₹590–₹600 structural support offers a superior risk-to-reward ratio. For Existing Positions : HOLD. Trail stop-losses below the ₹591.92 trendline support to protect accumulated gains while riding the macro trend. Disclaimer: This analysis is for educational purposes only and does not constitute financial advice. Always perform your own research and manage your risk/position sizing accordingly.
NSE:SKYGOLDLong
by bhanushalimonish
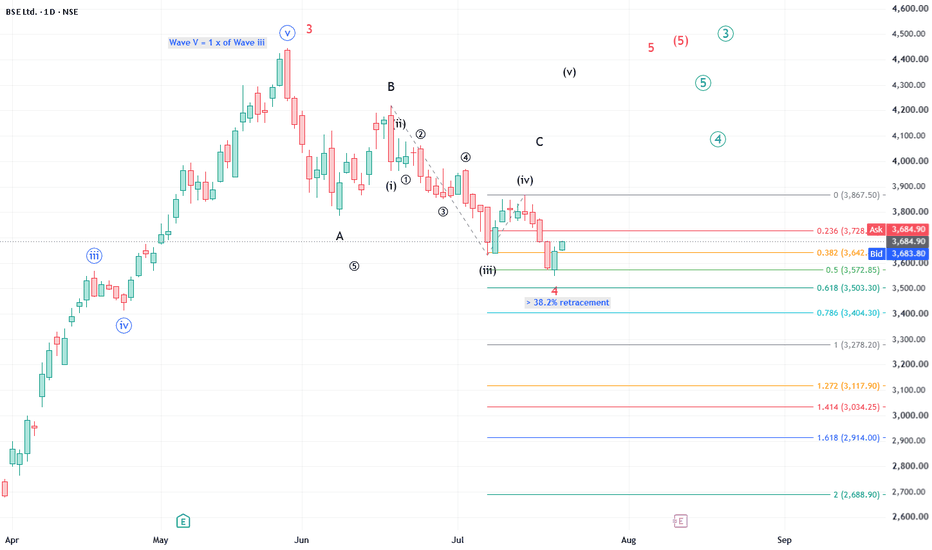
BSE - potential Wave 4 completion - Buy BSE At a larger degree, the stock is presently in its Wave 3 of Primary degree. In the said wave, stock completed minor degree Wave 3 of Wave (5) of Intermediary degree on 27 May 2026 and has been undergoing correction. The correction is in the form of a zigzag which is a 5-3-5 sequence numbered as ABC. Wave A got completed on 8 June 2026, Wave B completed on 17 June 2026. It appears Wave 5 of Wave C got completed at 50% of Wave (i)-Wave (iii) on 20 July 2026. The stock has in the process achieved a retracement of more than 38.2%. One may consider buying the stock with a stop loss of 3530 which is very low risk trade.
NSE:BSELong
by ChartTheWave
88
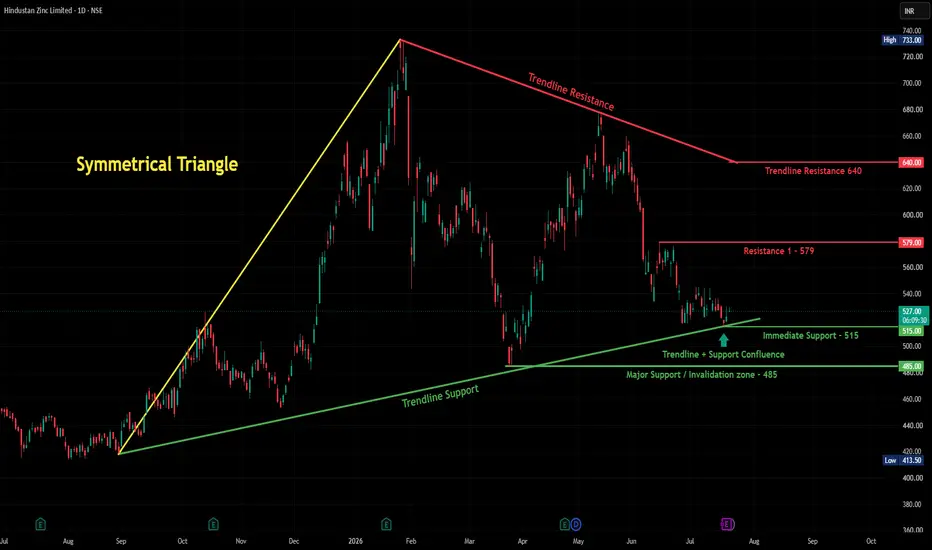
Hindustan Zinc - Squeezed Between Trendline Support & ResistanceOverview Hindustan Zinc is trading in a tightening zone right now — a rising trendline support from below is meeting resistance levels from above, and price is currently sitting right at the middle of this squeeze around 527. What's Happening The stock had a big rally from around 420 last year up to a high of 733, then pulled back hard. Since then, it's been finding support along a rising trendline (currently near 500-515), while facing resistance from a falling trendline coming down from the highs (currently around 640). Right now, price is sitting just above the Immediate Support at 515, and just below Resistance 1 at 579. It's a fairly tight range at the moment — not too far from either boundary. Key Levels to Watch Immediate Support: 515 Major Support / Invalidation Zone: 485 Resistance 1: 579 Bigger Trendline Resistance: 640 Two Ways This Can Go If support holds: A bounce from here, especially with a strong green candle, would be a good sign. First target to watch would be Resistance 1 at 579, and beyond that, the bigger trendline resistance near 640. If support breaks: A close below 515, and especially below the Major Support/Invalidation zone at 485, would mean sellers are in control, and the broader uptrend structure (from the rising trendline) would be in question. Beginner's Lesson When a rising support trendline and a falling resistance trendline start meeting each other, price gets squeezed into a smaller range — like a spring being compressed. This usually means a bigger move is coming eventually, though it's hard to know which direction until price actually breaks one side clearly. That's why we wait for confirmation rather than guessing early. Conclusion Hindustan Zinc is at an interesting squeeze point between support and resistance. As always, we're watching for a clear break either way rather than assuming a direction. We'll update once this resolves. For educational purposes only. Not financial advice. Always manage your risk.
NSE:HINDZINC
by Hkd88
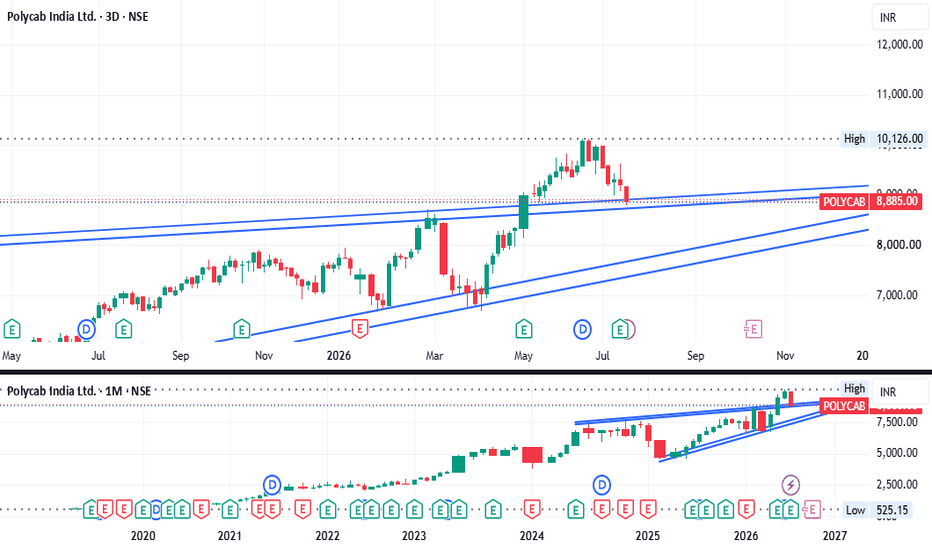
CMP: ₹8,885 | POLYCAB @ NSEThe Story So Far Polycab spent nearly a year (mid-2025 to early 2026) building a base inside a rising channel between ₹7,000–8,300. In April–May 2026, price broke out of the range with a strong bullish marubozu and rallied vertically to an all-time high of ₹10,126 — a clean breakout + trend expansion move. What's Happening Now Post the ₹10,126 top, stock is in a healthy corrective phase — today closing -3.58% at ₹8,885. Price is now coming back to retest the breakout zone (~₹8,700–8,900), which was the earlier resistance and is now expected to flip into support. Classic role-reversal retest in progress. Read The correction from ₹10,126 → ₹8,885 is roughly 12% off the top — normal, not damaging, as long as the breakout zone holds. As long as ₹8,700–8,900 defends on closing basis, this is a textbook retest of a breakout — one of the highest-probability setups in technical analysis. Trend structure (higher-highs, higher-lows on the channel) is still intact. Bias: Constructive above ₹8,700. Wait for a bullish reversal candle (hammer / bullish engulfing / inside-bar breakout) in the ₹8,700–8,900 zone with rising volume before entering. If ₹8,400 gives way, correction deepens toward ₹8,000 — still not a broken trend, just a bigger retracement. Trigger: Behavior in the next 2–3 sessions in this zone will decide the tone. Reversal candle = long setup with SL below ₹8,400, target ₹9,500 → ₹10,126. ⚠️ Disclaimer: This is a personal technical view shared for educational and informational purposes only. It is not investment advice, buy/sell recommendation, or a solicitation to trade. I am not a SEBI-registered analyst. Markets carry risk; past chart patterns do not guarantee future outcomes. Please do your own research and consult a SEBI-registered financial advisor before taking any position. I / my family may or may not hold positions in the stock mentioned.
NSE:POLYCABLong
by dgupta88
22
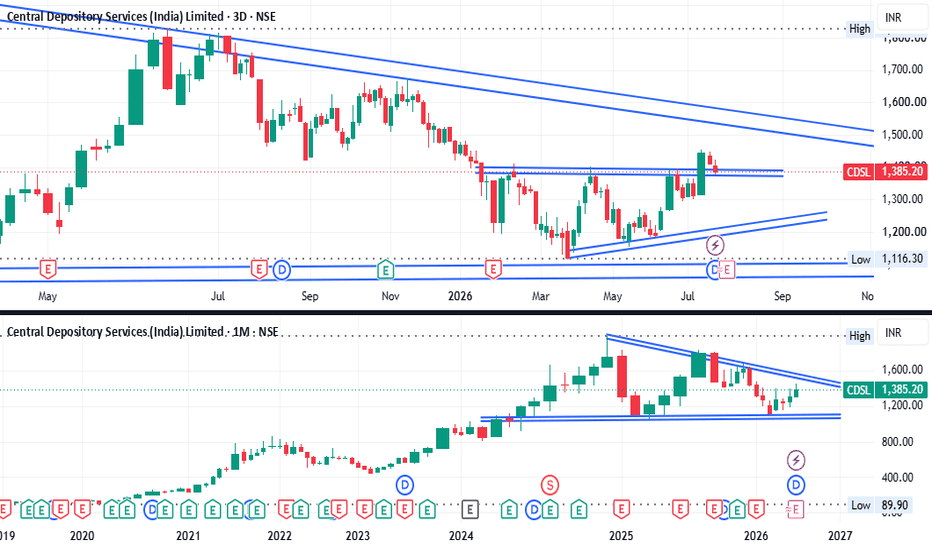
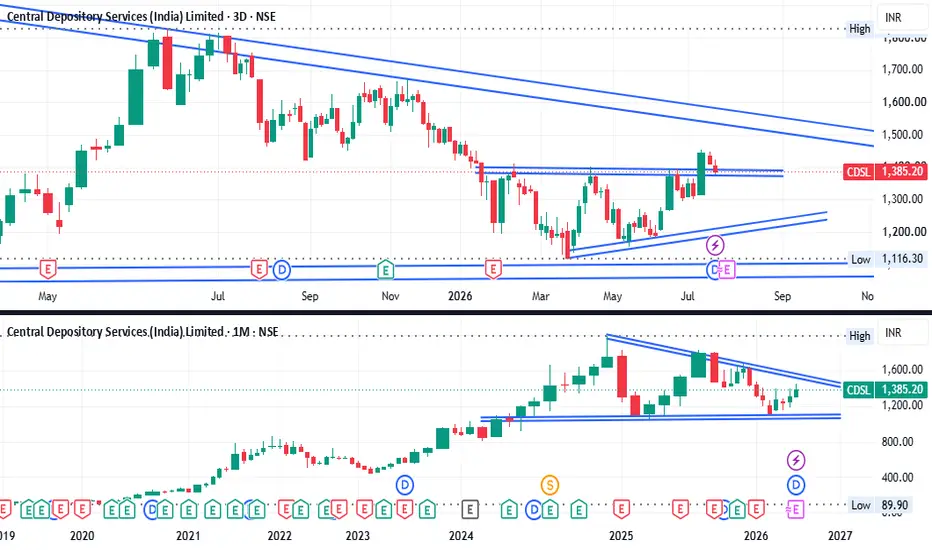
CMP: ₹1,385 | CDSL @ NSECMP: ₹1,385 | CDSL @ NSE Structure Stock was trading inside a falling channel from July 2025 highs (~₹1,850), with a rising trendline forming from the March 2026 low of ~₹1,200. Price has now broken out of the falling channel with strong volume — a clean structural shift after months of lower-highs. The Setup Now Post-breakout, price is doing what a healthy breakout should do — retesting the earlier resistance zone of ₹1,370–1,390, which now flips into support (classic role-reversal / polarity flip). Today's -1.79% dip into this zone is the retest candle, not weakness. Key Levels Retest support (must hold): ₹1,370–1,390 (earlier resistance → now support) Deeper support: ₹1,340 (last defense before structure weakens) Immediate resistance: ₹1,425 (today's high) Breakout target: ₹1,500 (upper channel + measured move) Extended target: ₹1,580–1,600 if 1,500 breaks with volume Invalidation: 3D close below ₹1,340 Read As long as ₹1,370–1,390 holds as support on closing basis, the breakout stays valid and the path of least resistance is up. A bounce from this zone with follow-through volume = green light for ₹1,500. If price slips below ₹1,340 on closing basis, breakout fails and stock re-enters the old range — that's the line in the sand. Bias: Bullish above 1,370. Retest zone offers better R:R than chasing the breakout candle. Ideal entry = bullish reversal candle from 1,370–1,390 with rising volume. Trigger: Watch how price behaves in this retest zone over the next 1–2 sessions. Hold = continuation. Break = failed breakout. ⚠️ Disclaimer: This is a personal technical view shared for educational and informational purposes only. It is not investment advice, buy/sell recommendation, or a solicitation to trade. I am not a SEBI-registered analyst. Markets carry risk; past chart patterns do not guarantee future outcomes. Please do your own research and consult a SEBI-registered financial advisor before taking any position. I / my family may or may not hold positions in the stock mentioned.
NSE:CDSLLong
by dgupta88
GE Power India - Buy Potential completion of Wave (4)GE Power India Ltd GE Power India completed Wave (3) of Intermediary degree of Wave 3 of Primary Degree on 17 Jun 2026 at 4.272 X of Wave (1) of Primary Degree. Wave (2) had a deep retracement of 61.8%. Wave (4) formation appears to be a Flat with a 3-3-5 sequence as given in the chart. Wave 5 of Wave C seem to have formed at similar level of Sub-wave V of Wave 3 and the stock has started moving and hit upper circuit yesterday. The stock has achieved a retracement of about 38.2% of Wave (3). One may consider going long on the stock with a stop loss 770
NSE:GVPILLong
by ChartTheWave
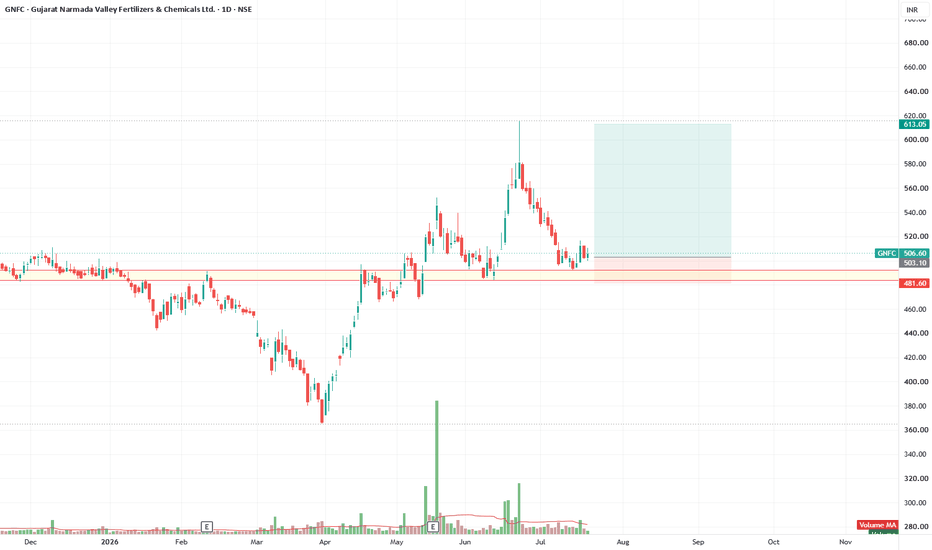
LongBounce back from bottom support zone. Big rally from ₹380 to a June peak near ₹615, now down ~18% from highs and sitting exactly on a support/resistance confluence (₹495-510).
NSE:GNFCLong
by Pawan115
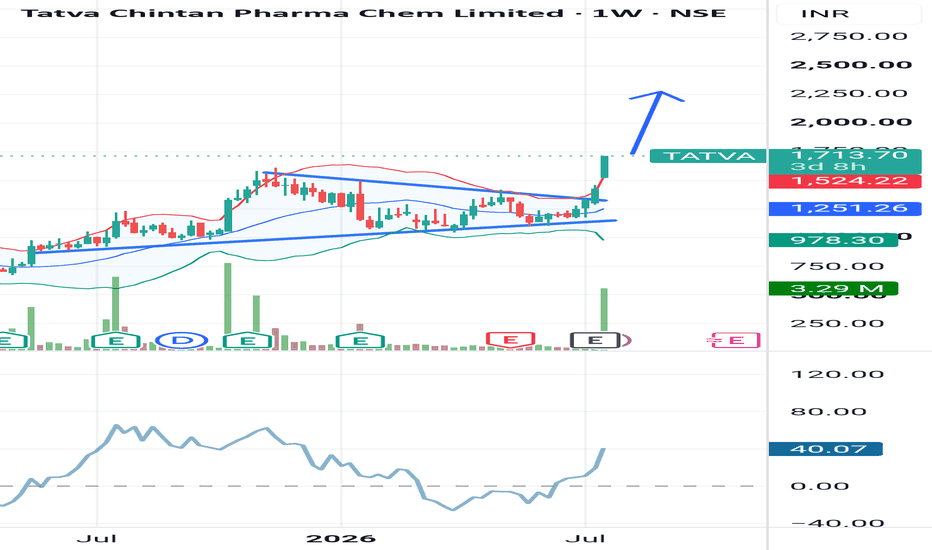
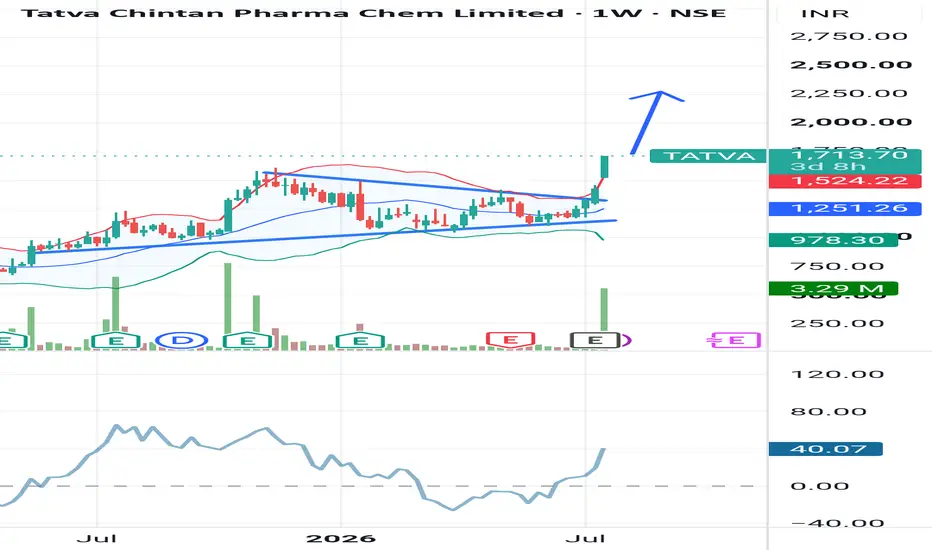
Tatva Chintan BreakoutFundamental:Published excellent Q1 2026-27 result. Technical: Symmetrical triangle breakout. Disclaimer:This is for education purpose only.It is not a Buy or Sell Recommendation.
NSE:TATVALong
by RIDEWINNERSCLUB
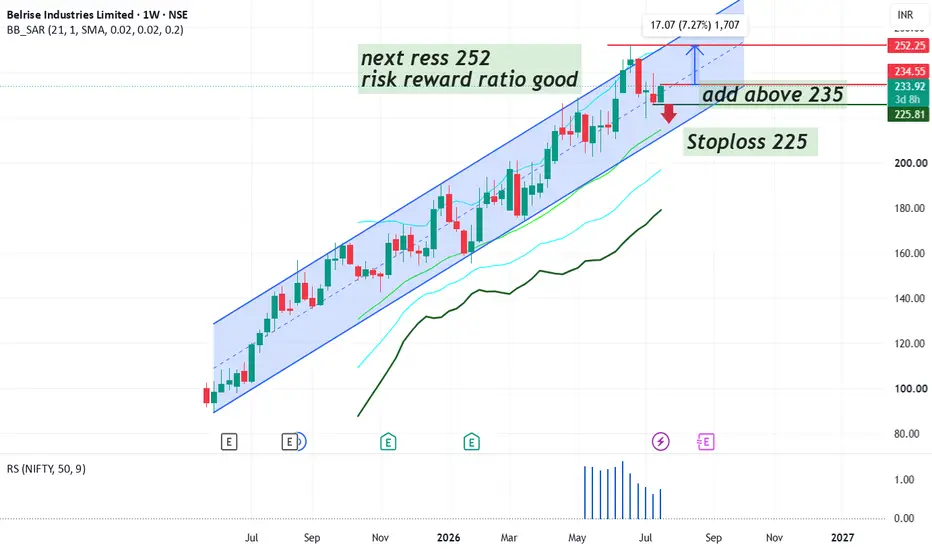
#BELRISE ready for uptrend againstock in bullish uptrend little bit retraced from higher level for better entry so its ready for new run for short term add above 235 for next ress 252 stoploss below 225 risk reward ratio good after that will review again
NSE:BELRISE
by asheshbajpai
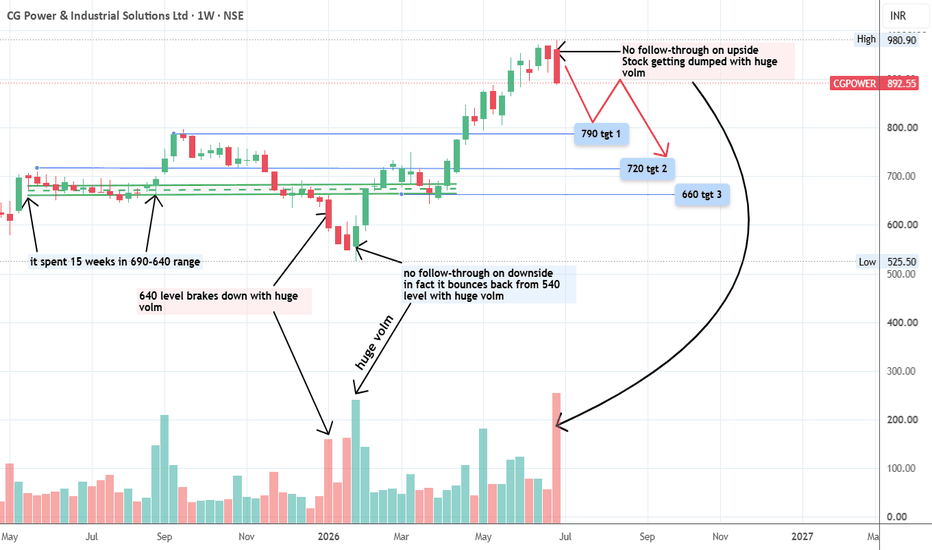
CG Power going down speedily?The 540 to 660 was a good buying area As seen on the charts Stock has started moving down I think because govt has approved 4 chinese companies to bid for power projects in India.
NSE:CGPOWERShort
by TradewithLS
Updated
Inside Bar Pattern : FrontSPInside Bar Pattern from Swing High Price: Probably sweep the Swing Low ATR of Stock: 50-55 Expect retrechment/ Sweep/ Pullback from Swing Low 10-20% of ATR i.e approx 166-170 This is not investment advice
NSE:FRONTSP
by trade_vocate
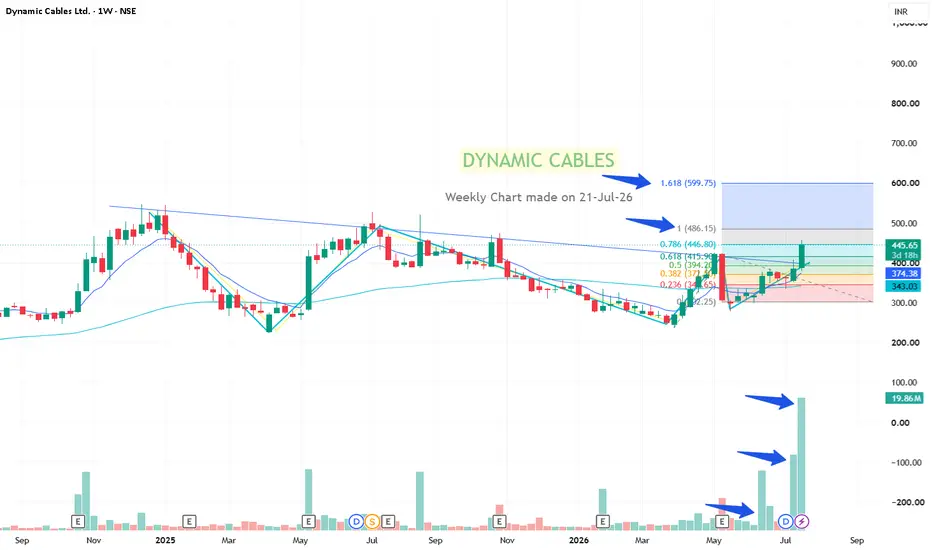
Volume based trade on Inverse H&S patternI can see Dynamic Cables on Weekly Time Frame has formed Inverse Head & Shoulder Pattern and also the weekly candle has broken the trend line with huge volume followed by continous volume gain in last 4 weeks. With CMP 445, my first target will be 485 and second target above 550-575. I will consider the Stop Loss of 420. Can see good momentum in coming days.
NSE:DYCLLong
by ampatill
BRITANIA OPTION CHAIN ANALYSIS (KEY OBSERVATIONS) 1. Strong CALL BUYING Visible Multiple strikes show: Call Buying Call Short Covering Especially around: 5400 – 5700 strikes 👉 Meaning: ➡️ Traders are expecting an upside move ➡️ Short sellers are exiting → bullish sign Logic: Call buying = bullish sentiment PUT SIDE = Mostly Writing / Long Covering You can see: Put Writing (strong) Put Long Covering 👉 Meaning: ➡️ Strong support forming below ➡️ Market participants don’t expect a big fall Important rule: High Put OI = Support zone Calls: OI increasing + price increasing ✔️ = Long Buildup (Bullish) Puts: OI increasing (writing) ✔️ = Support confirmation >>> Rule: Price ↑ + OI ↑ = Strong trend PCR around ~0.5 – 0.6 range 👉 Interpretation: Slightly bullish bias. Not overbought yet Short covering rally + fresh call buying Meaning: Fast upside possible, but can reverse if resistance breaks fail
NSE:BRITANNIA
by DattuAtp
Vishnu- Strong Uptrend Continuation with Key Resistance AheadVishnu Chemicals Limited is exhibiting a robust long-term bullish structure on the 4-hour timeframe. Key Observations: A significant uptrend is visible with multiple impulsive moves supported by rising volume during advances. The price is currently trading near the ₹640–643 zone, approaching a critical horizontal resistance at ₹659.25. Recent price action shows healthy consolidation with reduced selling pressure, indicating potential for continuation. Technical Levels: Immediate Resistance: ₹659.25 Major Support: ₹643.00 Stronger Support Zone: ₹600 – ₹620 (previous swing highs) Outlook: Bullish bias remains intact as long as price holds above ₹643. A decisive breakout above ₹659.25 with strong volume could open the path toward ₹680–700 in the medium term. Conversely, a sustained break below ₹643 may lead to a deeper correction toward the ₹600 region. Timeframe: 4H (NSE) Current Price: ₹640.10 (+0.84%) This setup offers a favorable risk-reward for swing traders monitoring the resistance breakout. Disclaimer: This analysis is for educational and informational purposes only. I am not a SEBI registered investment advisor. Please conduct your own research and consult a qualified financial advisor before making any investment decisions
NSE:VISHNULong
by Silent_Kitty
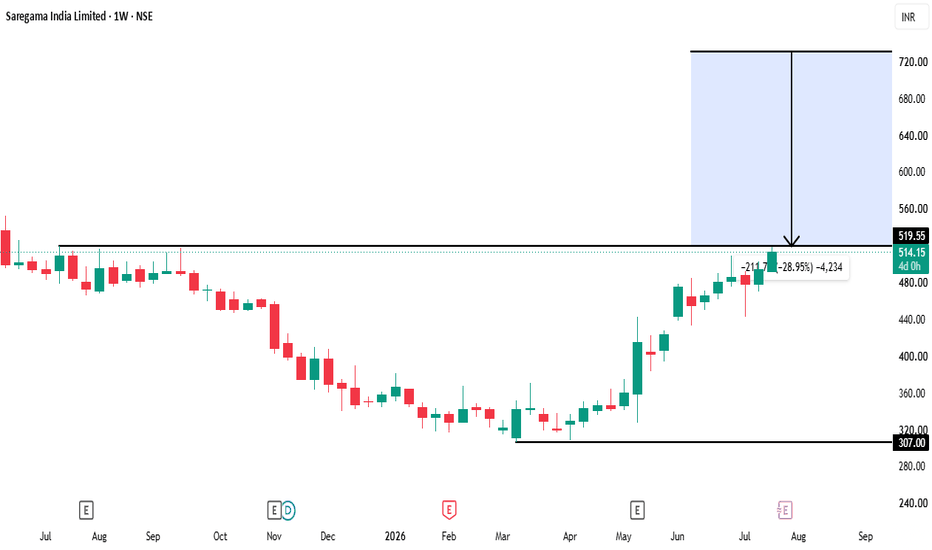
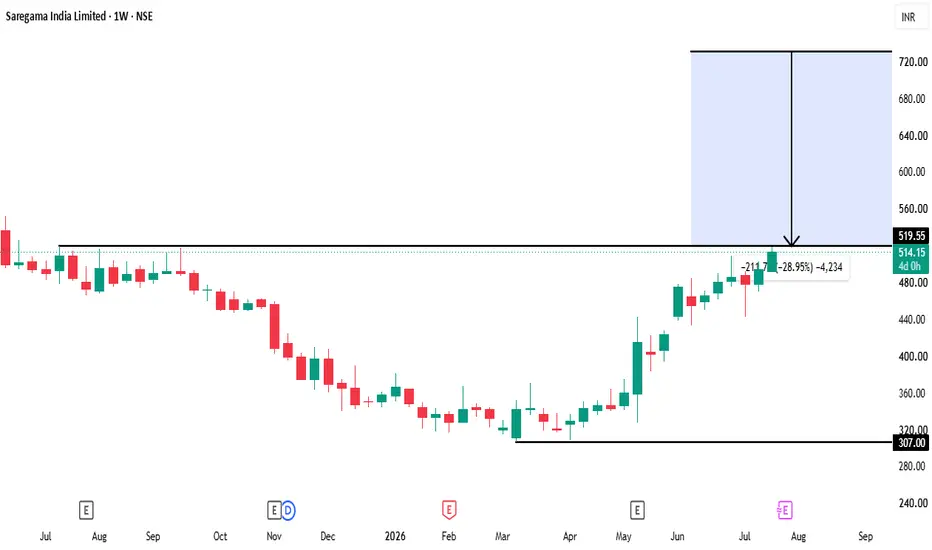
SAREGAMA SAREGAMA | Weekly Breakout Setup After a prolonged consolidation, Saregama has broken above an important resistance zone and is showing improving momentum on the weekly timeframe. Key observations: Strong structural breakout Higher highs and higher lows Trend continuation setup Potential upside toward ₹720 if the breakout sustains This analysis is based purely on price structure and technical analysis, not financial advice. 💬 Share your view in the comments.
NSE:SAREGAMALong
by RShivashankar
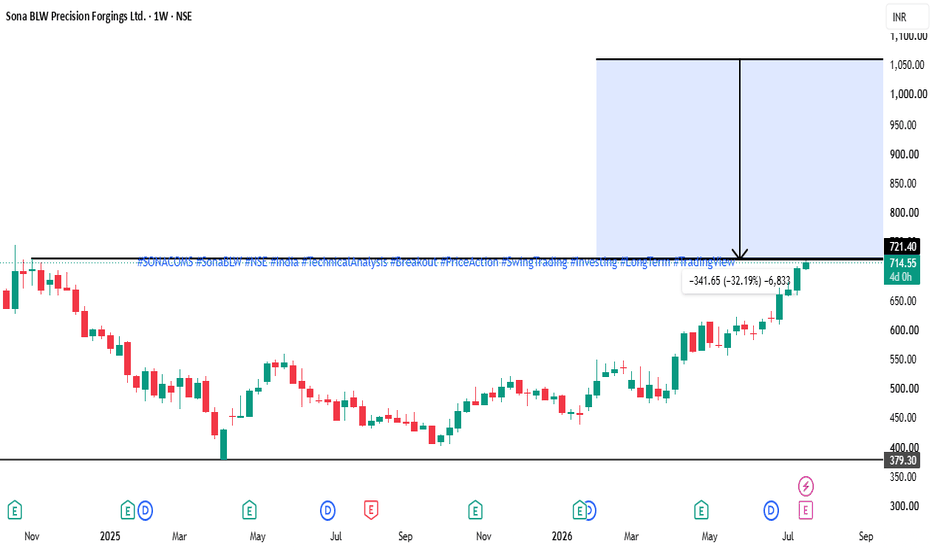
Sona BLW Precision ForgingsSona BLW Precision Forgings | Weekly Breakout Setup Near Multi-Month Resistance Sona BLW Precision Forgings (SONACOMS) is approaching a key resistance zone near ₹721, following a strong reversal from its long-term base. The overall structure remains bullish, with buyers consistently defending higher levels. Technical Observations Strong recovery from the ₹379 support zone. Clear higher highs and higher lows on the weekly timeframe. Price is approaching a significant resistance level. Momentum continues to improve with sustained buying interest. A confirmed breakout above ₹721 could trigger the next phase of the long-term uptrend. Key Levels Current Price: ₹714.55 Breakout Level: ₹721 Immediate Support: ₹680–690 Major Support: ₹379 Long-Term Target Zone: ₹1,050+ Trading Plan ✔ Watch for a strong weekly close above ₹721. ✔ A successful retest of the breakout zone may offer a favorable risk-reward opportunity. ✔ Failure to sustain above ₹721 could lead to short-term consolidation before the next directional move. Disclaimer: This analysis is shared for educational purposes only and should not be considered investment advice. Always conduct your own research and use proper risk management.
NSE:SONACOMSLong
by RShivashankar
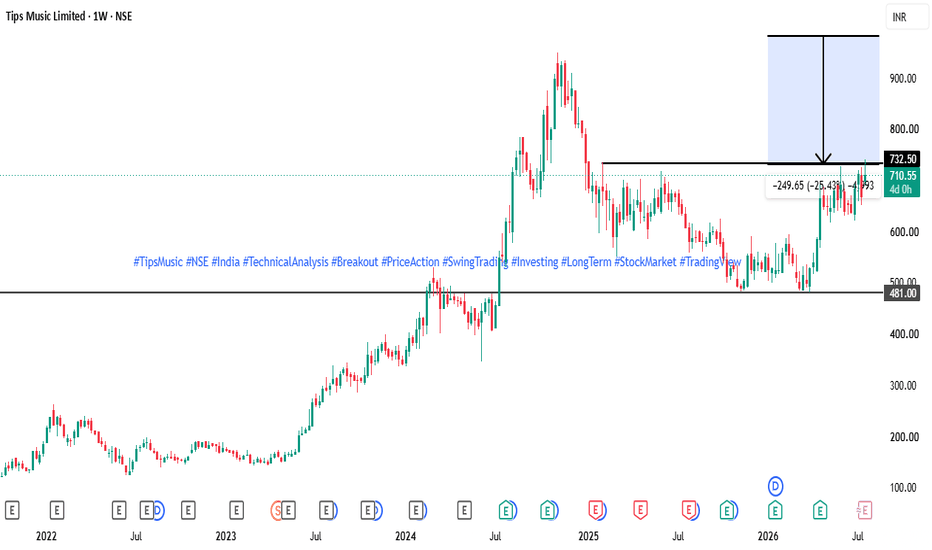
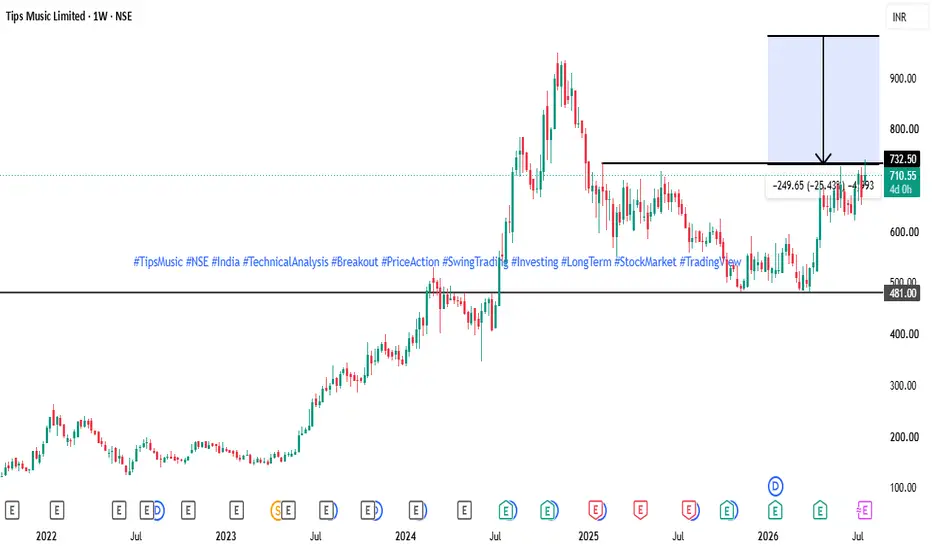
Tips Music LtdTips Music Ltd. | Weekly Chart Approaching a Major Breakout Tips Music is trading just below a significant resistance zone around ₹732, a level that has capped price advances in recent months. The recent recovery indicates improving momentum, and a breakout could trigger the next leg of the long-term uptrend. Technical Observations Strong recovery from the ₹481 base. Higher highs and higher lows indicate a bullish structure. Price is consolidating just below key resistance. Buying pressure continues to build. A breakout above ₹732 could confirm continuation of the uptrend. Key Levels Current Price: ₹710 Breakout Level: ₹732 Immediate Support: ₹680–690 Major Support: ₹481 Long-Term Target Zone: ₹980+ Trading Plan ✔ Watch for a decisive weekly close above ₹732 with sustained momentum. ✔ Pullbacks toward ₹680–690 may offer improved risk-reward if the bullish structure remains intact. ✔ A failure to hold above the breakout level after confirmation may indicate a false breakout. Disclaimer: This analysis is shared for educational purposes only and should not be considered investment advice. Always do your own research before investing.
NSE:TIPSMUSICLong
by RShivashankar
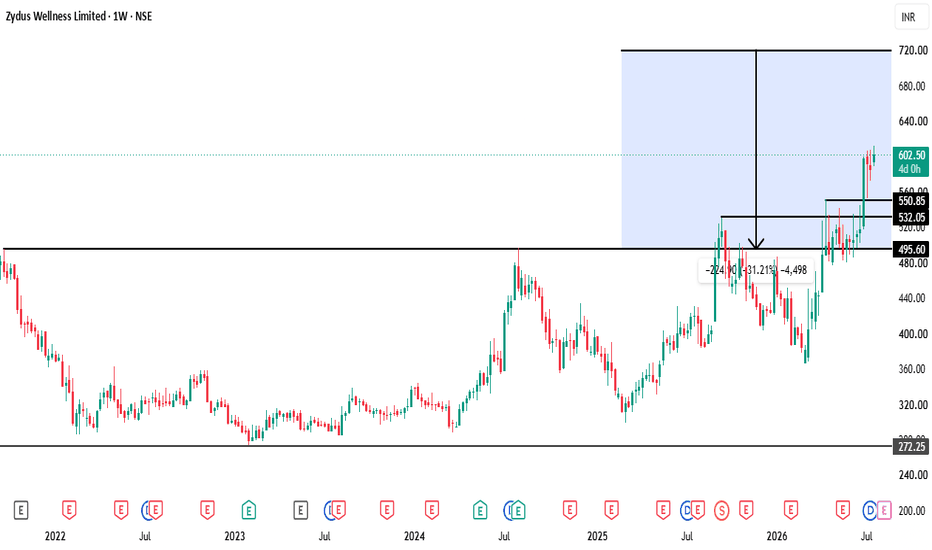
Zydus WellnessZydus Wellness | Weekly Breakout Signals Continuation of Long-Term Uptrend Zydus Wellness has successfully broken above a major multi-year resistance near ₹495, confirming a continuation of its bullish market structure. Technical Observations Strong breakout above long-term resistance. Higher highs and higher lows remain intact. Momentum has accelerated after clearing resistance. Price is trading comfortably above the breakout zone. Previous resistance is now expected to act as support. Key Levels Current Price: ₹602 Immediate Support: ₹550–560 Major Support: ₹495 Long-Term Resistance / Projection: ₹720+ Trading Plan ✔ Watch for sustained weekly closes above ₹550. ✔ Pullbacks toward ₹550–560 or ₹495 may provide better risk-reward entries if supported by price action. ✔ A decisive close below ₹495 would weaken the current bullish setup. Disclaimer: This analysis is shared for educational purposes only and is not financial advice. Always perform your own research before investing.
NSE:ZYDUSWELLLong
by RShivashankar
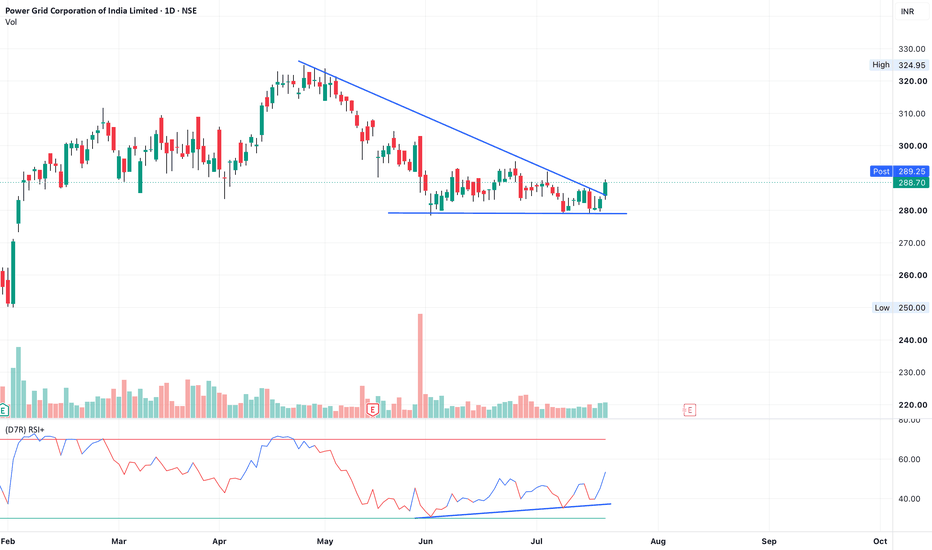
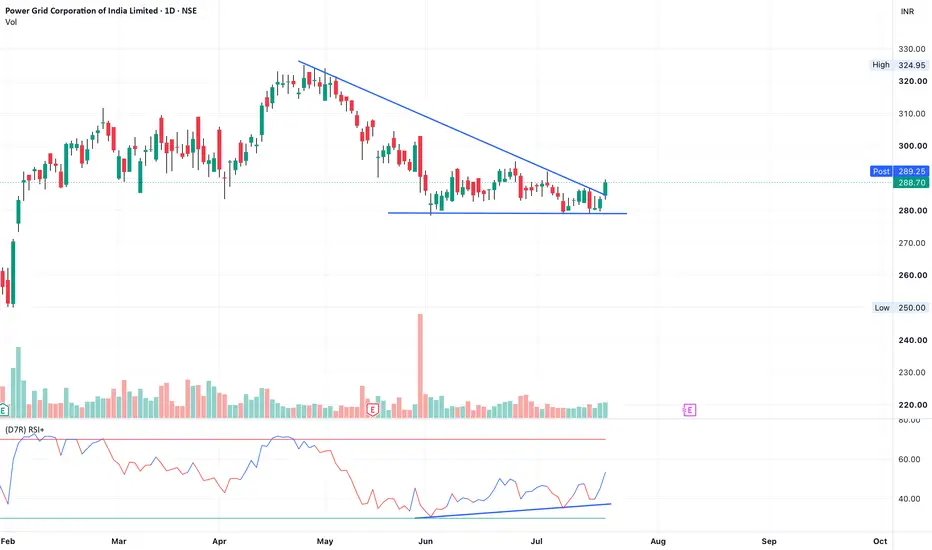
PowerGrid - RSI Bullish DivergencePowergrid has shown up move based on RSI bullish divergence. What this means is, the price was at the same level but the RSI was making higher lows. This is a long setup. Moreover, the price has broken descending triangle. Note: I am not a registered SEBI member. Hence, please do not consider this as an investment advice. This is just for educational purposes.
NSE:POWERGRIDLong
by kalyanganguly
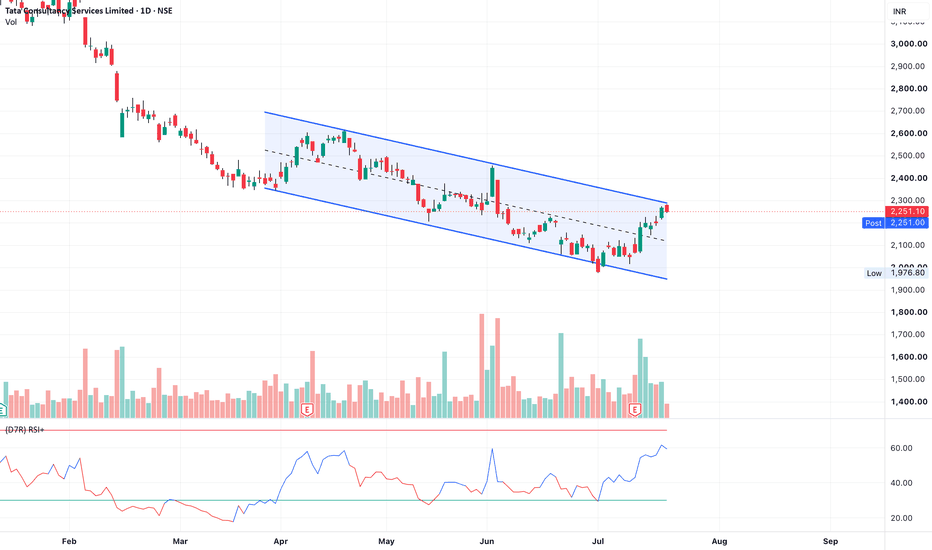
TCS testing resistance with low volumesBased on TCS earnings, there was an up-move with volumes. Currently, the price is near resistance. However, the rejection volume is not high. So keep a watch on this for further up move Note: I am not a registered SEBI member. Hence, please do not take this as an investment advice. This is just for education purposes only.
NSE:TCSLong
by kalyanganguly
112233445566778899101011111212131314141515161617171818191920202121222223232424252526262727282829293030313132323333343435353636373738383939404041414242
…999999

Made by humans

Select market data provided by ICE Data Services. Select reference data provided by FactSet. Copyright © 2026 FactSet Research Systems Inc.Copyright © 2026, American Bankers Association. CUSIP Database provided by FactSet Research Systems Inc. All rights reserved. SEC filings and other documents provided by Quartr.© 2026 TradingView, Inc.

More than a product
  • Supercharts
Screeners
  • Stocks
  • ETFs
  • Bonds
  • Crypto coins
  • CEX pairs
  • DEX pairs
  • Pine
Heatmaps
  • Stocks
  • ETFs
  • Crypto coins
Calendars
  • Economic
  • Earnings
  • Dividends
  • IPOs
More products
  • News Flow
  • Portfolios
  • Fundamental Graphs
  • Yield Curves
  • Options
  • Macro Maps
  • Pine Script®
Apps
  • Mobile
  • Desktop
Community
  • Social network
  • Wall of Love
  • Refer a friend
  • House Rules
  • Moderators
Ideas
  • Trading
  • Education
  • Editors' picks
Pine Script
  • Indicators & strategies
  • Wizards
  • Freelancers
  • Paid Spaces
Tools & subscriptions
  • Features
  • Pricing
  • Market data
  • Gift plans
Trading
  • Overview
  • Brokers
  • Brokers comparison
  • The Leap
Special offers
  • CME Group futures
  • Eurex futures
  • US stocks bundle
About company
  • Who we are
  • Space mission
  • Blog
  • Help Center
  • Careers
  • Media kit
Merch
  • TradingView store
  • Tarot cards for traders
  • The C63 TradeTime
Policies & security
  • Terms of Use
  • Disclaimer
  • Privacy Policy
  • Cookies Policy
  • Accessibility Statement
  • Security tips
  • Bug Bounty program
  • Status page
Business solutions
  • Widgets
  • Charting libraries
  • Lightweight Charts™
  • Advanced Charts
  • Trading Platform
Growth opportunities
  • Advertising
  • Brokerage integration
  • Partner program
  • Education program
Community
  • Social network
  • Wall of Love
  • Refer a friend
  • House Rules
  • Moderators
Ideas
  • Trading
  • Education
  • Editors' picks
Pine Script
  • Indicators & strategies
  • Wizards
  • Freelancers
  • Paid Spaces
Business solutions
  • Widgets
  • Charting libraries
  • Lightweight Charts™
  • Advanced Charts
  • Trading Platform
Growth opportunities
  • Advertising
  • Brokerage integration
  • Partner program
  • Education program
Look FirstLook First