#FLUOROCHEMGujarat Fluorochemicals Limited (FLUOROCHEM) Weekly Chart Analysis:
Upside Targets: Price is consolidating near ₹4,248.20 (+0.29%). A confirmed breakout opens the path toward mapped targets at ₹4,650.30 (T1), ₹4,750.60 (T2), and ₹4,912.90 (T3).
Support / Stop Loss: Immediate support sits near the ₹4,129.05–₹3,983.80 zone, with a strict stop loss recommended below the major swing low / support level at ₹3,749.70 to manage downside risk.
#BLUESTARCOBlue Star Limited (NSE: BLUESTARCO) Weekly Chart Analysis:
Upside Targets: Price is trading strong at ₹1,627.90 (+8.60%). A sustained continuation opens the path toward mapped targets at ₹1,663.30 (T1), ₹1,667.70 (T2), and ₹1,723.40 (T3).
Support / Stop Loss: Immediate support sits near the ₹1,553.50–₹1,514.70 zone, with a stop loss recommended below the major swing low / buy pivot around ₹1,453.60 to manage downside risk.
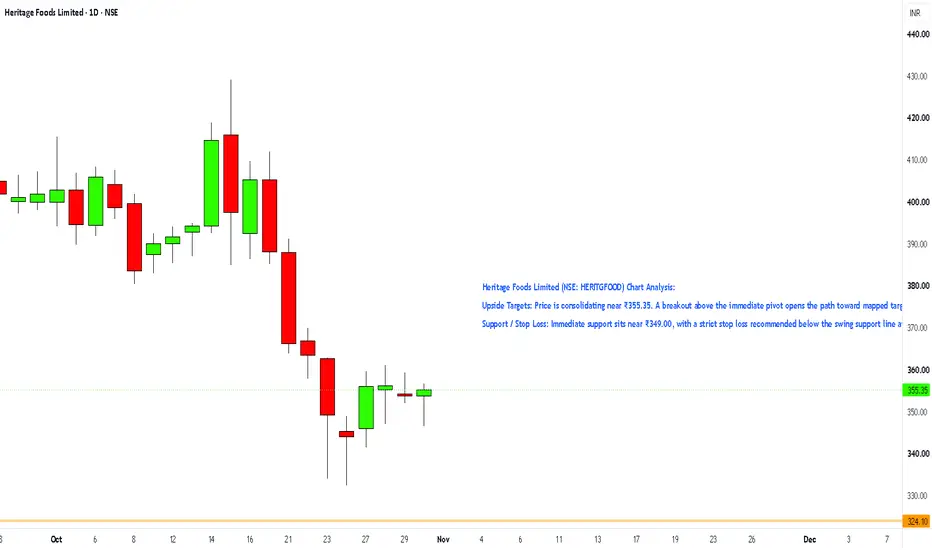
#HERITGFOODHeritage Foods Limited (NSE: HERITGFOOD) Chart Analysis:
Upside Targets: Price is consolidating near ₹355.35. A breakout above the immediate pivot opens the path toward mapped targets at ₹359.15 (T1), ₹365.45 (T2), and ₹375.60 (T3).
Support / Stop Loss: Immediate support sits near ₹349.00, with a strict stop loss recommended below the swing support line at ₹331.30 (or ₹324.10 for a wider buffer) to invalidate downside risk.
#INFYUpside Targets: Price is testing resistance at ₹1,185. A sustained breakout above ₹1,185 targets the next major resistance levels at ₹1,215 and ₹1,240.
Support / Stop Loss: Immediate support sits at the breakout pivot around ₹1,149, with a strict stop loss recommended below the recent swing low near ₹1,126 to limit downside risk.
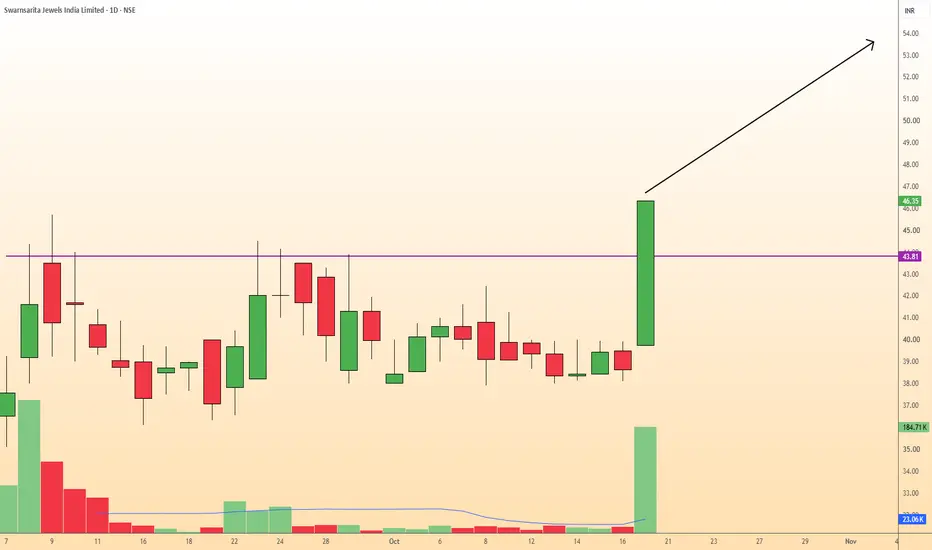
SWARNSAR Strong Resistance Breakout with Massive VolumeThe daily chart of Swarnsarita Jewels India Limited indicates a decisive bullish breakout above a major resistance zone.
For several weeks, the price consolidated and faced consistent rejection near the 43.80 - 44.00 mark, which is marked by the purple horizontal line.
In the most recent session, the stock shattered this resistance with a massive, full-bodied bullish candle, closing at 46.35 (+19.98%).
The most compelling aspect of this setup is the volume confirmation. The breakout occurred
BANKINDIA Consolidation BreakdownOn the daily timeframe, Bank of India has been trading within a prolonged consolidation box, roughly bounded between the 136 support and 152 resistance zones, since March.
Within the latter half of this zone, a descending trendline indicates lower highs, reflecting building selling pressure before the drop.
The recent price action demonstrates a decisive breakdown below the lower support boundary.
This breakdown candle closed strongly near 129.99 and was accompanied by a noticeable spike in v
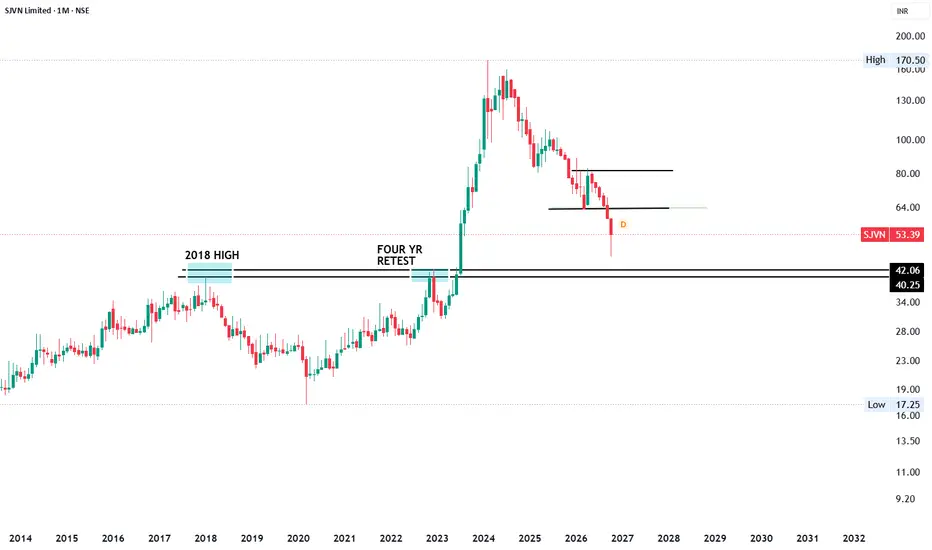
UJJIVANSFB Multi-Year Breakout and Retest OpportunityLooking at the montHLY chart for Ujjivan Small Finance Bank, we can observe a classic and powerful multi-year market structure.
The horizontal black line at 61.90 has acted as a critical level of historical resistance, dating back to the major market drop in early 2020.
After years of accumulation and a steady uptrend since 2022, the price successfully broke out above this 61.90 macro-resistance in early 2026 with strong bullish momentum, establishing a new swing high.
Currently, the stock is
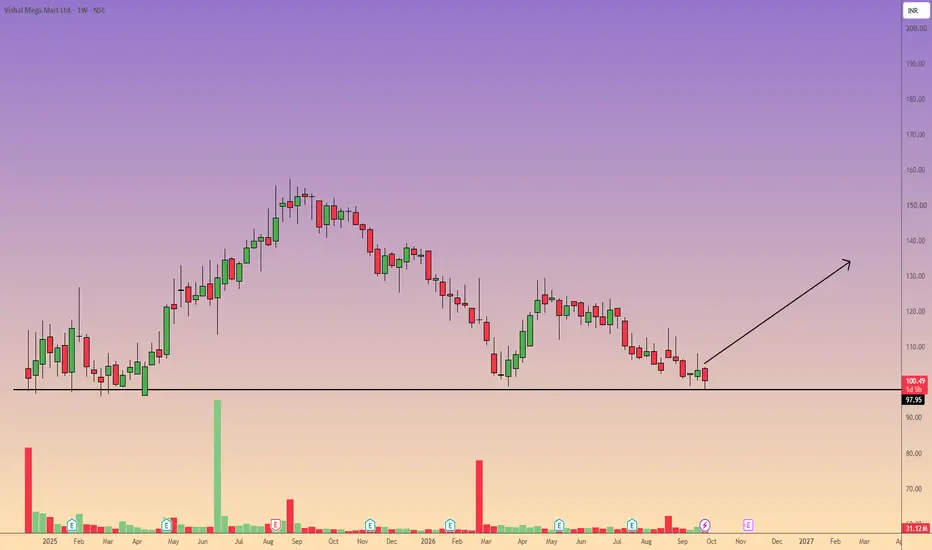
VMM Testing Critical Weekly SupportHello traders,
Looking at the weekly chart for Vishal Mega Mart Ltd. (NSE), we can observe a prolonged corrective phase after the stock peaked near the ₹150–155 range late last year.
The price has been printing lower highs and lower lows for several months, reflecting strong bearish momentum.
However, the stock is currently hovering at ₹100.60 and is testing a major historical support level at ₹97.95 (indicated by the solid black horizontal line).
This is a critical "make-or-break" zone. Histo
QPOWER Ascending Triangle Breakout & Successful Retest on DailyOverview & Technical Logic
Analyzing the daily chart for Quality Power Electrical Equipments Ltd., we can observe a classic bullish continuation setup.
Over the past few months, the stock has been respecting an ascending trendline, steadily forming higher lows since May.
This accumulation phase culminated in a strong breakout above the major horizontal resistance level at 1,409.8.
Following the breakout, the price action demonstrated a textbook retest.
The previous resistance at 1,409.8 acte
DYNAMATECH Strong Ascending Triangle Breakout with VolumeDynamatic Technologies Limited is showing a textbook ascending triangle breakout on the daily timeframe.
Over the past several months, the price has been respecting a rising trendline, making consistently higher lows.
This price action indicates strong accumulation and sustained buying pressure at lower levels.
Simultaneously, the price faced a stiff horizontal resistance zone around the 12,608 level.
In the most recent trading sessions, the stock has decisively broken out above this key res
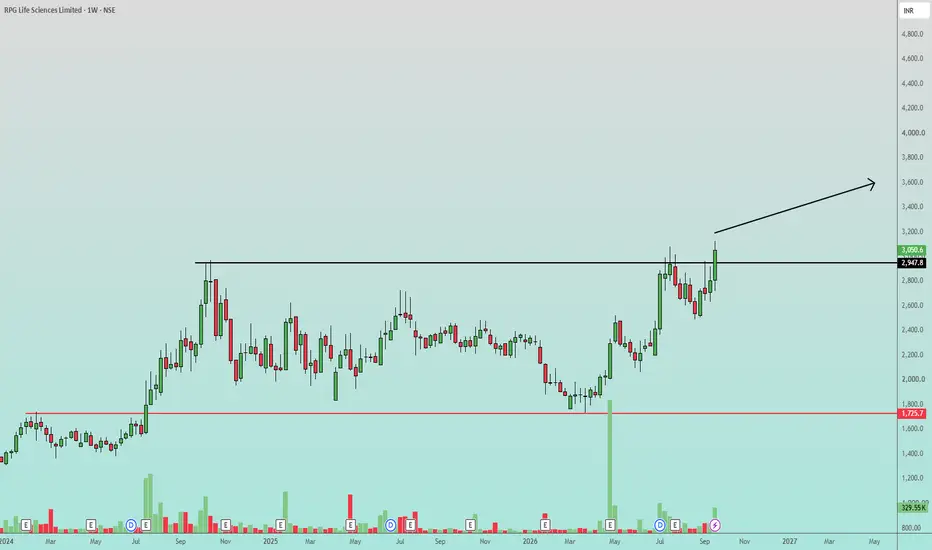
RPGLIFE Strong Weekly Breakout Above Multi-Month ResistanceTechnical Analysis & Context:
RPG Life Sciences Limited is demonstrating strong bullish momentum on the weekly timeframe. After an extended period of consolidation, the stock has successfully broken out above a critical, multi-month resistance zone near the 2947.8 level.
Looking at the broader structure, the stock built a massive base with historical support holding firm around the 1725.7 mark (indicated by the red line).
Following this accumulation phase, it tested the ~2950 resistance multip
SOUTHBANK Strong Breakout from Consolidation Accompanied by VolBased on the technical structure in South Indian Bank is exhibiting a classic bullish continuation setup on the weekly timeframe.
Chart Analysis: The stock has been trading within a well-defined rectangular consolidation box (roughly between the 43.50 support and 49.00 resistance levels) since early June.
The most recent weekly candle shows a decisive breakout above the upper boundary of this range, closing strongly at 49.95.
Notably, this breakout is validated by a significant surge in buyin
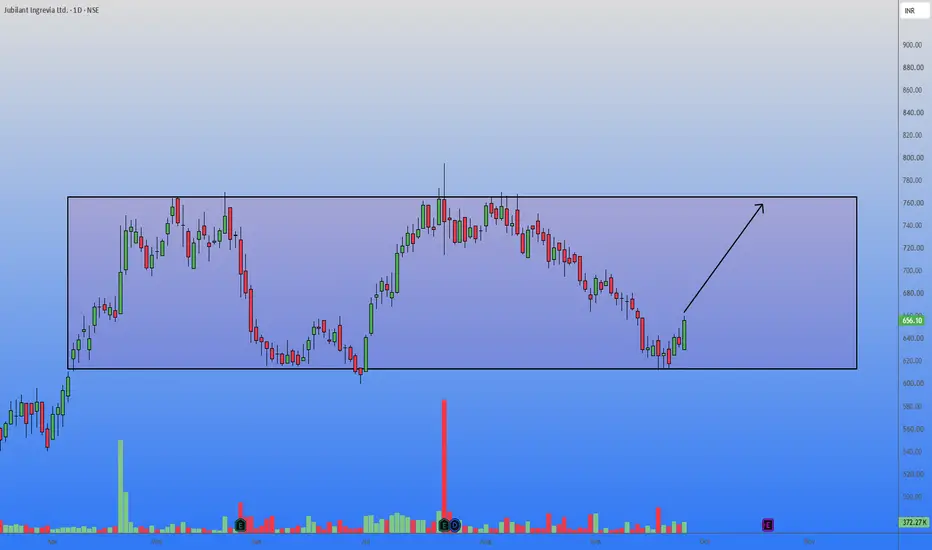
JUBLINGREA Bullish Bounce from Daily Consolidation SupportLooking at the daily chart for Jubilant Ingrevia Ltd., the stock has been trading within a well-defined rectangular consolidation phase for several months.
Price action is cleanly oscillating between a strong support floor and a key resistance ceiling, presenting a classic range-bound technical setup.
Technical Observation:
The stock recently retested the lower boundary of this consolidation box (major support) and has shown a strong bullish bounce from these levels.
The recent daily candle a
TIMEX : High-Volume Breakout Above Key Resistance.As shown in the daily chart referenced Timex Group India Limited has staged a powerful bullish breakout.
The asset surged past its immediate upper resistance zone, marked by the red horizontal line at 684.80, closing the session significantly higher at 714.20 (+16.87%).
This upward expansion was preceded by a period of consolidation where the price established a firm structural support base near the black horizontal line at 588.60.
The breakout is validated by a massive volume spike of 6.65
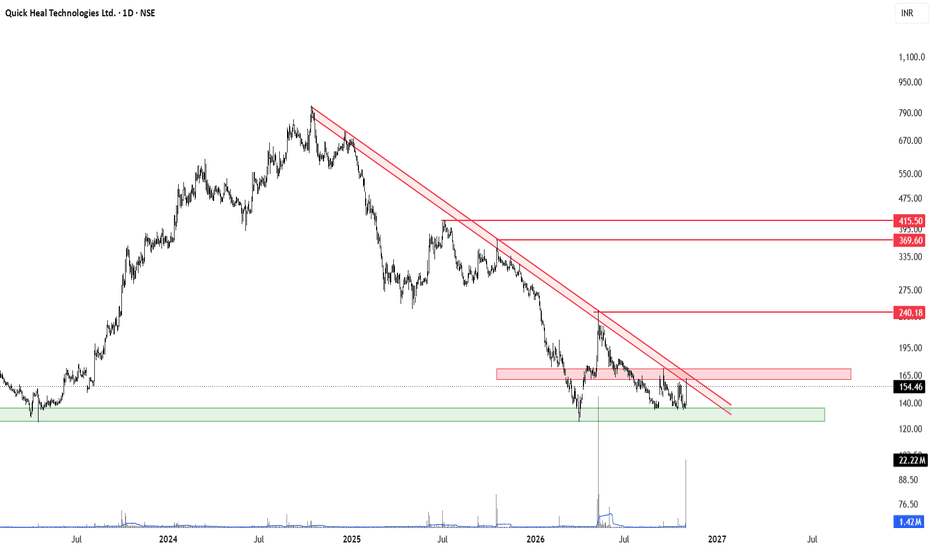
QUICK HEAL – Strong Buying Emerges at Multi-Year Support! 📈 QUICK HEAL – Strong Buying Emerges at Multi-Year Support! Is a Trend Reversal Underway?
Quick Heal has delivered a strong bullish candle, gaining +12.92% to close at ₹154.46, accompanied by a significant volume spike of 22.22M shares.
After an extended decline within a multi-month descending channel, the stock has shown a strong recovery from its demand zone around ₹125–135.
The latest candle has pushed above the descending trendline, suggesting a potential change in the short-term trend. H
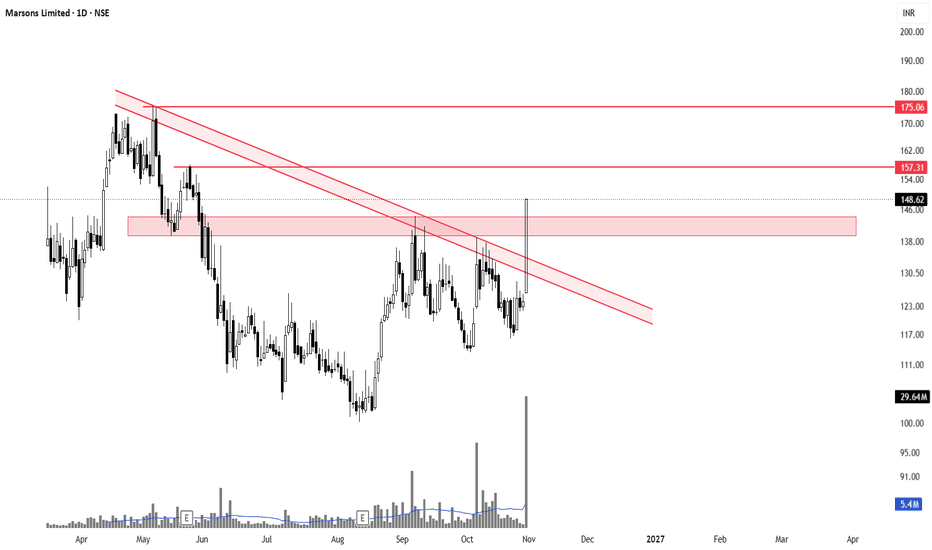
MARSONS – Strong Breakout from a Multi-Month Descending Channel!Marsons has delivered a strong bullish candle, gaining nearly 19.81% and closing at ₹148.62 with significant volume of 29.64M shares.
The stock has broken above its multi-month descending channel and reclaimed the ₹139–145 resistance zone. The breakout is accompanied by a substantial volume spike, adding credibility to the move.
Key Levels:
• ₹139–145: Breakout zone and immediate support.
• ₹157.31: First upside target.
• ₹175.06: Second upside target and major resistance.
Trade Setup:
•
Bluestar - Long SetupCMP 1485 on 27.08.26
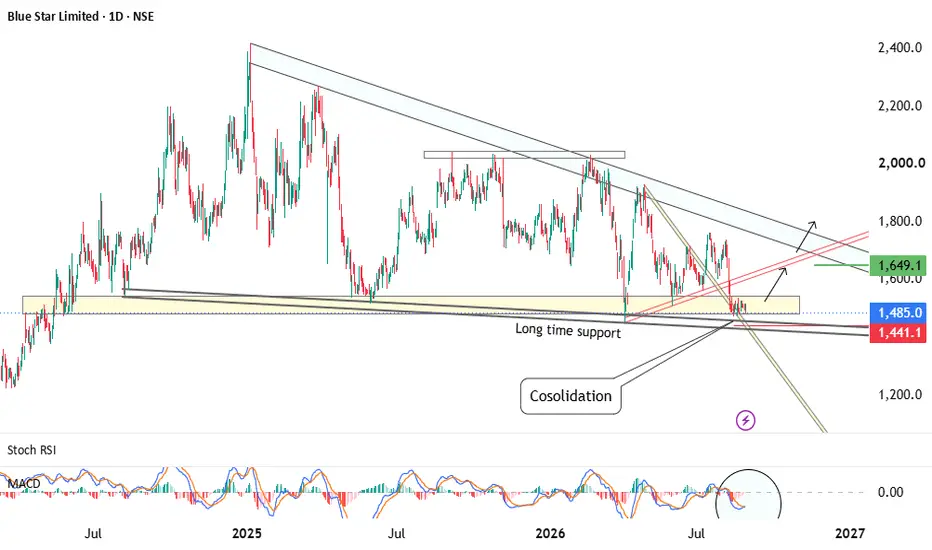
Since June 2024, the stock price has been taking support 5th time at the same level around 1480. The price is showing a consolidation for the two weeks.
MACD shows a possible crossover too.
If the pattern continues, it may go into a bullish phase . Possible target is 1650 or more.
The setup fails if the price sustains below 1440.
All these illustrations are only for learning and educational purposes. It is not a trading recommendation.
All the best.
HDFC AMC - Cup & HandleHDFC AMC has tested its previous support zone around ₹2,210–₹2,235, witnessed buying interest, and subsequently developed a potential Cup & Handle formation.
Key Technical Observations:
1. Previous support retest indicates demand at lower levels.
2. A rounded recovery has formed the cup structure.
3. Price is developing a handle near the neckline resistance of ₹2,340.
Confirmation Trigger: A decisive breakout above ₹2,340, supported by strong volume, would confirm the pattern.
Until breakou
BUY TODAY SELL TOMORROW for 5%DON’T HAVE TIME TO MANAGE YOUR TRADES?
- Take BTST trades at 3:25 pm every day
- Try to exit by taking 4-7% profit of each trade
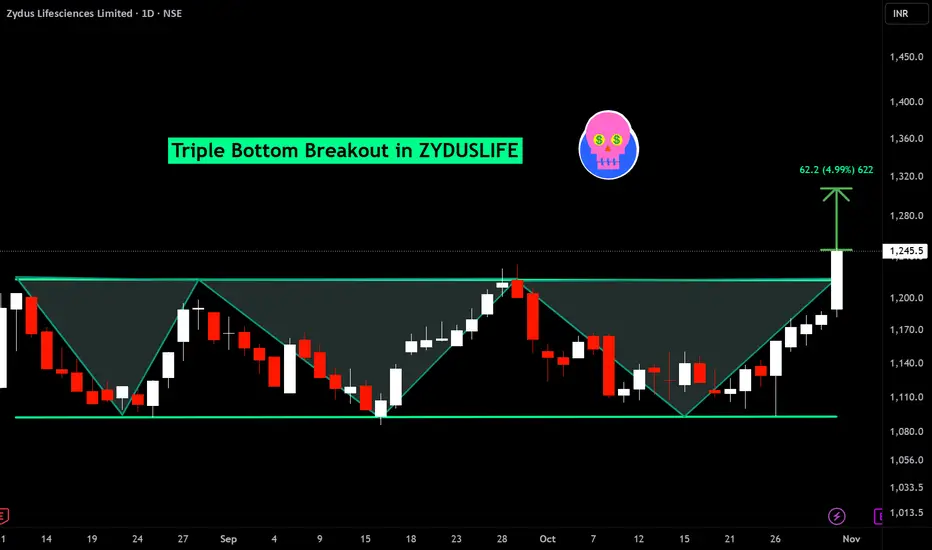
- SL can also be maintained as closing below the low of the breakout candle
Now, why do I prefer BTST over swing trades? The primary reason is that I have observed that 90% of the stocks give most of the movement in just 1-2 days and the rest of the time they either consolidate or fall
Triple bottom breakout in ZYDUSLIFE
BUY TODAY SELL TOMORROW for 5%
BUY TODAY SELL TOMORROW for 5%DON’T HAVE TIME TO MANAGE YOUR TRADES?
- Take BTST trades at 3:25 pm every day
- Try to exit by taking 4-7% profit of each trade
- SL can also be maintained as closing below the low of the breakout candle
Now, why do I prefer BTST over swing trades? The primary reason is that I have observed that 90% of the stocks give most of the movement in just 1-2 days and the rest of the time they either consolidate or fall
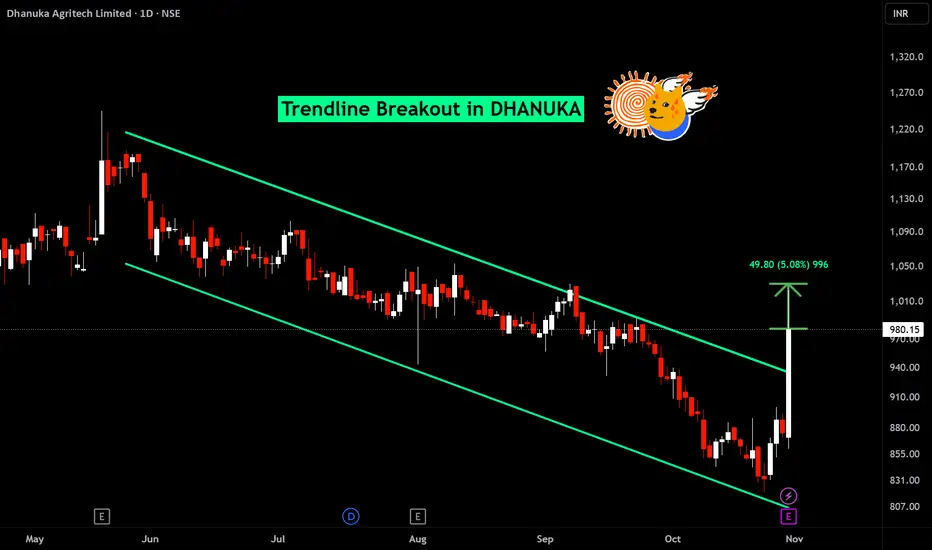
Trendline breakout in DHANUKA
BUY TODAY SELL TOMORROW for 5%
Sakuma Exports (W): MACRO BOUNCE & MASSIVE SURGETimeframe: Weekly | Chart Scale: Logarithmic
Explosive +36.88% weekly surge backed by a huge 39.17M volume spike! 🔥
Technical Highlights:
✅ Reversal: Bounced off a massive 2008 macro support & pierced last week's bearish candle!
✅ Breakout: Cleared horizontal resistance (Aug '26).
⚠️ Major Test: Battling a stubborn angular resistance (Apr '25) but couldn't secure the close.
✅ Momentum: Daily EMAs in PCO (Weekly soon). MACD & RSI rising. 🚀
Key Levels to Watch:
🎯 Target: 3
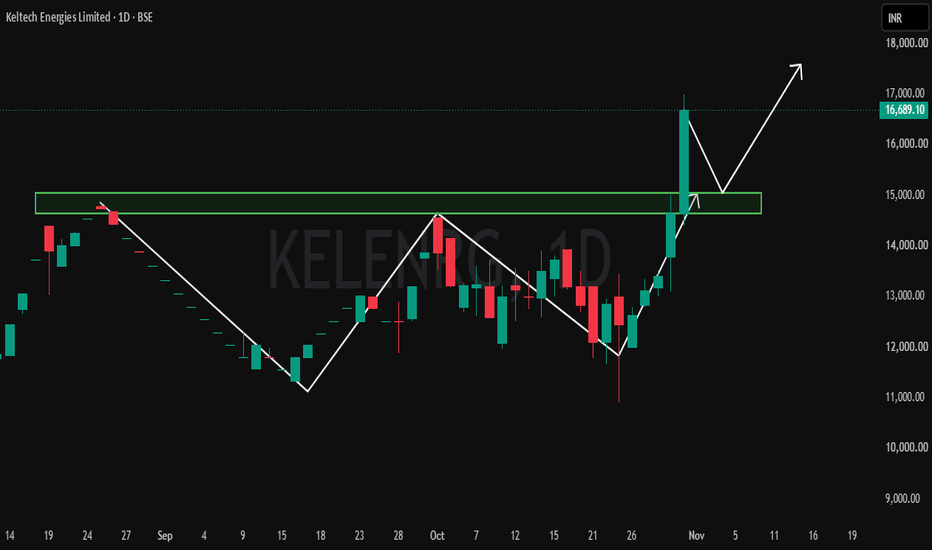
KELENRG — SWING BREAKOUT SETUPKELENRG — SWING BREAKOUT SETUP
Entry, Stop Loss & Targets Are Clearly Defined — Helping You Plan Your Trade With Confidence.
A bullish breakout has appeared on the 1D timeframe with strong price action above the previous resistance zone.
🔄 Trade Type: Swing Trade
────────────────────
🎯 TRADE LEVELS
ENTRY: ₹16,689
🛑 STOP LOSS
Support: ₹14,800
🎯 TARGETS
T1 18,900
T2 20,500
────────────────────
⏱ Timeframe: 1 Day
The position can be held for a swing move if the trend remains strong.
The s