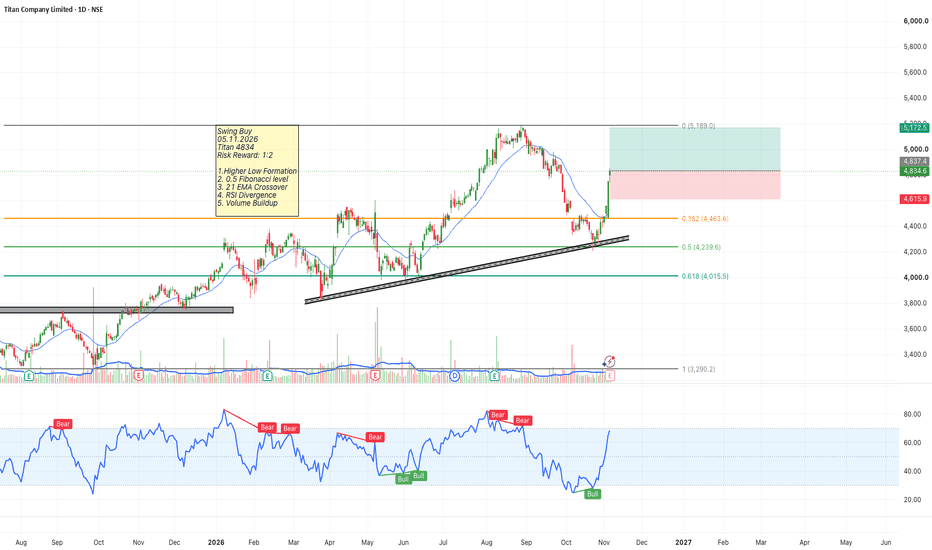
RISHK 10000Strategy Execution : Trade calls are provided based on trendline setups.
Quantity : Determined by F&O lot sizes.
Stop-Loss : Strictly follow the specified stop-loss levels. A stop-loss is considered triggered only after a 15-minute candle closes beyond the level.
Position Sizing : Limit exposure to a maximum of two open positions at a time.
Important Note : Do not risk more than 2% of your capital per trade.
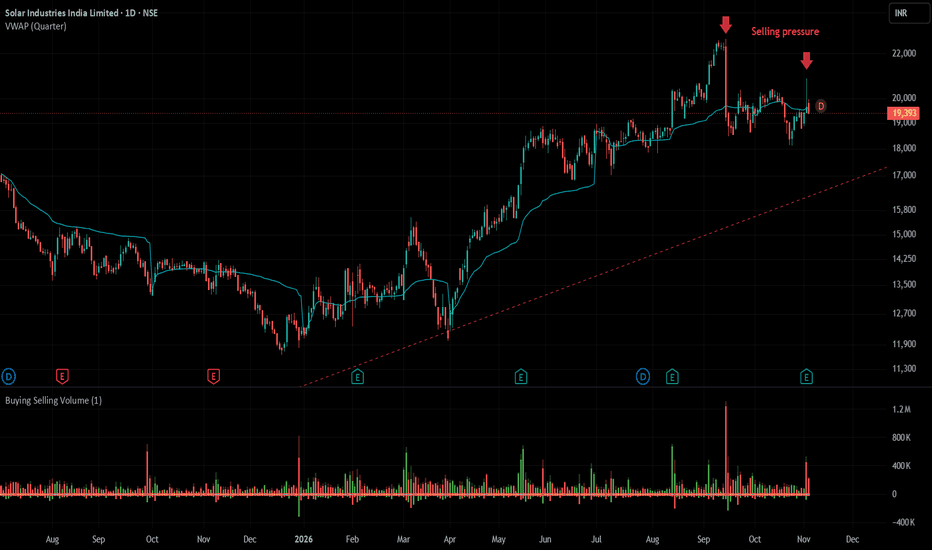
Solar Industries Bearish ViewStock showing selling pressure from upper levels with huge volume.
RSI divergence can be seen on Monthly chart.
Keeping 3rd Nov candle high as SL, a short position can be initiated.
Short term target on Daily chart appears to be near trendline which is 16500 level
If bearish formation continues, then by the formation of the structure, more lower level can be seen in the future. ( But it target depends on how the structure unfolds).
TATAPOWER (1D) – Channel breakout (up side): broke outA channel breakout on TATAPOWER's daily closes, picked out by a pattern finder. It is a shape on the chart, not a measured edge.
The picture so far
The shape: Two parallel sloping lines. The close breaks out against the slope: a falling channel breaks up, a rising one breaks down.
It runs from 27 May 2026 to 8 Oct 2026; the finder saw it on 14 Oct 2026.
A daily close above the breakout line on 4 Nov 2026.
The newest closed candle (4 Nov 2026) is above the breakout line.
What to keep
OFSS 1W: Inside a Major Weekly Zone That Turned Price 5 TimesOFSS on the weekly chart, at a major weekly zone: the band where weekly candles turned price 5 times over the last four years. Found by an automated scan of weekly turns; nothing has measured how often such zones hold.
On the chart
The weekly candles turned price at this zone 5 times: wk 5 Aug 24, wk 16 Jun 25, wk 8 Sep 25, wk 6 Oct 25, wk 20 Jul 26.
It changed roles: it was support first, then turned price from the other side.
Latest test: the wk 26 Oct 26 candle reached into the zone.
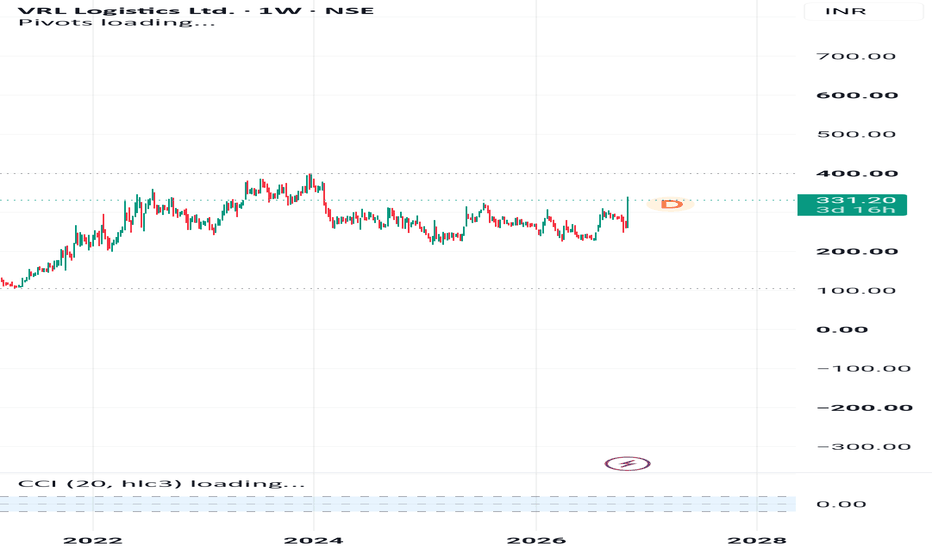
VRL Logistics 🔥 ₹327 BREAKOUT – ₹647 ON THE RADAR?
🚛 VRL LOGISTICS | WEEKLY R4 BREAKOUT SETUP
NSE: VRLLOG
🟢 Buy Zone: ₹327
🚀 Breakout Zone: ₹327
🔴 Stop Loss: ₹248
🎯 Target 1: ₹472
🎯 Target 2: ₹647
RISK DEFINED. REWARD VISIBLE.
Educational purposes only. Not investment advice. Do your own research.
© 20K MICROCAP INVESTING | R4 MOMENTUM DESK
#VRLLOG #LogisticsStocks #StockToWatch #BreakoutStocks #SwingTrading #IndianStocks #MomentumStocks #R4Momentum #20KMicrocapInvesting
DIXON (1D) – EMA 20, SMA 200, SMA 20DIXON on the daily chart, against its moving averages.
What the chart shows
EMA 20 (candle on it) close 0.39 ATR above; SMA 200 (candle on it) close 0.42 ATR above; SMA 20 (candle on it) close 0.45 ATR above.
The lines drawn: EMA 20, SMA 200, SMA 20 - each worked out on every closed daily candle.
What to keep track of
Where the next closes finish against these averages.
Whether the averages keep their slope.
Volume on the candle that moves away from them.
For study only. Not
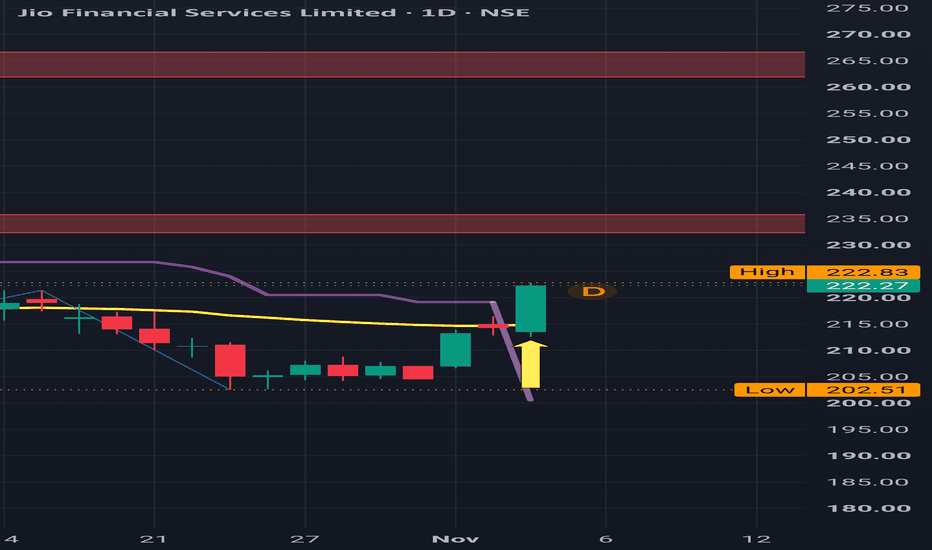
JIO FINANCIAL SERVICES (NSE: JIOFIN)Technical Confluence & Pattern Exhaustion
Textbook Downside Symmetry Completed:
Pattern 1 (2024): Head & Shoulders top near ₹394 broke the ₹310 neckline, cleanly hitting the projected linear target near ~₹226 (sweeping liquidity at the opening candle wick near ₹198).
Pattern 2 (2025–2026): Replica Head & Shoulders top near ₹340 broke the ₹290 neckline, hitting the linear target near ~₹240 with exact mathematical precision.
Full Liquidity Absorption & Double Bottom Base:
Downside targets from
LTM — major support test, reversal not confirm- CMP: ₹4,070
- Trend: Weak; lower highs and lower lows
- Long-term trendlines: Both blue descending trendlines remain overhead resistance.
- Short-term trendline: The recent rebound from around ₹3,750 has failed to sustain, and the shorter black falling trendline remains a hurdle.
- RSI: ~42.3, below 50 — momentum remains weak.
Key technical levels
Level Significance
₹3,750–3,800 Critical horizontal support
₹3,525 Recent swing low; breakdown warning
₹4,250–4,400 First recovery
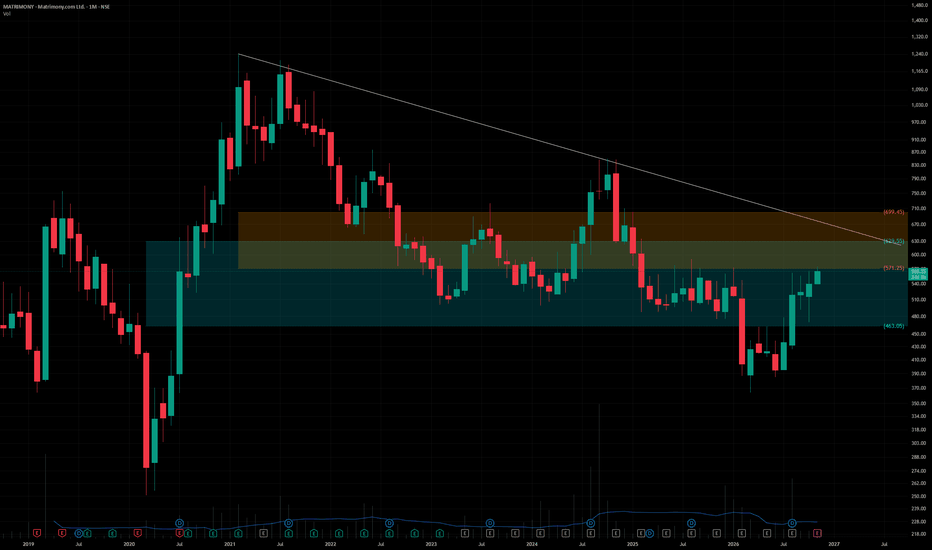
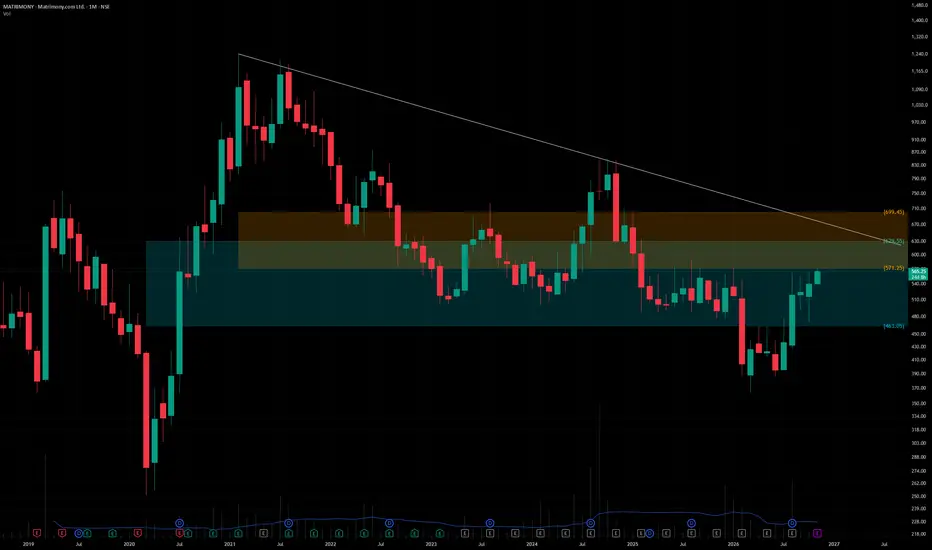
MATRIMONYMatrimony.com Ltd. (CMP ₹566.00, NSE: MATRIMONY)
The SmartWay Research Desk | 6 November 2026
A Chennai‑based consumer internet company, incorporated in 2001. Matrimony.com Ltd. is India's leading online matchmaking platform, operating well‑known brands including BharatMatrimony, CommunityMatrimony, EliteMatrimony, and Jodii. The company also has interests in wedding-related services and relationship platforms, serving millions of users across India and overseas markets.
Promoter Holding
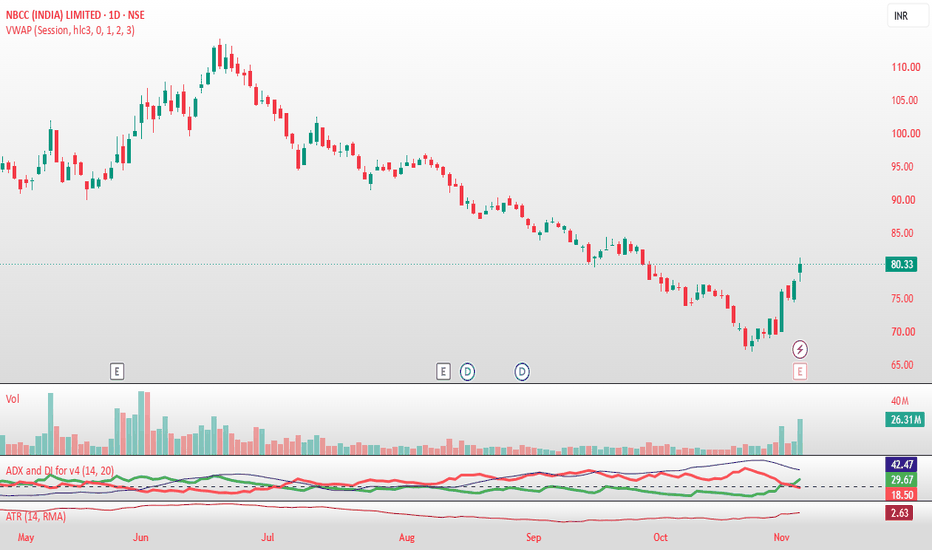
Review and plan for 6th November 2026Nifty future and banknifty future analysis and intraday plan.
Results- Nbcc, Motherson.
This video is for information/education purpose only. you are 100% responsible for any actions you take by reading/viewing this post.
please consult your financial advisor before taking any action.
----Vinaykumar hiremath, CMT
KEI 1D: Major Weekly Support Zone, Turned Price 11 TimesKEI on the daily chart, at a major weekly support zone: the band where weekly candles turned price 11 times over the last four years. Found by an automated scan of weekly turns; nothing has measured how often such zones hold.
Reading the chart
The weekly candles turned price at this zone 11 times: wk 6 May 24, wk 22 Jul 24, wk 28 Oct 24, wk 18 Nov 24, wk 23 Jun 25, wk 11 Aug 25, wk 29 Sep 25, wk 3 Nov 25, wk 8 Dec 25, wk 19 Jan 26, wk 23 Mar 26.
It changed roles: it was support first, the
LTM (1D) – Symmetrical triangle (up side): broke outLTM on the daily chart, found on the line through the closes by a chart patterns finder. Drawn from closes alone; how often this shape works has not been measured.
What the chart shows
The shape: Falling highs and rising lows that meet ahead, with no pole before them. The close leaves on either side.
Drawn from 30 Jun 2026 to 27 Oct 2026, and known from 5 Nov 2026.
A daily close above the breakout line on 5 Nov 2026.
The newest closed candle (5 Nov 2026) is above the breakout line.
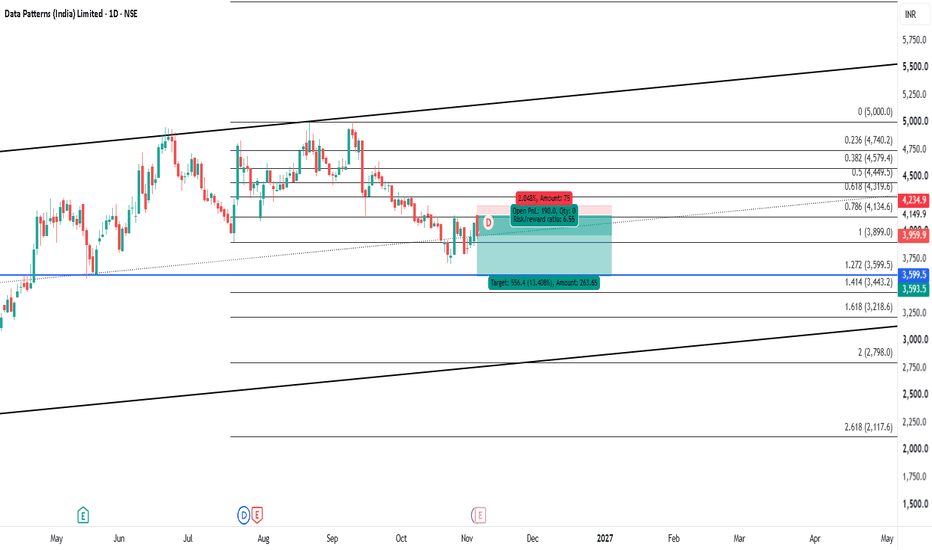
rishk 7000Strategy Execution : Trade calls are provided based on trendline setups.
Quantity : Determined by F&O lot sizes.
Stop-Loss : Strictly follow the specified stop-loss levels. A stop-loss is considered triggered only after a 15-minute candle closes beyond the level.
Position Sizing : Limit exposure to a maximum of two open positions at a time.
Important Note : Do not risk more than 2% of your capital per trade.
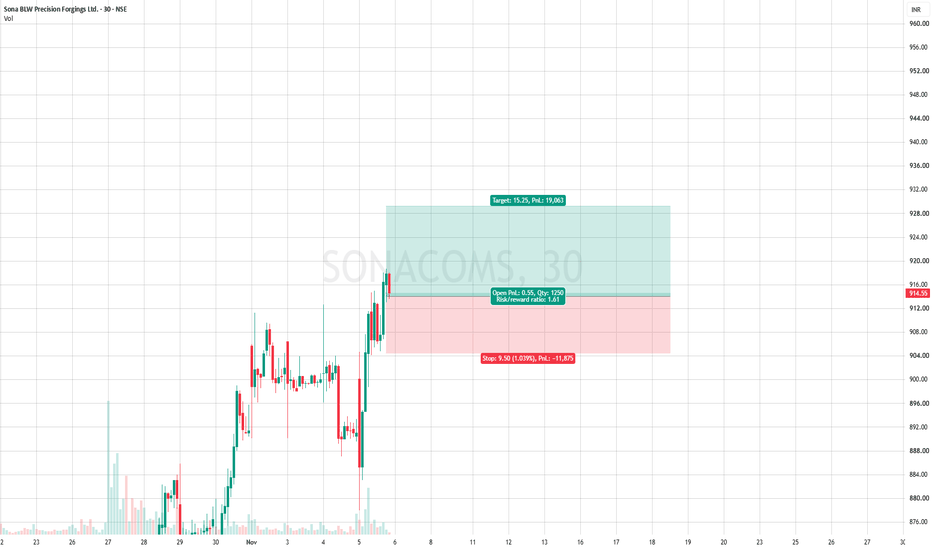
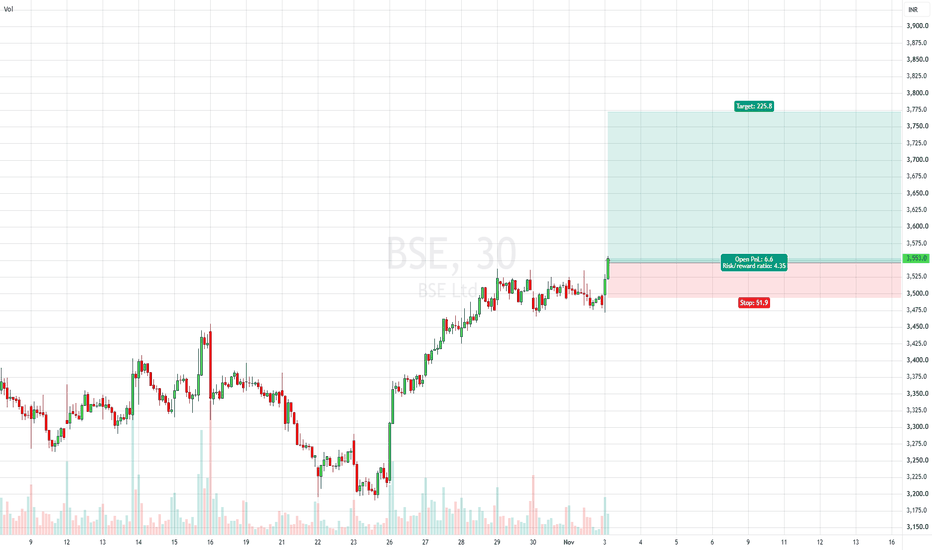
SL @ 11875 TP @ 19063Strategy Execution : Trade calls are provided based on trendline setups.
Quantity : Determined by F&O lot sizes.
Stop-Loss : Strictly follow the specified stop-loss levels. A stop-loss is considered triggered only after a 15-minute candle closes beyond the level.
Position Sizing : Limit exposure to a maximum of two open positions at a time.
Important Note : Do not risk more than 2% of your capital per trade.
INDIGO | THE BTF DAILY BLOCK IS STILL DEVELOPING 🧭
#Crude #oil has suffered a sharp selloff, and airline stocks are attracting renewed attention as the market reassesses the outlook for fuel costs.
But the more interesting story may be unfolding on the chart.
**IndiGo's BTF Daily Trend has transitioned from bearish to bullish**, with successive green daily blocks illustrating the recovery.
Despite the recent sharp advance, price remains within the developing bullish Daily BTF block, while the 18-day SMA near ₹4,790 provides a broader dire
COFORGE: Why ₹2,000 Is Supply Absorption, Not a Structural TopRetail investors often panic when a stock retests a major round-number resistance like ₹2,000 multiple times, calling it a dangerous "Triple Top" or "Quadruple Top." But institutional money knows the reality: the more times a level is tested without a major breakdown, the weaker that ceiling becomes!
Coforge isn't suffering from distribution—big smart money is systematically absorbing every single share being dumped under ₹2,020 to build massive long positions before the next explosive trend.
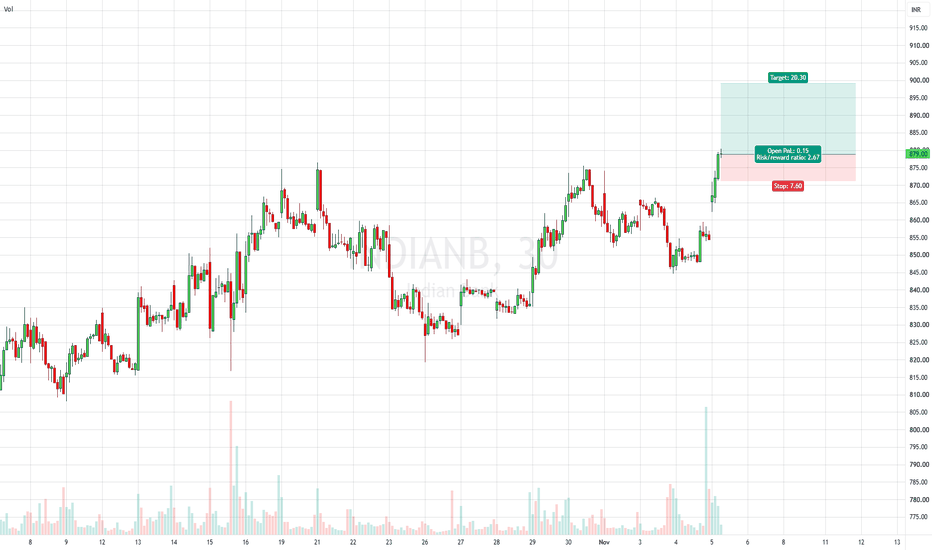
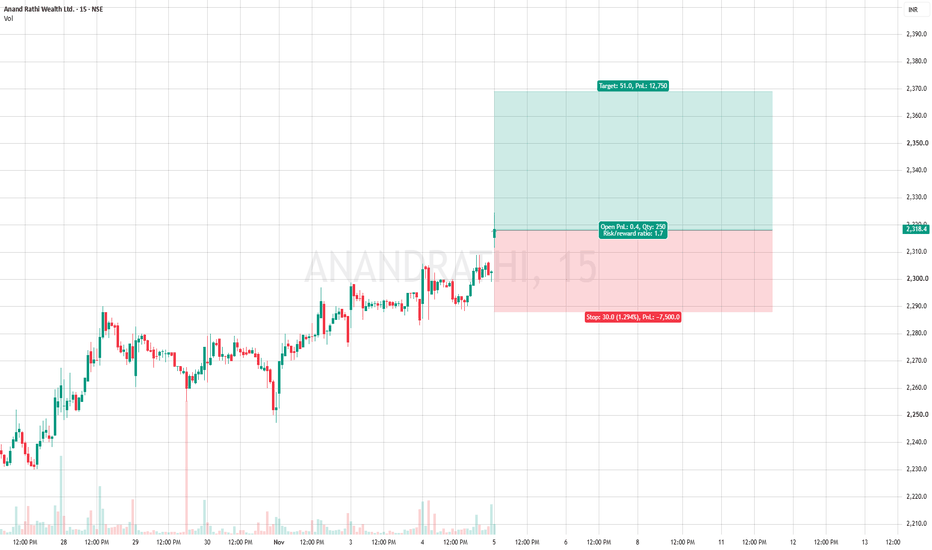
Stoploss @ 7500 Target @ 12750Strategy Execution : Trade calls are provided based on trendline setups.
Quantity : Determined by F&O lot sizes.
Stop-Loss : Strictly follow the specified stop-loss levels. A stop-loss is considered triggered only after a 15-minute candle closes beyond the level.
Position Sizing : Limit exposure to a maximum of two open positions at a time.
Important Note : Do not risk more than 2% of your capital per trade.