• Products
  • Community
  • Markets
  • Brokers
  • More
Get started
  • Markets
  • /India
  • /Stocks
  • /Ideas
BRITANNIABRITANNIA INDUSTRIES LTD. – Pendam Concepts | Price Action Observation This chart presents a technical observation of BRITANNIA based on approximately one month of historical price data. A reference line/level has been drawn using the Pendam Concepts strategy, based on observed price action and market structure. This chart is intended for educational and informational purposes only. It is not a prediction, investment recommendation, or a buy/sell call. Disclaimer: This content is for educational and informational purposes only and should not be construed as investment advice, research recommendation, or solicitation to buy or sell any security. The security shown is used for illustration/educational purposes only and is not recommendatory. Past price action does not guarantee future results. Investments in securities market are subject to market risks. Please conduct your own research and consult a SEBI-registered professional, where appropriate.
NSE:BRITANNIALong
by mistertraderofficial
GAILGAIL (India) Ltd. – Pendam Concepts | Price Action Observation This chart presents a technical observation of GAIL based on approximately one month of historical price data. A reference line/level has been drawn using the Pendam Concepts strategy, based on observed price action and market structure. This chart is intended for educational and informational purposes only. It is not a prediction, investment recommendation, or a buy/sell call. Disclaimer: This content is for educational and informational purposes only and should not be construed as investment advice, research recommendation, or solicitation to buy or sell any security. The security shown is used for illustration/educational purposes only and is not recommendatory. Past price action does not guarantee future results. Investments in securities market are subject to market risks. Please conduct your own research and consult a SEBI-registered professional, where appropriate.
NSE:GAILLong
by mistertraderofficial
Kamdhenu 🎯 STOCK TO WATCH WEEKLY R4 BREAKOUT SETUP KAMDHENU LTD — NSE: KAMDHENU ₹42 → ₹67 → ₹97 → ₹162 📌 TRADE LEVELS 🟢 Buy Zone: ₹42 🚀 Breakout Zone: ₹42 🛑 Stop Loss: ₹27 🎯 Target 1: ₹67 🎯 Target 2: ₹97 🎯 Target 3: ₹162 🏗️ BUSINESS OVERVIEW Branded TMT steel products company. Operates through a large franchise and distribution network. FY26 brand sales turnover was about ₹23,000 Cr, with 100+ franchise manufacturing units and 12,500+ dealers. The company reported a 20% market share in India's organised retail TMT segment in its investor commentary. 🔥 WHY IT CAUGHT MY ATTENTION ✅ ₹42 is the key breakout reference ✅ Q1 FY27 revenue from operations ₹213.35 Cr, +9.0% YoY ✅ Q1 FY27 PAT ₹28.69 Cr, +33.9% YoY ✅ Q1 FY27 recorded the company's highest-ever PBT and PAT ✅ Strong branded TMT franchise ecosystem 📊 COMPANY SNAPSHOT Industry: Steel / TMT Products FY26 Revenue: ₹763.4 Cr FY26 PAT: ₹78.4 Cr FY26 ROE: 22% FY26 Debt: Zero Risk Defined. Reward Visible. ⚠️ IMPORTANT High-risk momentum setup. Q1 other income included ₹15.91 Cr of realised/unrealised investment valuation gains, so not all of the PAT growth came from core operations. Steel prices, construction demand and franchise volumes remain important variables. Disclaimer: This content is for educational purposes only and not investment advice. Please do your own due diligence before making any investment decisions. © 20K Microcap Investing | R4 Momentum Desk #Kamdhenu #KAMDHENU #SteelStocks #TMT #InfrastructureStocks #MomentumStocks #BreakoutStocks #IndianStocks #R4Momentum #StockToWatch 
NSE:KAMDHENULong
by Microcap_Investor
Motisons Jewellers: Potential X-Wave Target at 22.21📉 NSE NSE:MOTISONS Elliott Wave Setup Motisons Jewellers Ltd. (NSE) is showing an interesting Elliott Wave structure on the daily timeframe. The decline from 33.80 to 10.62 is currently being interpreted as a larger Wave W , subdividing into an A-B-C zigzag : Wave A: 33.80 → 15.40, with a five-wave internal structure Wave B: 15.40 → 24.02 Wave C: 24.02 → 10.62, also developing as a five-wave decline This gives a potential W = A-B-C structure terminating at 10.62 . 🎯 Target: 22 The advance from 10.62 is now being considered as a potential X-wave. A possible interpretation is: X = A-B-C If the internal structure continues to support A-B-C, the 22.21 area becomes an important level to watch for possible X-wave completion. If the internal subdivision fails to support a zigzag, the wave count may need to be revised. 💭️ What do you think? Does the move from 10.62 look like an X-wave zigzag to you, and could 22.21 become the eventual X termination zone?
NSE:MOTISONSLong
by VCSompura
MAZDA LIMITED## Mazda Ltd. (CMP ₹266.00, NSE: MAZDA) **The SmartWay Research Desk | 21 September 2026** An Ahmedabad‑based engineering company, incorporated in 1990. Mazda Ltd. is engaged in **manufacturing of vacuum systems, evaporators, pollution control equipment, and allied engineering products**, catering to industries such as chemicals, pharmaceuticals, food processing, and power. **Promoter Holding (Jun 2026):** **Mazda Group (Patel Family) — ~65.1% stake (no pledges)** --- ### FY22–FY26 Snapshot - **Revenue Growth:** FY26 revenue ₹642 Cr vs ₹562 Cr in FY25 (+14.2% YoY). → **Good** - **Net Profit:** FY26 PAT ₹82 Cr vs ₹70 Cr in FY25 (+17.1% YoY). → **Good** - **Operating Margin:** FY26 EBITDA ₹142 Cr, margin 22.1% vs 21.4% last year (+70 bps). → **Good** - **Equity Capital:** Stable, face value ₹10. → **Good** - **Dividend Policy:** Dividend ₹3.00/share declared for FY26. → **Good** - **Asset Building:** Investments in **vacuum systems and pollution control equipment expansion**. → **Good** - **Sales:** Strong demand from **chemical and pharma industries**. → **Good** - **Expense:** Raw material cost pressures (steel, alloys) remain. → **Neutral/Good** - **EPS:** FY26 EPS ₹26.25 vs ₹22.40 last year (+17.2%). → **Good** --- ### Institutional Interest & Ownership Trends (Jun 2026) - **Promoter Holding:** ~65.1% (no pledges) - **FII Holding:** ~3.2% - **DII Holding:** ~6.8% - **Retail & Others:** ~24.9% --- ### Strategic Moves & Innovations - Expansion in **vacuum systems for chemical and pharma sectors**. - Focus on **pollution control and environmental engineering solutions**. - Partnerships with **global engineering firms for technology transfer**. - Diversification into **food processing and power sector equipment**. --- ### Cash Flow & Balance Sheet Strength - Market cap ~₹840 Cr. - Debt‑to‑equity ratio ~0.34 (moderate leverage). - Book value per share ₹92.00; P/B ~2.9. - EPS (TTM) ₹26.25; P/E ~10.1. --- ### Risk Factors - Low‑moderate **P/E ratio ~10.1**, valuations attractive. - Dependence on **industrial demand cycles**. - Exposure to **commodity price volatility (steel, alloys)**. - Competition from Thermax, Triveni Engineering, and Kirloskar Pneumatic. --- ### Investor Takeaway Mazda Ltd. has delivered **steady FY26 performance**, supported by demand in chemical, pharma, and pollution control equipment. With strong promoter backing (Patel Family, 65.1% stake), dividend payouts, and leadership in niche engineering solutions, Mazda remains a **small‑cap industrial engineering play**. At CMP ₹266.00, valuations are **attractive (P/E ~10.1, P/B ~2.9)**, reflecting growth potential with manageable risks.
NSE:MAZDALong
by TechnicalAnalystSucrit
MEGA ENERGYGujarat energy at sweet spot and at throw away price. start accumulate below 300 as much as possible for long term targets of 4000 plus. Do you own research before taking positions.
NSE:GUJENERGYLong
by harkeeth
DHOOTTRANSDHOOTTRANS IPO Base Up move- 47% plus move after listing Low Risk High Reward Setup
DLong
by lokeshparihar
SBIFUNDS - LONG — breakout attemptCMP: ₹561.35 | Daily chart Strong +3.77% candle from the recent low of ₹525. Price has broken above the short-term descending trendline around ₹545–550. It is also approaching/breaking the larger falling trendline near ₹550–555. RSI ~50.7 and rising sharply → momentum has improved without being overbought. Key levels Level View ₹545–550 🟢 Breakout/support ₹525–530 Strong support ₹575–580 Target 1 ₹590–600 Target 2 ₹620–625 Target 3 / major resistance Trade view Above ₹555–560: 🟢 LONG Potential targets: ₹580 → ₹600 → ₹620 Below ₹545: 🟡 breakout weakens. Below ₹525: 🔴 bullish setup invalidated. Bottom line: This is a much better long setup than short setup. The key is whether ₹545–550 now acts as support. I would prefer a hold/retest of that zone rather than chasing the ₹561 spike.
SLong
by vinaygupta478
Morepen : The Burnol MakerElections par bhui, Elections ke baad bhi Highest EPS quarter ATH of 121 PER is high at 47 Great Company, SELL for the time being. Buy at sub 50
NSE:MOREPENLABShort
by SWFguy
HDFC Bank (4H.) | Potentian Triple BottomHDFC Bank is showing a potential Triple Bottom formation around the ₹720–₹730 support zone, where price has reacted multiple times. 🔹 Support Zone: ₹720–₹730 🔹 Resistance Zone: ₹815–₹820 🔹 Neckline: ₹840–₹845 Bullish Confirmation: A strong 4H candle close above ₹840–₹845 could confirm the breakout and indicate further upside potential. Bearish Confirmation: A decisive breakdown below ₹720 could invalidate the bullish setup and signal further weakness. 📌 Key levels to watch: ₹720 support | ₹820 resistance | ₹840–₹845 neckline This is a technical analysis setup, not a guaranteed outcome. Always manage risk and trade according to your own plan. #HDFCBank #TechnicalAnalysis #TripleBottom #NSE #PriceAction #TradingView #SwingTrading
NSE:HDFCBANKLong
by RitikAlphaX
Updated
22
punjab & sind bank , trendline supportthis stock have reached on a trendline at bottom side , and in recent days it have made 1 hammer and now last trading day it havemade another important candle , ( dont know name), position can be made for with time frame target( select time 6 month , 1 year or whatever you like )
NSE:PSBLong
by talwinfer12
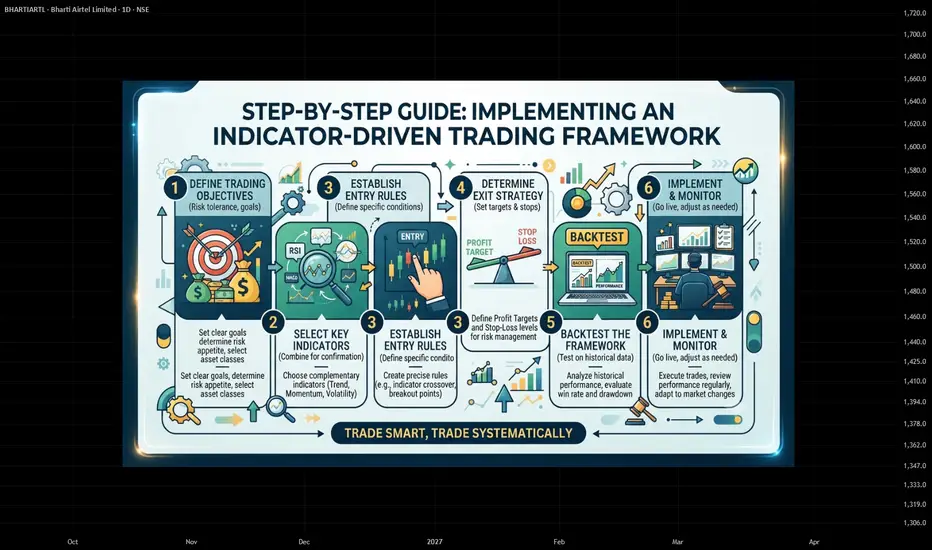
Implementing an Indicator-Driven Trading Framework🔎 Step-by-Step Guide: Implementing an Indicator-Driven Trading Framework ------------------------------ ➡️ Step 1: Establish Your Market Bias (Trend Identification) Before looking for entries, you must identify the market's overall direction to avoid trading against institutional momentum. * Use a trend indicator like the Exponential Moving Average (EMA) (e.g., 50-period or 200-period). * Action: Only look for buy setups if the price is above the EMA, and only look for short setups if the price is below the EMA. This removes visual guesswork about the trend. ------------------------------ ➡️ Step 2: Measure Market Volatility (Risk Parameter Definition) Markets constantly shift between high and low volatility. Your risk parameters must mathematically adapt to these changes so your trades have room to breathe. * Use a volatility indicator like the Average True Range (ATR) or Bollinger Bands. * Action: Check the current ATR value. Use a multiple of this value (e.g., 1.5x or 2x ATR) to determine the distance of your stop-loss from your entry point. This ensures your stop-loss is placed safely outside normal market noise. ------------------------------ ➡️ Step 3: Wait for Confluence (The Strict Entry Checklist) Avoid chasing sudden price spikes or giving into FOMO. Establish a multi-factor checklist that must be fully satisfied before risking capital. * Combine your trend indicator with a momentum oscillator like the Relative Strength Index (RSI) or Stochastic Oscillator. * Action: Execute a trade only when your conditions align simultaneously. For example: Price is above the 50 EMA (Trend) AND the RSI pulls back below 30 then crosses back up (Momentum is oversold but recovering). If one condition is missing, no trade is taken. ------------------------------ ➡️ Step 4: Synthesize Volume and Institutional Order Flow Validate price movements by confirming whether big institutional players are participating in the move. * Use volume-based indicators like the Volume Weighted Average Price (VWAP) or liquidity heatmaps. * Action: For a long setup, ensure the price is holding above the VWAP, which indicates institutional buyers are supporting the current price levels. ------------------------------ ➡️ Step 5: Run a Historical Audit (Strategic Backtesting) Never risk real capital based on a gut feeling. Since indicators rely on rigid mathematical formulas, you can audit your exact strategy before trading live. * Action: Plug your exact indicator rules (from Steps 1 to 4) into a charting platform's backtesting software. Run the parameters against years of historical data to verify the strategy's win rate, profit factor, and maximum historical drawdown. ------------------------------ ➡️ Step 6: Automate or Standardise Execution Strip away emotional traps like hesitation, panic-selling, or revenge trading by turning your execution into a binary process. * Action: Set up automated alerts or coded orders that trigger the exact millisecond your indicator parameters cross. The data will dictate your exit or entry—leaving no room for human analytical paralysis.
NSE:BHARTIARTLEducation
by TechnicalAnalystSucrit
Physicswallah - Potential Energy & Kinetic Energy in TradingIn Physics: Potential Energy = Stored Energy Kinetic Energy = Energy in Motion We can use the same idea to understand price movement. Potential Energy in Trading: When price stays in a small range or consolidation for some time, energy is building up. Buyers and sellers are becoming more active, and liquidity is accumulating. This is like stored energy. Kinetic Energy in Trading: When this stored energy is released, price starts moving with high speed and large displacement. In Smart Money Trading, this strong movement is often seen as displacement or an impulsive move. Simple Formula to Remember Consolidation → Energy Build-up → Liquidity Trigger → Strong Displacement Potential Energy = Energy stored in the market Kinetic Energy = Energy released through price movement This is a "conceptual trading analogy", not a direct application of the laws of Physics.
NSE:PWL
by Arvind_Share_Academy
Oberoi Ltd🚨 OBEROI REALTY: THE REBOUND SETUP IS BACK! 🎯 Buy Zone: ₹1,821 📍 Pivot: ₹1,816 🛑 Stop Loss: ₹1,660 🎯 Target: ₹2,151 WHY THE TECHNICAL SETUP? 📈 Price is holding above the 100 & 200 SMA, keeping the broader structure constructive. 🔄 RSI around 46 has cooled from higher levels — momentum has reset rather than becoming overheated. ⚡ Stoch RSI is turning upward, indicating momentum recovery. 📊 Price is attempting to reclaim the 20/50-day moving-average zone, which can act as the next confirmation trigger. 🏗️ ₹1,660–₹1,770 zone provides structural support through the 100/200 SMA area. 💰 Risk: ₹161/share 🚀 Reward: ₹330/share ⚡ Risk:Reward: 1:2.05 📈 Potential Upside: 18.1% The idea isn't to chase the rebound — ₹1,821 is the trigger zone. #OBEROIRLTY #OberoiRealty #SwingTrading #StockToWatch #NSE #IndianStocks #StockMarketIndia #20KMicrocapInvesting
NSE:OBEROIRLTYLong
by Microcap_Investor
Edelweiss Financial services 🎯 STOCK TO WATCH WEEKLY R4 BREAKOUT SETUP EDELWEISS FINANCIAL SERVICES LTD — NSE: EDELWEISS ₹139 → ₹286 → ₹303 → ₹570 📌 TRADE LEVELS 🟢 Buy Zone: ₹139 🚀 Breakout Zone: ₹139 🛑 Stop Loss: ₹92 🎯 Target 1: ₹286 🎯 Target 2: ₹303 🎯 Target 3: ₹570 🏦 BUSINESS OVERVIEW Diversified financial-services group. Businesses include asset management, asset reconstruction, insurance and credit/financial solutions. Alternative Asset Management and Asset Reconstruction are important profit contributors. The group continues to operate across multiple financial-services segments. 🔥 WHY IT CAUGHT MY ATTENTION ✅ ₹139 is the key breakout reference ✅ Q1 FY27 revenue from operations ₹2,328.5 Cr ✅ Q1 FY27 PAT attributable to owners ₹122.2 Cr, +83% YoY ✅ Alternative Asset Management fee-paying AUM reached ₹48,623 Cr, +27% YoY ✅ MSME loan disbursements increased to ₹353 Cr, 3× YoY 📊 COMPANY SNAPSHOT Industry: Diversified Financial Services Q1 FY27 Revenue: ₹2,328.5 Cr Q1 FY27 PAT: ₹122.2 Cr Alternatives Fee-Paying AUM: ₹48,623 Cr Risk Defined. Reward Visible. ⚠️ IMPORTANT High-risk momentum setup. The Capital business remained loss-making in Q1 FY27, while Insurance also remained loss-making. PAT growth should be assessed alongside the underlying performance of individual businesses and earnings quality. Follow strict stop-loss discipline. Disclaimer: This content is for educational purposes only and not investment advice. Please do your own due diligence before making any investment decisions. © 20K Microcap Investing | R4 Momentum Desk #Edelweiss #EDELWEISS #FinancialServices #AssetManagement #NBFC #MomentumStocks #BreakoutStocks #IndianStocks #R4Momentum #StockToWatch 
NSE:EDELWEISSLong
by Microcap_Investor
Ashiana Housing🎯 STOCK TO WATCH WEEKLY R4 BREAKOUT SETUP ASHIANA HOUSING LTD — NSE: ASHIANA ₹380–400 → ₹628 📌 TRADE LEVELS 🟢 Buy Zone: ₹380–400 🚀 Breakout Zone: ₹369 🛑 Stop Loss: ₹329 🎯 Target: ₹628 🏠 BUSINESS OVERVIEW Residential real-estate developer with 44+ years of operating history. Focus areas include Comfort Homes, Senior Living and Kid-Centric Homes. More than 28 million sq. ft. delivered across five states. About 73 lakh sq. ft. under development. 🔥 WHY IT CAUGHT MY ATTENTION ✅ ₹369 is the key breakout reference ✅ FY26 value of area booked reached a record ₹2,421 Cr, +25% YoY ✅ FY26 customer collections reached a record ₹1,762 Cr ✅ Senior Living bookings reached a record ₹570 Cr ✅ New projects across Gurugram, Bhiwadi, Pune, Chennai, Jaipur and Jamshedpur provide development visibility. 📊 COMPANY SNAPSHOT Industry: Residential Real Estate FY26 Area Booked: 26.73 lakh sq. ft. FY26 Sales & Other Income: ₹1,187 Cr FY26 PAT: ₹117.89 Cr FY26 Pre-tax Operating Cash Flow: ₹576.58 Cr Risk Defined. Reward Visible. ⚠️ IMPORTANT High-risk momentum setup. Real-estate businesses are sensitive to demand, interest rates and execution. Project delivery and conversion of bookings into collections remain important. Follow strict stop-loss discipline. Disclaimer: This content is for educational purposes only and not investment advice. Please do your own due diligence before making any investment decisions. © 20K Microcap Investing | R4 Momentum Desk #AshianaHousing #ASHIANA #RealEstateStocks #HousingStocks #SeniorLiving #MomentumStocks #BreakoutStocks #IndianStocks #R4Momentum #StockToWatch 
NSE:ASHIANALong
by Microcap_Investor
Ready for more upsideBreaking out AVWAP of all time high again and again, showing good accumulation. This is ready for another break out in coming days.
NSE:GPPLLong
by harishpop321
Ready to flyBreak Out from AVWAP from all time high; and retest again. there was good accumulation with volume, this may bring more upside.
NSE:NAUKRILong
by harishpop321
Watchout for more upsideShowing good accumulation and breakout of AVAWP should push more upside. Volumes in inverted shoulder looks promising, SL can be close below neck line.
NSE:PCBLLong
by harishpop321
Ready for breakoutReady for more upsides, confirmed by breakout of AVWAP from ATH and Pitchfork channel breakout. SL can be medial line of Pitchfork
NSE:RATNAMANILong
by harishpop321
Ready to go Long Showing signals to enter long with SL 660. A quick retest on AVWAP from all time high is done. Targets are shown in the chart
NSE:RKFORGELong
by harishpop321
Meesho - Bullish Setup Looks Ready for an Ups Meesho is showing strong bullish momentum on the charts. After a period of consolidation, the price action suggests that buyers are taking control, and we are anticipating a solid upside move.. For upside seen possible 233-255-299 Now.219 invalid below 164
NSE:MEESHOLong
by lashkarikartik
Going longClosing above 1955 will be a good for long with SL 1820
NSE:PHOENIXLTDLong
by harishpop321
112233445566778899101011111212131314141515161617171818191920202121222223232424252526262727282829293030313132323333343435353636373738383939404041414242
…999999

Made by humans

Select market data provided by ICE Data Services. Select reference data provided by FactSet. Copyright © 2026 FactSet Research Systems Inc.Copyright © 2026, American Bankers Association. CUSIP Database provided by FactSet Research Systems Inc. All rights reserved. SEC filings and other documents provided by Quartr.© 2026 TradingView, Inc.

More than a product
  • Supercharts
Screeners
  • Stocks
  • ETFs
  • Bonds
  • Crypto coins
  • CEX pairs
  • DEX pairs
  • Pine
Heatmaps
  • Stocks
  • ETFs
  • Crypto coins
Calendars
  • Economic
  • Earnings
  • Dividends
  • IPOs
More products
  • Portfolios
  • Fundamental Graphs
  • Yield Curves
  • Options
  • Macro Maps
  • Pine Script®
  • MCP Server
Apps
  • Mobile
  • Desktop
Community
  • Social network
  • Wall of Love
  • Refer a friend
  • Creator program
  • House Rules
  • Moderators
Ideas
  • Trading
  • Education
  • Editors' picks
Pine Script
  • Indicators & strategies
  • Wizards
  • Freelancers
  • Marketplace
Tools & subscriptions
  • Features
  • Pricing
  • Market data
  • Gift plans
Trading
  • Overview
  • Brokers
  • Brokers comparison
  • The Leap
Special offers
  • CME Group futures
  • Eurex futures
  • US stocks bundle
About company
  • Who we are
  • Space mission
  • Blog
  • Help Center
  • Careers
  • Media kit
Merch
  • TradingView store
  • Tarot cards for traders
  • The C63 TradeTime
Policies & security
  • Terms of Use
  • Disclaimer
  • Privacy Policy
  • Cookies Policy
  • Accessibility Statement
  • Security tips
  • Bug Bounty program
  • Status page
Business solutions
  • Widgets
  • Charting libraries
  • Lightweight Charts™
  • Advanced Charts
  • Trading Platform
Growth opportunities
  • Advertising
  • Brokerage integration
  • Partner program
  • Education program
Community
  • Social network
  • Wall of Love
  • Refer a friend
  • Creator program
  • House Rules
  • Moderators
Ideas
  • Trading
  • Education
  • Editors' picks
Pine Script
  • Indicators & strategies
  • Wizards
  • Freelancers
  • Marketplace
Business solutions
  • Widgets
  • Charting libraries
  • Lightweight Charts™
  • Advanced Charts
  • Trading Platform
Growth opportunities
  • Advertising
  • Brokerage integration
  • Partner program
  • Education program
Look FirstLook First