TITAN | Slow Grind — Waiting For The Dip To Buy!
By analyzing the 🇮🇳 #TITAN (Titan Company) chart on the 4H timeframe, we can see that the broader trend remains firmly bullish — but the character of the latest leg up is telling us something important. Let's break it down.
📊 4H Timeframe
On the 4H, the pattern has been consistent: price builds buy-side liquidity above, corrects lower, then rallies again to print a fresh BOS. That cycle has repeated cleanly through this uptrend.
On the last correction, price pulled back deeply — all the way into the strong Order Block ( ₹3,944.3 – ₹4,082.4 ) — and came genuinely close to flipping the trend at the Protected Low ( ₹3,964.0 ). But buyers defended it, price reversed, and it went on to target the buy-side liquidity above once again.
Here's the key nuance: since breaking the last major high, the advance has been slow and grinding rather than impulsive. To me that signals weakness in the move — and while price climbs along this rising trendline, it's simultaneously building a fresh pool of liquidity beneath it. Price is currently trading around ₹4,696.0 , just under the BSL at ₹4,734.7 .
🎯 The Bias
My base case: price sweeps the liquidity it has been building along the rising trendline, then drops back into the Flip Zone ( ₹4,385.8 – ₹4,501.7 ) — the former resistance that now acts as support. That's the area where I'd look to buy again, with confirmation , targeting the buy-side liquidity above at ₹4,734.7 and beyond.
In my view, chasing here isn't the play — the slow grind into the highs is exactly the kind of move that gets swept before the real leg. The bullish structure stays valid above the Protected Low (₹3,964.0); a decisive break below it would flip the structure and invalidate this idea.
📰 Fundamental Backdrop
The bullish structure lines up with a genuinely strong fundamental run. Titan — the Tata Group's jewellery and watches arm — released a robust Q1 FY27 business update on July 6, and the stock surged around 4% to a record high of ₹4,655.90 the next session, surpassing its previous peak of ₹4,601.10 from May 8. The numbers behind it were strong across the board: the domestic business grew 37%, led by jewellery up 39%, with watches and eyecare each up 23%, while the international business exploded 128% year-on-year, taking its overseas store count to 163. Analysts have turned more constructive — Morgan Stanley expects the festive season and Akshaya Tritiya demand to support the print, while Motilal Oswal carries a Buy rating with a ₹5,000 target, pointing to the medium-term plan to open 50 Tanishq stores and the Damas Jewellery integration expanding Titan's reach into the global diaspora and higher-margin categories. Titan has also notably outperformed the market in 2026, rising around 14% while the benchmark index fell about 8%. The risk to respect: gold price volatility and regulatory shifts have historically driven sharp post-earnings swings in this name — and with the stock already at record highs on a strong update, a lot of good news is priced in. That's precisely why the chart's slow grind into the highs deserves attention rather than blind chasing.
This analysis will be updated as the market evolves. If this breakdown added value, drop a like 👍 and a comment 💬 to support the work — and share where you see Titan heading next! Best Regards, BigBeluga 🐳
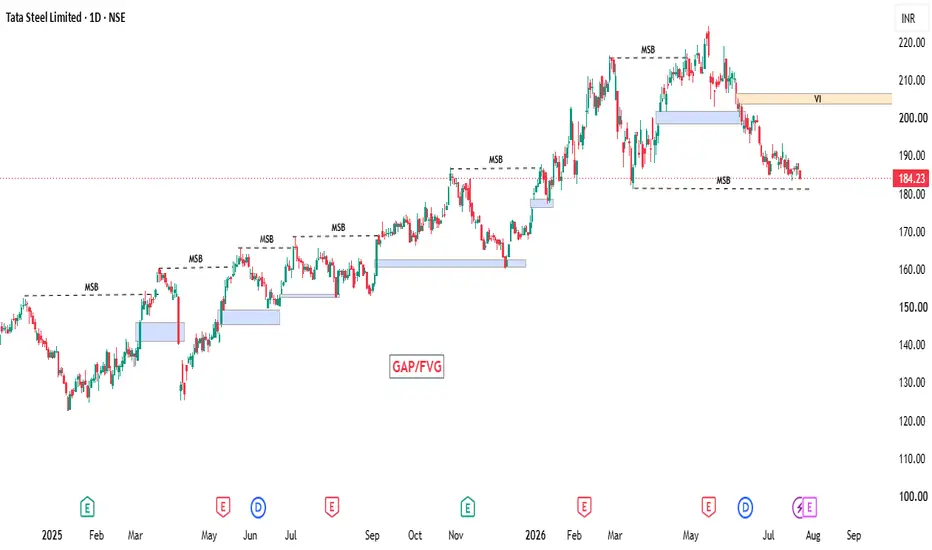
TATASTEEL (D)The Sequence & Mechanics
The Break (MSB): When price aggressively pushes through a previous swing high or low, it prints an MSB, confirming a shift or continuation of market structure. This impulsive displacement leaves behind institutional inefficiencies, marked as FVGs (the light blue zones on chart).
The Retest / Mitigation: After creating an MSB, price frequently experiences a corrective pullback or retracement. Instead of stopping arbitrarily, algorithmic price delivery often targets these unfilled GAP/FVG zones to rebalance liquidity and mitigate open institutional orders.
Reaction at the Zone: As the price dips back into the FVG zone (acting as a demand block in a bullish trend), traders look for confirmation—such as lower-timeframe shift in structure or specific rejection candles—before price resumes its impulsive move in the direction of the macro trend.
THE POINT IS:- If this is becoming the next MSB, did you get to see your FVG?
ADANIGREEN to replicate BHEL's June Ending Diagonal Price action
TF: 75 minutes
CMP: 1520
The observation is that, price is forming and ED (Ending Diagonal) and we could expect a pullback on this counter.
Similar move and price action happened in BHEL in the previous month and I believe that both the chart set ups are identical to a great extent.
Here is the chart of BHEL with impulse move, and prolonged Ending Diagonal Formation, before it fell down in June (first leg of the correction)
Let's see how July unfolds for Adanigreen.
As you can see, the RR is not good for buying on this counter at 1500 levels and it is better to wait for a pullback.
Disclaimer: I am not a SEBI registered Analyst and this is not a trading advise. Views are personal and for educational purpose only. Please consult your Financial Advisor for any investment decisions. Please consider my views only to get a different perspective (FOR or AGAINST your views). Please don't trade FNO based on my views. If you like my analysis and learnt something from it, please give a BOOST. Feel free to express your thoughts and questions in the comments section.
DIXON (D)Technical Note: Let the market come to your zones and show its hand. Trade safely and manage your risk! Always wait for your own confirmations before entering the market.
Risk Disclaimer: This analysis is for educational purposes only and does not constitute financial advice. Always practice proper risk and position sizing. The market is supreme; no one can make a 100% accurate prediction. Stop Loss Must if you want to be a profitable Trader.
MARKET VIEW:-
Current Bias: BULLISH
Preferred Strategy: – BUY ON DIP .... Wait for Confirmation
RADICO (D)Technical Note: Let the market come to your zones and show its hand. Trade safely and manage your risk! Always wait for your own confirmations before entering the market.
Risk Disclaimer: This analysis is for educational purposes only and does not constitute financial advice. Always practice proper risk and position sizing. The market is supreme; no one can make a 100% accurate prediction. Stop Loss Must if you want to be a profitable Trader.
MARKET VIEW:-
Current Bias: BULLISH
Preferred Strategy: – BUY ON DIP .... Wait for Confirmation
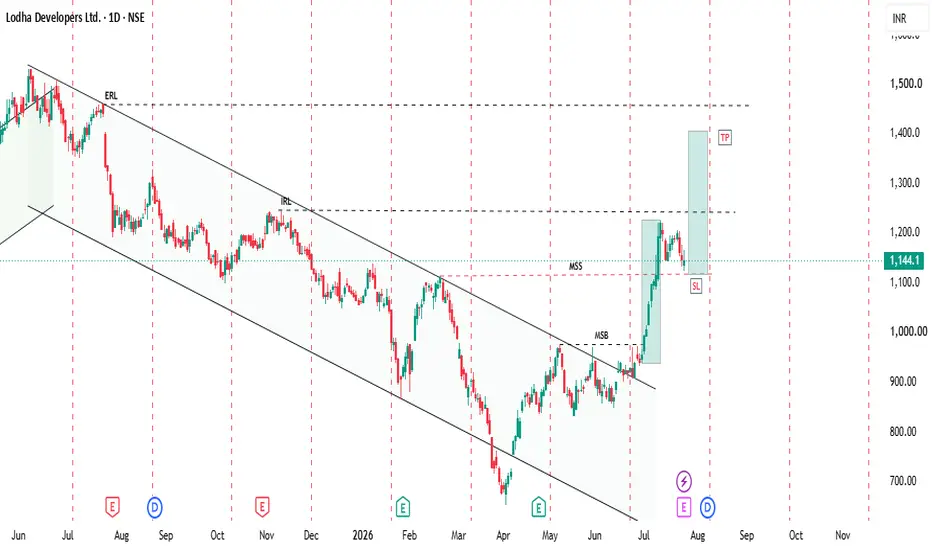
LODHA (D)Technical Note: Let the market come to your zones and show its hand. Trade safely and manage your risk! Always wait for your own confirmations before entering the market.
Risk Disclaimer: This analysis is for educational purposes only and does not constitute financial advice. Always practice proper risk and position sizing. The market is supreme; no one can make a 100% accurate prediction. Stop Loss Must if you want to be a profitable Trader.
MARKET VIEW:-
Current Bias: BULLISH
Preferred Strategy: – BUY ON DIP .... Wait for Confirmation
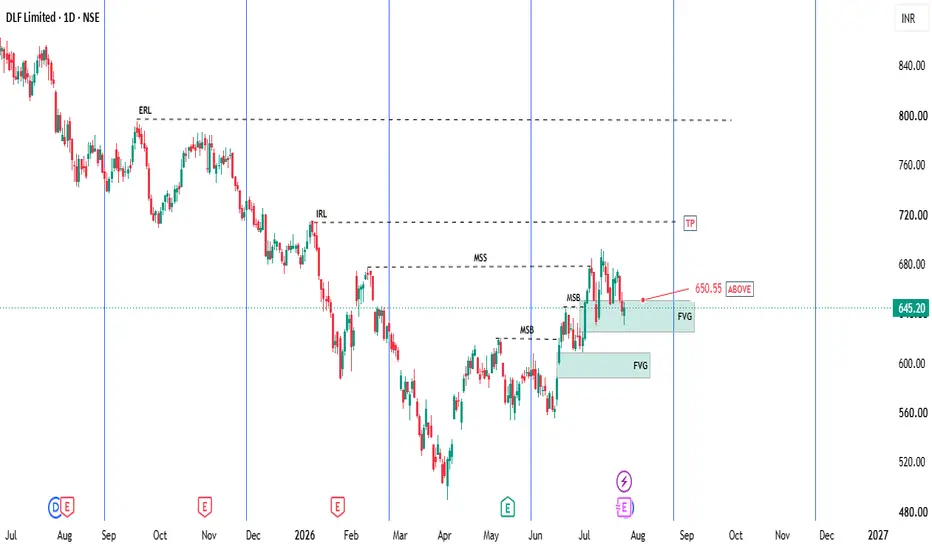
DLF (D)Technical Note: Let the market come to your zones and show its hand. Trade safely and manage your risk! Always wait for your own confirmations before entering the market.
Risk Disclaimer: This analysis is for educational purposes only and does not constitute financial advice. Always practice proper risk and position sizing. The market is supreme; no one can make a 100% accurate prediction. Stop Loss Must if you want to be a profitable Trader.
MARKET VIEW:-
Current Bias: BULLISH
Preferred Strategy: – BUY ON DIP .... Wait for Confirmation
GRAPHITE (D)Technical Note: Let the market come to your zones and show its hand. Trade safely and manage your risk! Always wait for your own confirmations before entering the market.
Risk Disclaimer: This analysis is for educational purposes only and does not constitute financial advice. Always practice proper risk and position sizing. The market is supreme; no one can make a 100% accurate prediction. Stop Loss Must if you want to be a profitable Trader.
MARKET VIEW:-
Current Bias: BULLISH
Preferred Strategy: – BUY ON DIP .... Wait for Confirmation
Astral LtdTechnical Note: Let the market come to your zones and show its hand. Trade safely and manage your risk! Always wait for your own confirmations before entering the market.
Risk Disclaimer: This analysis is for educational purposes only and does not constitute financial advice. Always practice proper risk and position sizing. The market is supreme; no one can make a 100% accurate prediction. Stop Loss Must if you want to be a profitable Trader.
MARKET VIEW:-
Current Bias: BULLISH
Preferred Strategy: – BUY ON DIP .... Wait for Confirmation
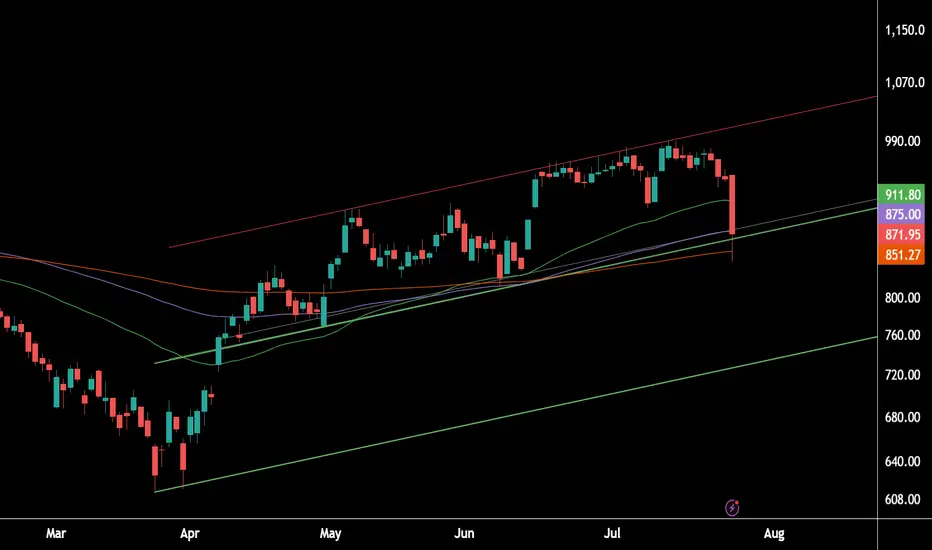
Motilal Oswal: Hold or Breakdown? Key Technical Levels to Watch.MOTILAL OSWAL – Technical Outlook
The stock continues to trade within a well-defined ascending channel and is currently positioned near the mid-channel support, which is also aligned with the 200 EMA. Historically, this confluence has acted as a strong demand zone, preventing the price from sustaining below it.
Bullish Scenario:
If the stock holds above the mid-channel support and the 200 EMA, buying momentum is likely to resume, with an upside potential towards ₹1,000.
Bearish Scenario:
A decisive breakdown below the channel support and the 200 EMA would invalidate the current bullish structure. In that case, the stock could witness a minimum downside move of around 70 points, with the next major support near ₹730.
Key Levels to Watch
Support: Mid-Channel + 200 EMA
Bullish Target: ₹1,000
Bearish Target: ₹730 (on confirmed breakdown)
It's a clean buy setupSyrma long setup : Syrma has shown the ability to make strong impulsive moves followed by periods of consolidation. Rather than chasing a breakout candle, wait for price to confirm that buyers are still in control. The highest-probability setups usually occur after the stock pauses near resistance, allowing weak hands to exit before the next move.
Will RADICO continue to outperform the index? I dont think so
CMP: 4065
TF: 2 hours
Irrespective of the index movement, this script was on the impulse run from March 2026.
It is one of the stocks outperforming the Index with great Relative Strength.
But now, as I see from EW perspective, the counts seem to get matured or will be matured in the next few sessions.
The final 5th (of the 5th) has ended already.. but there is no confirmation yet.. it could further develop in to a diagonal while staying above 3900
I see distribution taking place, but this is definitely NOT a place to GO LONG.. Trail with tight SL
Since the stock is in uptrend with strong RS, I wouldn't recommend shorting either.
Disclaimer: I am not a SEBI registered Analyst and this is not a trading advise. Views are personal and for educational purpose only. Please consult your Financial Advisor for any investment decisions. Please consider my views only to get a different perspective (FOR or AGAINST your views). Please don't trade FNO based on my views. If you like my analysis and learnt something from it, please give a BOOST. Feel free to express your thoughts and questions in the comments section.
Review and plan for 24th July 2026Nifty future and banknifty future analysis and intraday plan.
Results- Indigo, Coromandel.
This video is for information/education purpose only. you are 100% responsible for any actions you take by reading/viewing this post.
please consult your financial advisor before taking any action.
----Vinaykumar hiremath, CMT
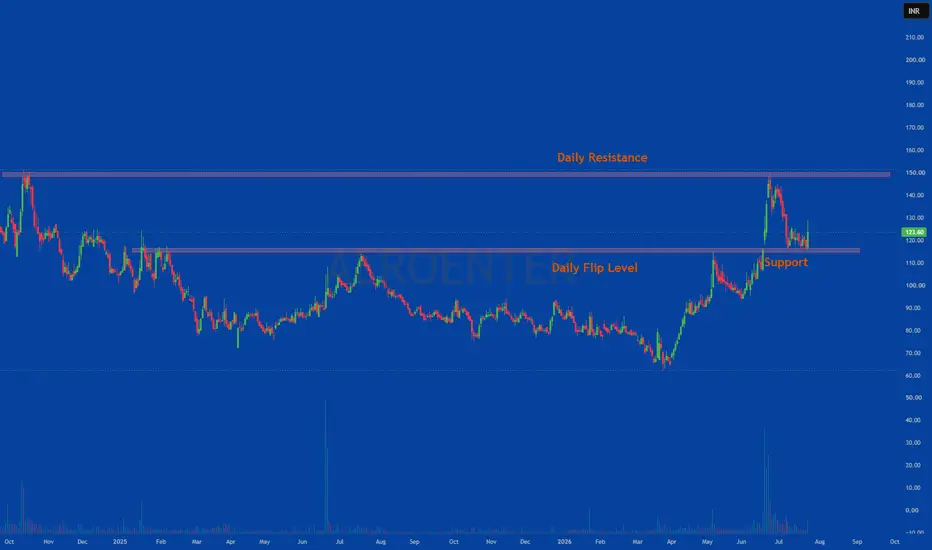
AROENTER — Technical Structure Analysis📈 AROENTER — Technical Structure Analysis
Chart Visual & Pattern Layout: ChartsSpecialist (via TradingView)
🔍 Technical Observations
Role Reversal (Support Become Resistance / Flip Levels): The chart features two distinct horizontal bands annotated as "Daily Flip Level."
Breakout & Retest at Lower Flip Zone: The lower highlighted channel previously served as a strong multi-month horizontal resistance zone. Following a decisive breakout, price retraced back to this exact level, validating it as new support ("Support").
Upper Supply Rejection: Upon bouncing off the lower support flip level, price rallied sharply to test a higher historical "Daily Flip Level," where it encountered supply and experienced a short-term pullback.
📚 Technical Analysis Concepts Demonstrated
Polarity Principle / Flip Levels: Observing how broken horizontal resistance levels invert to function as prospective support levels on subsequent retests.
Range-Bound Wave Structure: Mapping structural swing points across primary horizontal demand and supply channels.
Price Acceleration vs. Compression: Tracking multi-month consolidation cycles transitioning into rapid vertical expansion and subsequent retracements.
📌 SEBI Compliant Educational Disclaimer
Regulatory Disclaimer & Disclosures:
Educational Purpose Only: This post analyzes chart patterns and technical concepts strictly for learning and educational purposes.
No Recommendation: This content does NOT contain target levels, stop-loss triggers, entry calls, or buy/sell/hold recommendations.
SEBI Registration Status: ChartsSpecialist and the publisher are NOT SEBI-registered Research Analysts or Investment Advisors.
Risk Warning: Securities trading involves market risk. Past patterns do not guarantee future price movements. Please consult a qualified SEBI-registered financial advisor before taking any market positions.
#ChartsSpecialist #AROENTER #TechnicalAnalysis #ChartReading #StockMarketEducation #SEBICompliant #PriceAction #TradingView #FinancialLiteracy #NSE #SupportAndResistance #FlipLevels