• Products
  • Community
  • Markets
  • Brokers
  • More
Get started
  • Markets
  • /India
  • /Stocks
  • /Ideas
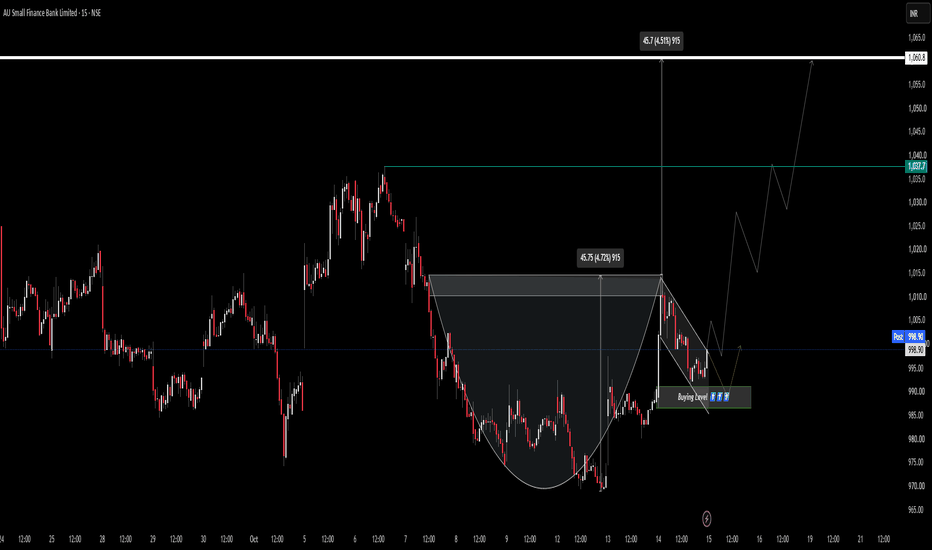
AU SMALL FINANCE BANK CUP AND HANDLE FORMATIONLook for Breakout , or Direct Buy from Buying Level , on bullish COnfirmation
NSE:AUBANKLong
by vishal6171
2
SKYGOLD Bullish Breakout from Rectangular ConsolidationLooking at the daily timeframe for Sky Gold and Diamonds Limited, the stock has been trading within a clear rectangular consolidation zone for several weeks. The price action was largely range-bound, oscillating between a support level near the 740 zone and a resistance level around the 850 mark. Recently, we can observe a strong bullish breakout above the upper boundary of this consolidation box. Crucially, this breakout candle is accompanied by a massive surge in trading volume, which valida
NSE:SKYGOLD
by ParamjitMahapatro
Updated
PRADPME Bull Flag Breakout Validated by Historic VolumePradeep Metals Limited is demonstrating a classic bullish continuation setup on the daily timeframe. After a strong initial rally from the 380 levels up to 600 (forming the flagpole), the stock entered a multi-month consolidation phase within a well-defined descending channel. The most recent price action shows a decisive breakout above the upper resistance line of this channel. Crucially, this breakout is supported by a massive spike in volume (over 514K), which dwarfs the average daily vol
NSE:PRADPME
by ParamjitMahapatro
Updated
1
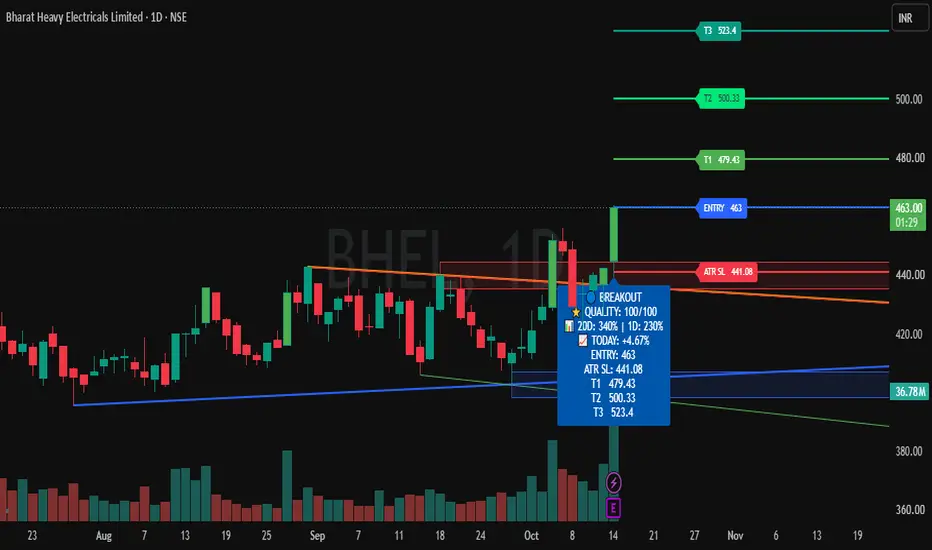
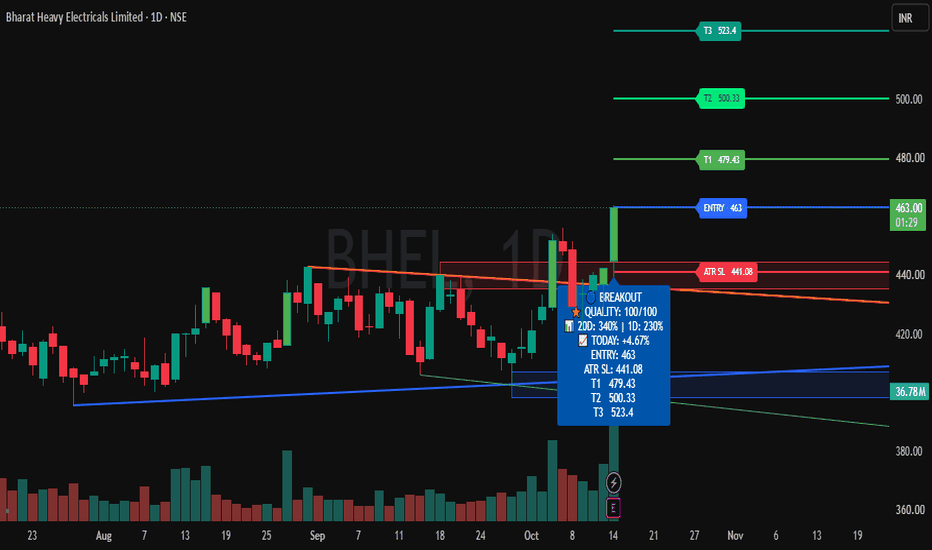
Buy Today, Sell Tomorrow for 3-5% - Daily Breakout SetupBHEL — BTST & SWING BREAKOUT SETUP Entry, Stop Loss & Targets Are Clearly Defined — Helping You Plan Your Trade With Confidence. 📊 Stock Strength: 100/100 (Note: Higher score indicates stronger stock conditions, not guaranteed returns.) A bullish breakout has appeared on the 1D timeframe with positive price action and strong volume expansion. 🔄 Trade Type: BTST & Swing Trade ──────────────────── 🎯 TRADE LEVELS ENTRY: ₹463 🛑 STOP LOSS ATR SL: ₹441 🎯 TARGETS T1: ₹479 T2: ₹500 T3: ₹523 ──
NSE:BHELLong
by nemichandbhati
RAMBHAJO Strong Breakout Above Key ResistanceTaking a look at the daily timeframe for Advit Jewels Limited, we can see a compelling technical setup. After a strong impulsive move in late August, the stock entered a period of healthy consolidation, forming a clear resistance ceiling around the 307.80 mark. In the most recent trading session, the price printed a strong bullish Marubozu-style candle, successfully breaking and closing above this key resistance level at 328.00 (+7.51%). This decisive price action indicates a high probability
R
by ParamjitMahapatro
Updated
HCLTech Surges Following Strong Q2 ResultsHighlights HCLTech is trading around ₹1,335–₹1,345 after a sharp earnings-led rally. The stock gained approximately 8.4% on October 13 following its Q2 FY27 results announced on Monday, October 12, rather than Saturday. Immediate resistance is around ₹1,350–₹1,355. A sustained breakout above ₹1,355 could push the stock towards ₹1,380–₹1,400, followed by ₹1,430. On the downside, ₹1,315–₹1,325 is the immediate support zone, while ₹1,280–₹1,300 remains the stronger demand area. Momentum has
NSE:HCLTECH
by yogeshwar
DIVGIITTS Classic Break and Retest Setup at Key SupportOverview & Technical Analysis Looking at the weekly chart for Divgi TorqTransfer Systems Ltd, we can observe a textbook example of a "break and retest" technical setup. The stock recently broke out of a structural base, forcefully clearing a major horizontal resistance line at 1,115.4. This breakout was accompanied by a massive surge in buying volume, validating the upward momentum. Following the initial upside rally, the price pulled back to retest the 1,115.4 level. As per classic market st
NSE:DIVGIITTS
by ParamjitMahapatro
Updated
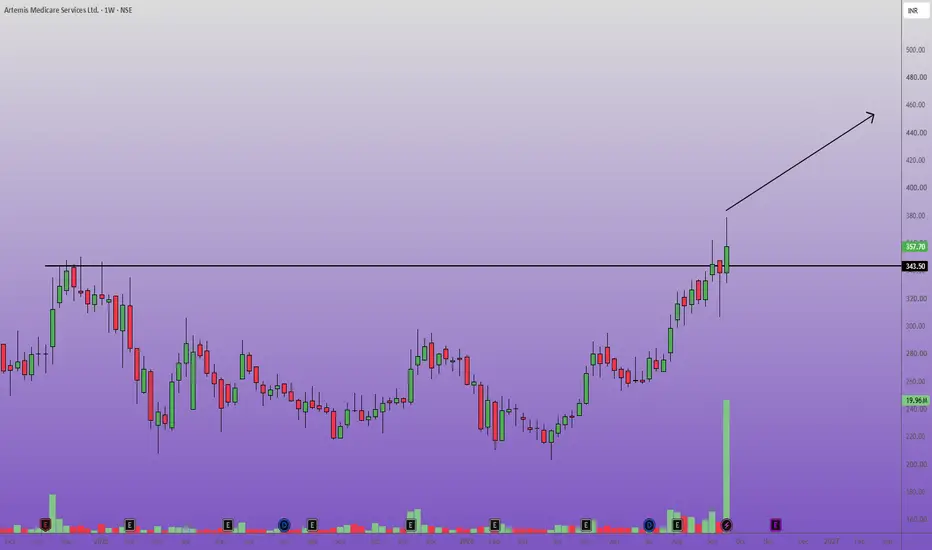
ARTEMISMED Weekly Breakout with Massive Volume SurgeArtemis Medicare Services Ltd. has formed a highly bullish technical setup on the weekly timeframe. The stock recently broke out above a critical horizontal resistance line at the 343.50 level. This breakout is validated by a massive, anomalous spike in trading volume, indicating strong institutional accumulation and high conviction behind the move. Following a prolonged period of volatility and basing, this price action suggests a structural shift in momentum. The previous heavy resistance
NSE:ARTEMISMED
by ParamjitMahapatro
Updated
SHANTIGOL Weekly Breakout Above Key Resistance & Strong VolumeThe weekly timeframe for Shanti Gold International Limited. Following a prolonged period of consolidation and recovery from the 170 levels earlier this year, the stock has staged a decisive breakout above a major horizontal resistance zone. Technical Analysis: Price Action: The price has cleanly broken and closed above the critical resistance line at 271.35, a level that previously acted as a strong supply zone in August/September. Volume Validation: The breakout is supported by a significant
NSE:SHANTIGOLD
by ParamjitMahapatro
Updated
CAPLIPOINT Major Resistance Breakout and RetestCaplin Point Laboratories Limited on the weekly timeframe outlines a clear bullish continuation setup. Chart Analysis & Rationale Major Structural Breakout: As seen the price decisively broke above a long-standing horizontal resistance level at 2,636.3. This marks a significant shift in the broader market structure. Volume Confirmation: The upward momentum that pushed the price through the 2,636.3 line was accompanied by a noticeable volume spike at the bottom of the chart, validating the stre
NSE:CAPLIPOINT
by ParamjitMahapatro
Updated
KPL : Strong Volume Breakout from Rectangular ConsolidationChart Analysis & Pattern: Looking at the daily timeframe for Kwality Pharmaceuticals Ltd, the stock has spent the last several weeks moving sideways within a well-defined rectangular consolidation pattern. The price has been bouncing strictly between a solid support base near 3,250 and a strong resistance ceiling around the 3,700–3,750 zone. The Breakout & Volume Confirmation: In the most recent trading session, KPL delivered a powerful bullish breakout, piercing through the upper boundary of t
NSE:KPL
by ParamjitMahapatro
Updated
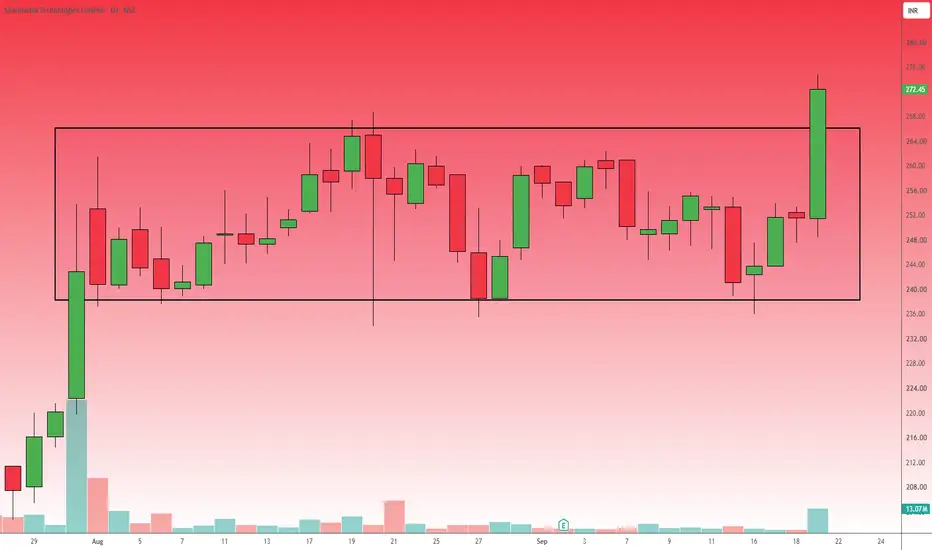
SHADOWFAX : Bullish Rectangle Breakout with Volume ConfirmationTrade Bias: Long Chart Analysis: As observed in Shadowfax Technologies has spent several weeks consolidating within a clear rectangular channel, bounded by support around 240.00 and resistance near 264.00. The most recent daily price action demonstrates a definitive breakout above this resistance zone, printing a strong, full-bodied bullish candle that closed at 272.45 (+8.31%). To satisfy the requirement of multiple technical confirmations, this pattern breakout is heavily supported by a ma
NSE:SHADOWFAX
by ParamjitMahapatro
Updated
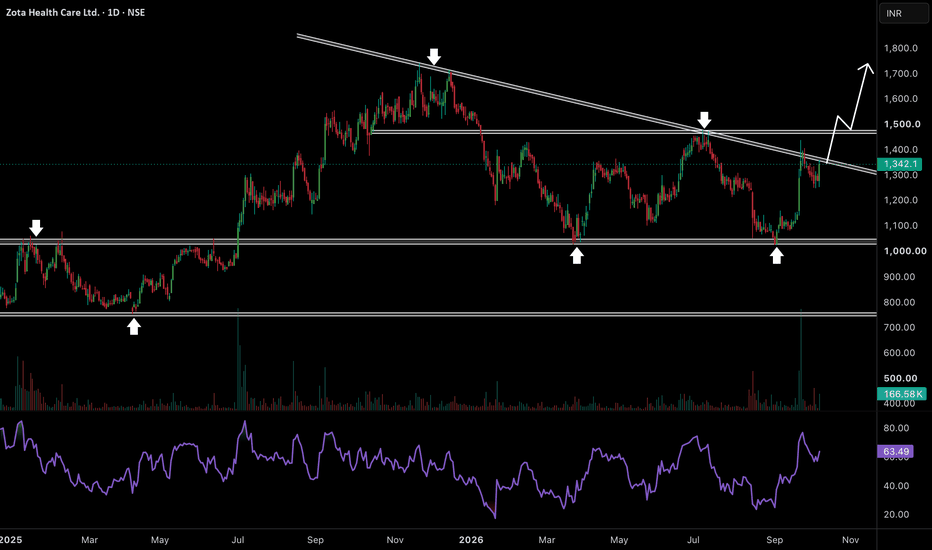
Zota Health Care Is Setting Up For A Major Trend ReversalStock is reaching a very interesting point after months of correction. The stock has repeatedly defended the 1030–1060 support zone and the latest reaction from this area was extremely strong. Buyers pushed price from nearly 1050 to 1400 in a very short period with a major expansion in volume. Now price is sitting just below the falling trendline that has controlled the stock since its peak near 1700. More importantly the latest correction was again absorbed quickly and RSI has recovered above 6
NSE:ZOTALong
by Marketik
Updated
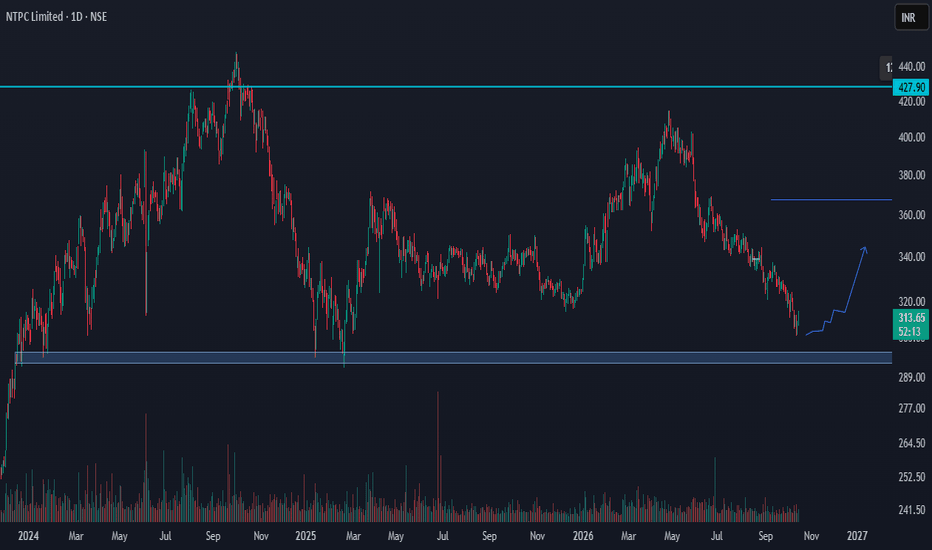
NTPC | Multi-Year Demand Zone RetestNTPC is currently trading in a major institutional accumulation zone on the daily chart after completing a corrective phase. Following a healthy profit-taking move from its all-time high of 427–435 that formed a lower-high and lower-low structure, the stock is now consolidating within the critical 300–310 band. This is the exact structural pivot from which an explosive breakout occurred in early 2024 and a successful base bounce formed in early 2025, making it a classic Change-of-Polarity demand
NSE:NTPCLong
by RA_Dongre_Ji
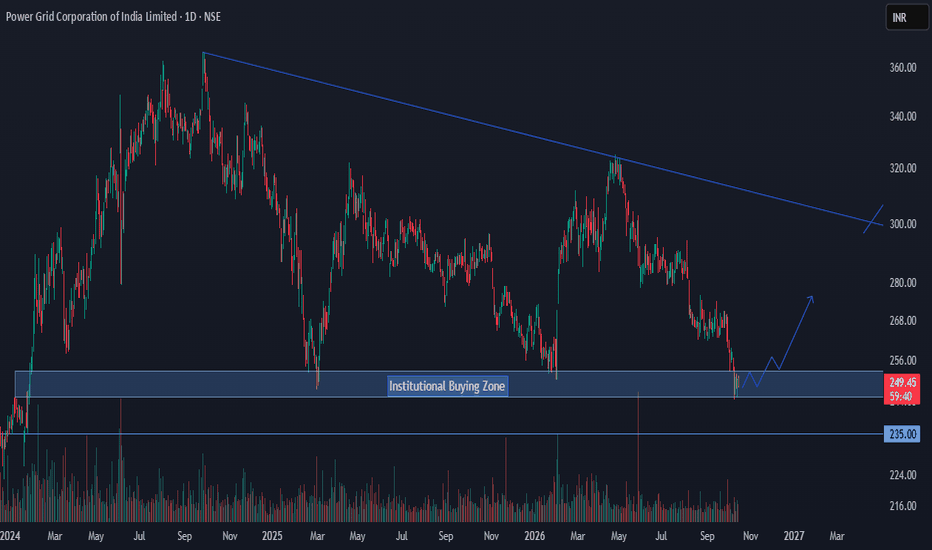
POWERGRID | Low-Risk, Solid Dividend Yield, Decadal GridPOWERGRID is currently trading at a key horizontal demand zone on the daily chart following an extensive corrective decline. Trading below a descending trendline resistance originating from the ₹360–₹365 peak, the stock has tested a major historical support zone at ₹245–₹252 after a recent sharp fall. This is the same critical structural base that saw the early 2024 breakout retest and triggered a double-bottom rally in early 2025, establishing this horizontal band as a high-conviction structura
NSE:POWERGRIDLong
by RA_Dongre_Ji
WSTCSTPAPR Massive Volume Breakout Above Major ResistanceIn this weekly chart of West Coast Paper Mills Limited, we can observe a textbook breakout from a prolonged consolidation phase. The price has aggressively breached the major horizontal resistance line at 775.65, a level that had previously capped upward movement for several months. Key Chart Observations: Volume Confirmation: The most bullish aspect of this setup is the massive volume spike accompanying the breakout candle. This indicates strong institutional interest and validates the price a
NSE:WSTCSTPAPR
by ParamjitMahapatro
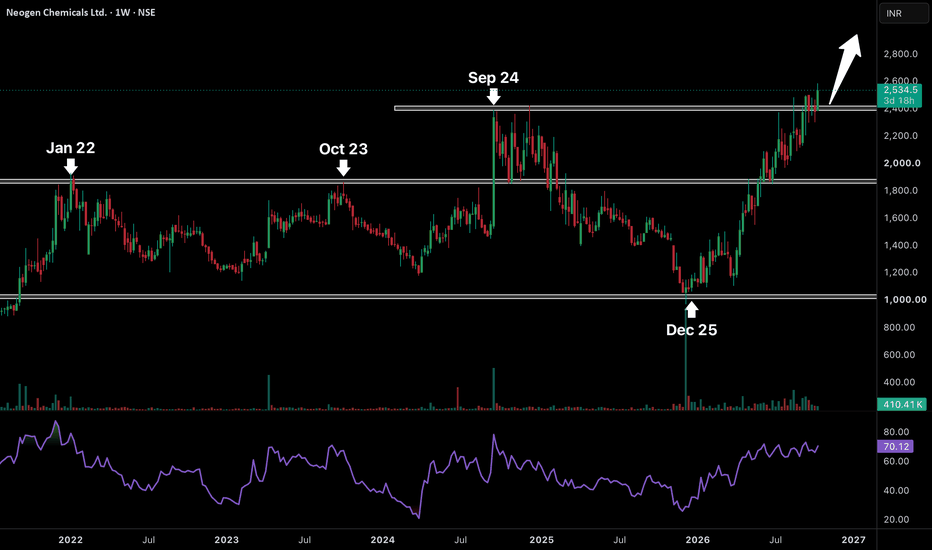
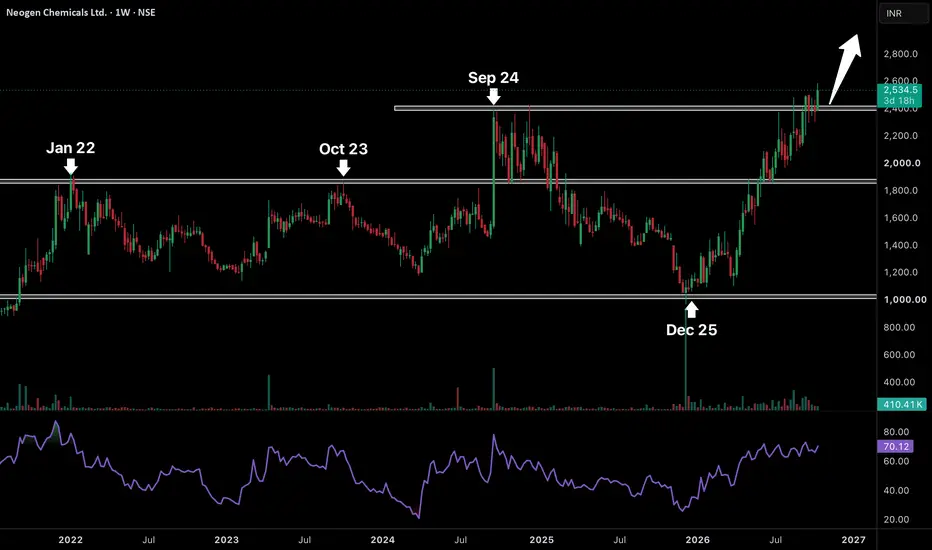
Neogen Chemicals Is Entering a New Bullish Expansion PhaseThe stock is showing one of the strongest reversal structures on the weekly chart. After spending almost four years moving between major support and resistance zones the stock is finally attempting to break above its September 2024 high. If we look at the previous structure the 1850–1900 zone acted as strong resistance in January 2022 and October 2023. Once this level was broken in September 2024 the stock rallied sharply towards 2400 but failed to sustain and entered another major correction. T
NSE:NEOGENLong
by Marketik
Updated
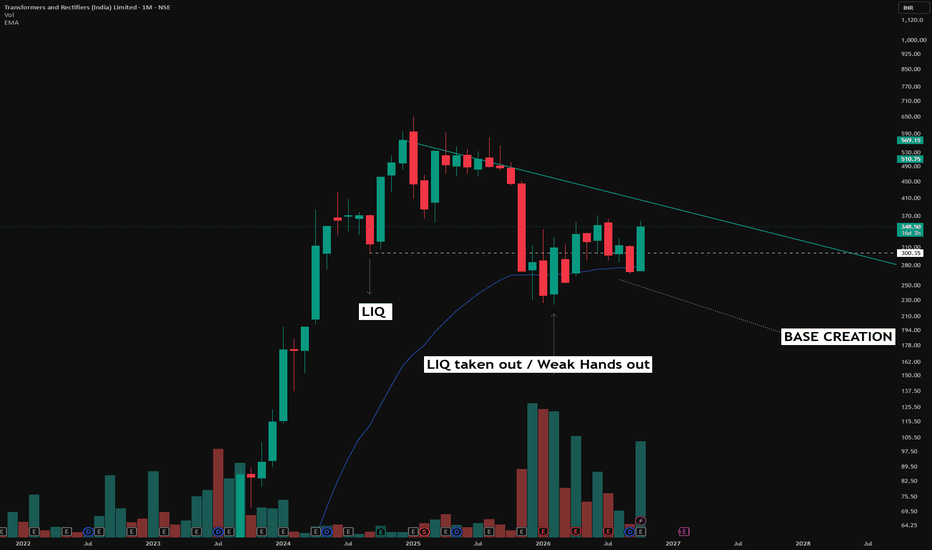
Strong Earnings. Liquidity Swept. Is the Market Building BaseAPOORV DUBEY | SEBI Registered Research Analyst This is an educational illustration of fundamental and technical analysis, not a recommendation to BUY, SELL or HOLD Why study Transformers & Rectifiers (India) Ltd ? Sometimes a stock becomes interesting for research not because of one breakout candle, but because improving business performance begins to coincide with an evolving market structure. 1. Fundamental Observation - The Earnings Comeback The September 2026 quarterly figures just
NSE:TARILLong
by Apoorv-Dubey_SEBI-RA
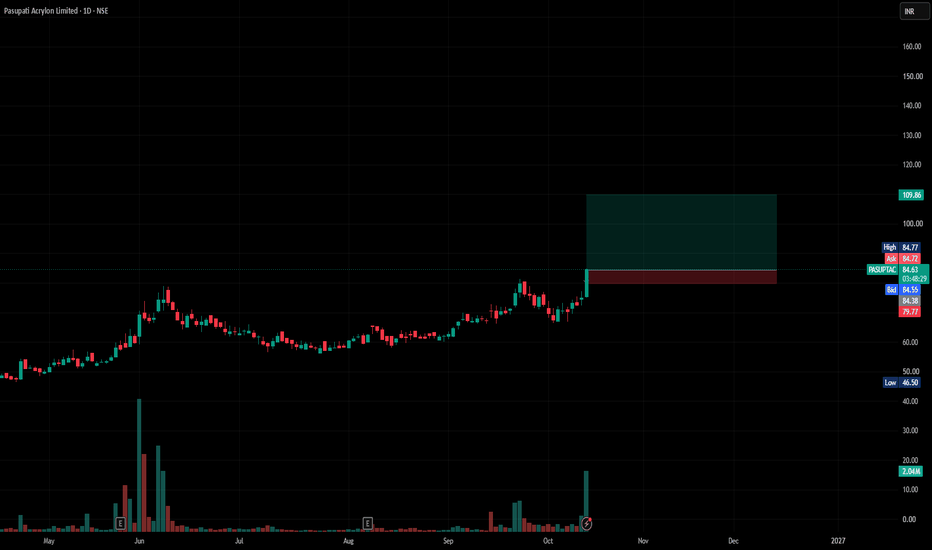
PASUPTAC Technical Analysis & Trade Setup Symbol: PASUPTAC (Pasupati Acrylon Limited) — Daily Timeframe (NSE) Current Price: ₹84.36 (+12.56% intraday move) Market Structure: Following an extended consolidation and base-building range above structural support near ₹55–₹60, the stock has broken out aggressively on massive volume spikes. Price action shows robust trend reversal characteristics, clearing major supply zones and pressing into fresh 52-week high territory. Key Technical Trade Levels Entry
NSE:PASUPTACLong
by QuantumX-Pro
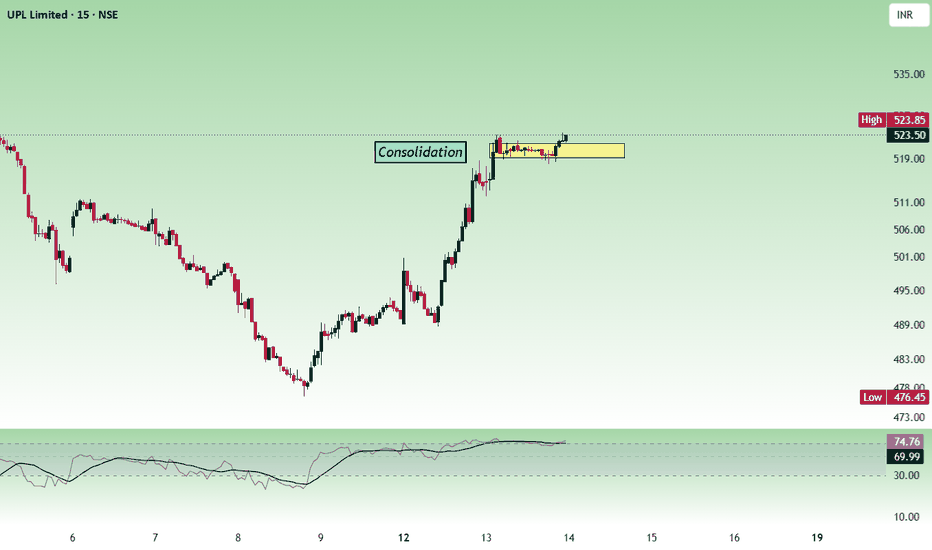
UPLIn a smaller timeframe, after a steady uptrend, the price consolidated, and now it is giving a breakout. In the daily timeframe, the price shows bullish strength. But above 522, with the stop loss at 517, for the targets 526, 531, 536 and 542. Resistance levels are 534 - 536 and 544. Profit booking or a pullback can happen at these resistance levels. Always do your analysis before taking any trade.
NSE:UPLLong
by vanathi
Updated
2
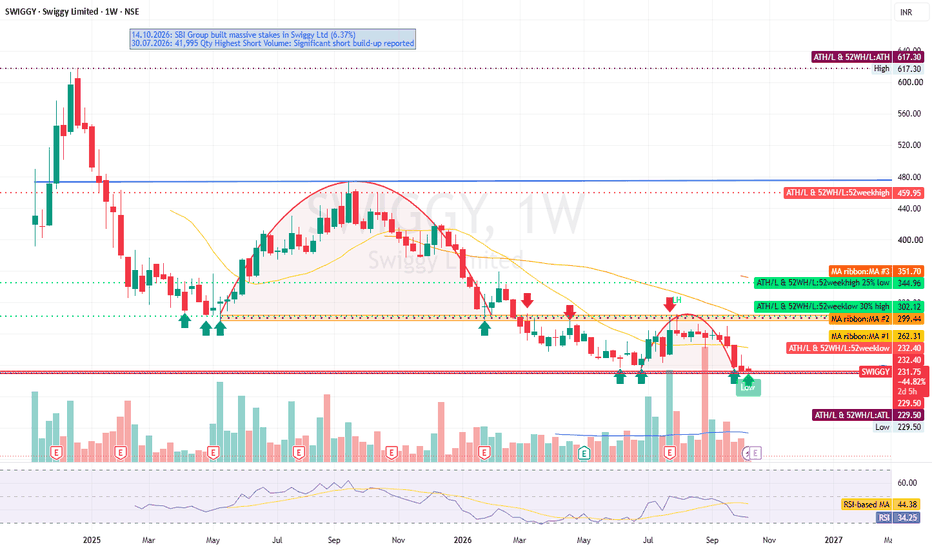
NSE:SWIGGY: bearish trend, watch 226.53 support and 240.07 pivotRead: bearish | Confidence: medium | Horizon: position | SWIGGY invalidation: ↑ 240.07INR SWIGGY (NSE:SWIGGY) — 1-3 Year Structural Read SWIGGY closed at 232.20 on the last completed session (14 Oct 2026, 04:30 UTC run), down 46.65% over 1 year and 40.31% YTD, sitting 2.44% above its 52-week low of 229.50. The daily technical gauge reads Sell (5 Buy / 6 Neutral / 15 Sell), the weekly structure is bearish, and the stock trades below its 50- and 200-day SMAs — a downtrend, not a base. The ana
NSE:SWIGGYLong
by bhanushalimonish
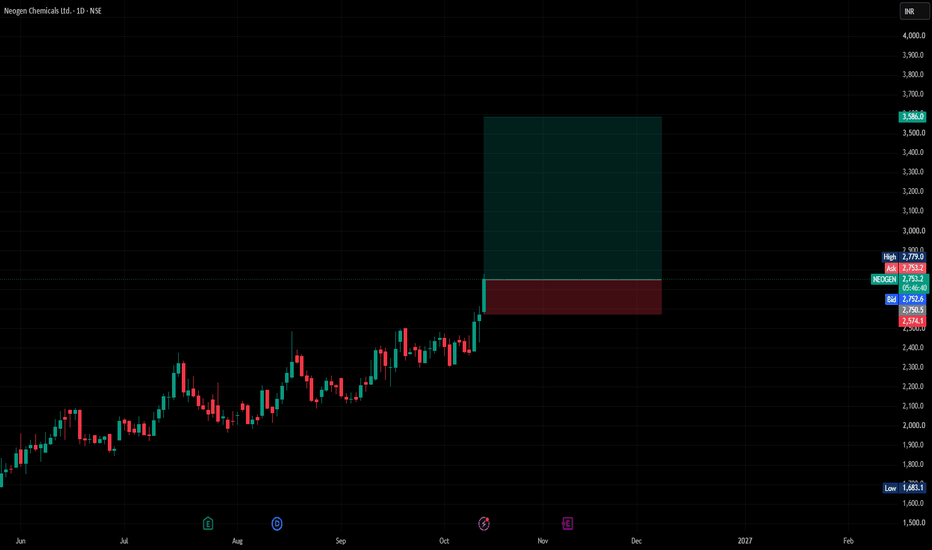
NEOGEN Technical Analysis & Trade Setup - Symbol: NEOGEN (Neogen Chemicals Ltd.) — Daily Timeframe (NSE) - Current Price: ₹2,754.30 (+7.18% intraday move) - Market Structure: Following an extended consolidation and base-building phase above the ₹1,683 swing low, the stock has staged a robust momentum breakout. Price action displays strong trend reversal characteristics, clearing local resistance levels and expanding into fresh high territory with heavy volume participation. Key Technical Trade Le
NSE:NEOGENLong
by QuantumX-Pro
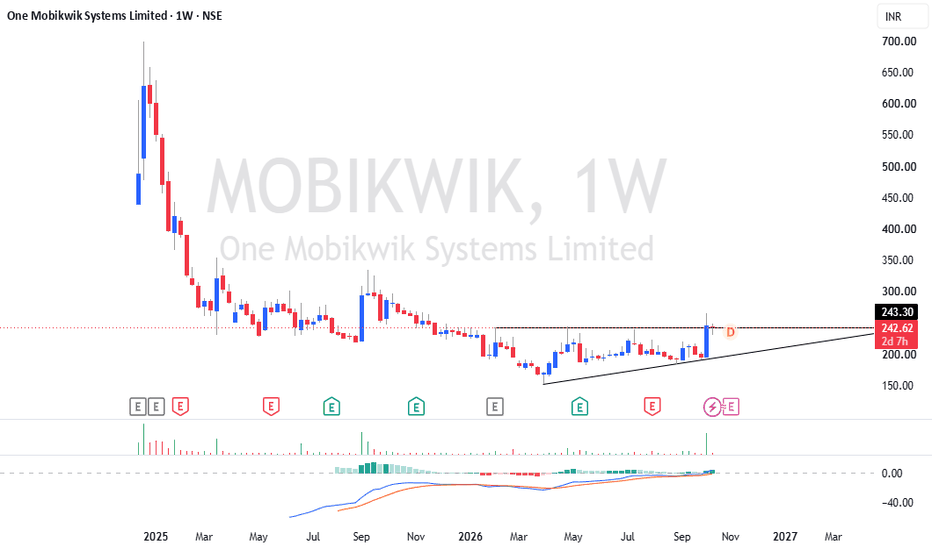
Possible Long in MOBIKWIK #mobikwikMOBIKWIK Analysis: A weekly breakout supported by high volume and a bullish MACD crossover indicates strong upward momentum. If overall market sentiment remains supportive, MOBIKWIK presents a solid long setup. Trade Plan: Position: Long Stop Loss: Below the trendline support Risk Management: Position sized risk 1%
NSE:MOBIKWIKLong
by vikasjariwalasnipervj
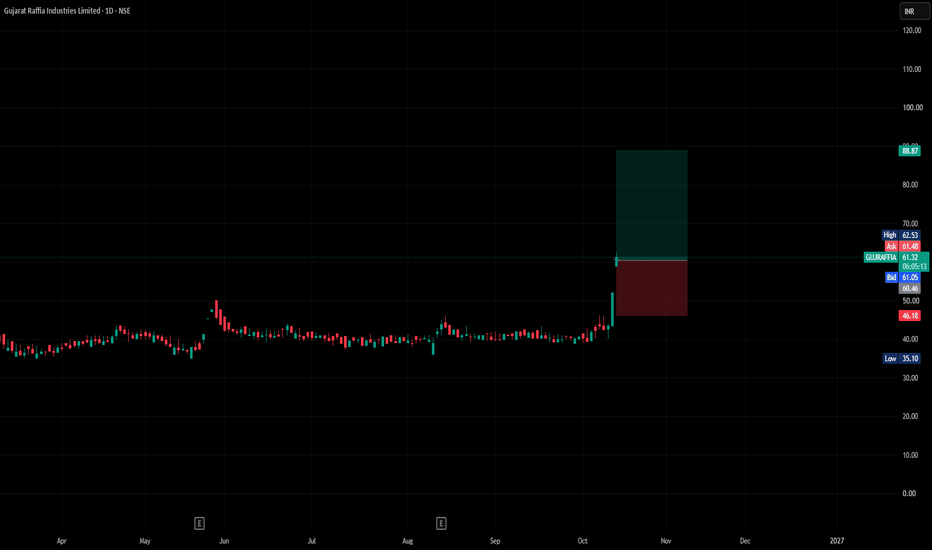
GUJRAFFIA Technical Analysis & Trade Setup - Symbol: GUJRAFFIA (Gujarat Raffia Industries Limited) — Daily Timeframe (NSE) - Current Price: ₹61.41 (-0.02% intraday move) - Market Structure: Following a prolonged side-trending base accumulation phase tightly bound between ₹35 and ₹45, the stock has exploded higher with strong momentum. The price action signals a major structural breakout, clearing multi-month range resistance to launch a new bullish markup phase. Key Technical Trade Levels - Entry
NSE:GUJRAFFIALong
by QuantumX-Pro
123456789101112131415161718192021222324252627282930313233343536373839404142
…999

Made by humans

Select market data provided by ICE Data Services. Select reference data provided by FactSet. Copyright © 2026 FactSet Research Systems Inc.Copyright © 2026, American Bankers Association. CUSIP Database provided by FactSet Research Systems Inc. All rights reserved. SEC filings and other documents provided by Quartr.© 2026 TradingView, Inc.

SOC 2 CompliantGDPR Compliant
More than a product
  • Supercharts
Screeners
  • Stocks
  • ETFs
  • Bonds
  • Crypto coins
  • CEX pairs
  • DEX pairs
  • Pine
Heatmaps
  • Stocks
  • ETFs
  • Crypto coins
Calendars
  • Economic
  • Earnings
  • Dividends
  • IPOs
More products
  • News Flow
  • Portfolios
  • Fundamental Graphs
  • Yield Curves
  • Options
  • Macro Maps
  • Pine Script®
  • MCP Server
Apps
  • Mobile
  • Desktop
Community
  • Social network
  • Wall of Love
  • Refer a friend
  • Creator program
  • House Rules
  • Moderators
Ideas
  • Trading
  • Education
  • Editors' picks
Pine Script
  • Indicators & strategies
  • Wizards
  • Freelancers
  • Marketplace
Tools & subscriptions
  • Features
  • Pricing
  • Market data
  • Gift plans
Trading
  • Overview
  • Brokers
  • Brokers comparison
  • The Leap
Special offers
  • CME Group futures
  • Eurex futures
  • US stocks bundle
About company
  • Who we are
  • Space mission
  • Blog
  • Help Center
  • Careers
  • Media kit
Merch
  • Tarot cards for traders
  • The C63 TradeTime
Policies & security
  • Terms of Use
  • Disclaimer
  • Privacy Policy
  • Cookies Policy
  • Accessibility Statement
  • Trust Center
  • Security tips
  • Bug Bounty program
  • Status page
Business solutions
  • Widgets
  • Charting libraries
  • Lightweight Charts™
  • Advanced Charts
  • Trading Platform
Growth opportunities
  • Advertising
  • Brokerage integration
  • Partner program
  • Education program
Community
  • Social network
  • Wall of Love
  • Refer a friend
  • Creator program
  • House Rules
  • Moderators
Ideas
  • Trading
  • Education
  • Editors' picks
Pine Script
  • Indicators & strategies
  • Wizards
  • Freelancers
  • Marketplace
Business solutions
  • Widgets
  • Charting libraries
  • Lightweight Charts™
  • Advanced Charts
  • Trading Platform
Growth opportunities
  • Advertising
  • Brokerage integration
  • Partner program
  • Education program
Look FirstLook First