DIVGIITTS Classic Break and Retest Setup at Key SupportOverview & Technical Analysis
Looking at the weekly chart for Divgi TorqTransfer Systems Ltd, we can observe a textbook example of a "break and retest" technical setup.
The stock recently broke out of a structural base, forcefully clearing a major horizontal resistance line at 1,115.4.
This breakout was accompanied by a massive surge in buying volume, validating the upward momentum.
Following the initial upside rally, the price pulled back to retest the 1,115.4 level. As per classic market st
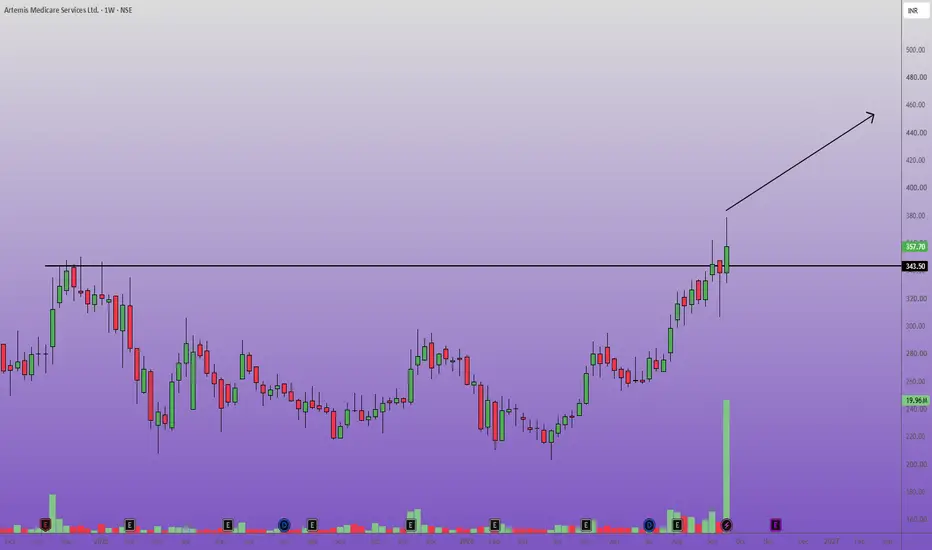
ARTEMISMED Weekly Breakout with Massive Volume SurgeArtemis Medicare Services Ltd. has formed a highly bullish technical setup on the weekly timeframe.
The stock recently broke out above a critical horizontal resistance line at the 343.50 level.
This breakout is validated by a massive, anomalous spike in trading volume, indicating strong institutional accumulation and high conviction behind the move.
Following a prolonged period of volatility and basing, this price action suggests a structural shift in momentum.
The previous heavy resistance
SHANTIGOL Weekly Breakout Above Key Resistance & Strong VolumeThe weekly timeframe for Shanti Gold International Limited.
Following a prolonged period of consolidation and recovery from the 170 levels earlier this year, the stock has staged a decisive breakout above a major horizontal resistance zone.
Technical Analysis:
Price Action: The price has cleanly broken and closed above the critical resistance line at 271.35, a level that previously acted as a strong supply zone in August/September.
Volume Validation: The breakout is supported by a significant
CAPLIPOINT Major Resistance Breakout and RetestCaplin Point Laboratories Limited on the weekly timeframe outlines a clear bullish continuation setup.
Chart Analysis & Rationale
Major Structural Breakout: As seen the price decisively broke above a long-standing horizontal resistance level at 2,636.3.
This marks a significant shift in the broader market structure.
Volume Confirmation: The upward momentum that pushed the price through the 2,636.3 line was accompanied by a noticeable volume spike at the bottom of the chart, validating the stre
KPL : Strong Volume Breakout from Rectangular ConsolidationChart Analysis & Pattern:
Looking at the daily timeframe for Kwality Pharmaceuticals Ltd, the stock has spent the last several weeks moving sideways within a well-defined rectangular consolidation pattern.
The price has been bouncing strictly between a solid support base near 3,250 and a strong resistance ceiling around the 3,700–3,750 zone.
The Breakout & Volume Confirmation:
In the most recent trading session, KPL delivered a powerful bullish breakout, piercing through the upper boundary of t
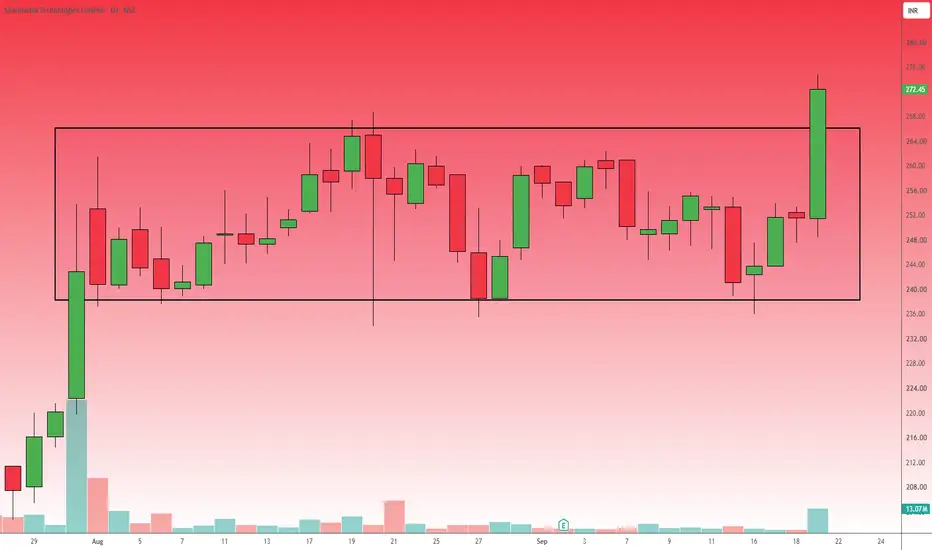
SHADOWFAX : Bullish Rectangle Breakout with Volume ConfirmationTrade Bias: Long
Chart Analysis:
As observed in Shadowfax Technologies has spent several weeks consolidating within a clear rectangular channel, bounded by support around 240.00 and resistance near 264.00.
The most recent daily price action demonstrates a definitive breakout above this resistance zone, printing a strong, full-bodied bullish candle that closed at 272.45 (+8.31%).
To satisfy the requirement of multiple technical confirmations, this pattern breakout is heavily supported by a ma
Zota Health Care Is Setting Up For A Major Trend ReversalStock is reaching a very interesting point after months of correction. The stock has repeatedly defended the 1030–1060 support zone and the latest reaction from this area was extremely strong. Buyers pushed price from nearly 1050 to 1400 in a very short period with a major expansion in volume. Now price is sitting just below the falling trendline that has controlled the stock since its peak near 1700. More importantly the latest correction was again absorbed quickly and RSI has recovered above 6
NTPC | Multi-Year Demand Zone RetestNTPC is currently trading in a major institutional accumulation zone on the daily chart after completing a corrective phase. Following a healthy profit-taking move from its all-time high of 427–435 that formed a lower-high and lower-low structure, the stock is now consolidating within the critical 300–310 band. This is the exact structural pivot from which an explosive breakout occurred in early 2024 and a successful base bounce formed in early 2025, making it a classic Change-of-Polarity demand
POWERGRID | Low-Risk, Solid Dividend Yield, Decadal GridPOWERGRID is currently trading at a key horizontal demand zone on the daily chart following an extensive corrective decline. Trading below a descending trendline resistance originating from the ₹360–₹365 peak, the stock has tested a major historical support zone at ₹245–₹252 after a recent sharp fall. This is the same critical structural base that saw the early 2024 breakout retest and triggered a double-bottom rally in early 2025, establishing this horizontal band as a high-conviction structura
WSTCSTPAPR Massive Volume Breakout Above Major ResistanceIn this weekly chart of West Coast Paper Mills Limited, we can observe a textbook breakout from a prolonged consolidation phase.
The price has aggressively breached the major horizontal resistance line at 775.65, a level that had previously capped upward movement for several months.
Key Chart Observations:
Volume Confirmation: The most bullish aspect of this setup is the massive volume spike accompanying the breakout candle.
This indicates strong institutional interest and validates the price a
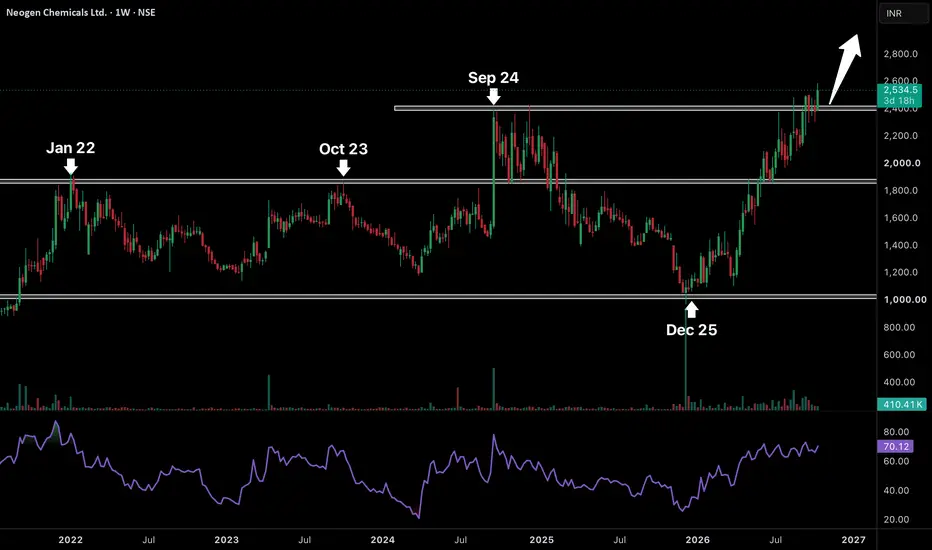
Neogen Chemicals Is Entering a New Bullish Expansion PhaseThe stock is showing one of the strongest reversal structures on the weekly chart. After spending almost four years moving between major support and resistance zones the stock is finally attempting to break above its September 2024 high. If we look at the previous structure the 1850–1900 zone acted as strong resistance in January 2022 and October 2023. Once this level was broken in September 2024 the stock rallied sharply towards 2400 but failed to sustain and entered another major correction. T
Strong Earnings. Liquidity Swept. Is the Market Building BaseAPOORV DUBEY | SEBI Registered Research Analyst
This is an educational illustration of fundamental and technical analysis, not a recommendation to BUY, SELL or HOLD
Why study Transformers & Rectifiers (India) Ltd ?
Sometimes a stock becomes interesting for research not because of one breakout candle, but because improving business performance begins to coincide with an evolving market structure.
1. Fundamental Observation - The Earnings Comeback
The September 2026 quarterly figures just
PASUPTAC Technical Analysis & Trade Setup
Symbol: PASUPTAC (Pasupati Acrylon Limited) — Daily Timeframe (NSE)
Current Price: ₹84.36 (+12.56% intraday move)
Market Structure: Following an extended consolidation and base-building range above structural support near ₹55–₹60, the stock has broken out aggressively on massive volume spikes. Price action shows robust trend reversal characteristics, clearing major supply zones and pressing into fresh 52-week high territory.
Key Technical Trade Levels
Entry
UPLIn a smaller timeframe, after a steady uptrend, the price consolidated, and now it is giving a breakout. In the daily timeframe, the price shows bullish strength.
But above 522, with the stop loss at 517, for the targets 526, 531, 536 and 542.
Resistance levels are 534 - 536 and 544. Profit booking or a pullback can happen at these resistance levels.
Always do your analysis before taking any trade.
NSE:SWIGGY: bearish trend, watch 226.53 support and 240.07 pivotRead: bearish | Confidence: medium | Horizon: position | SWIGGY invalidation: ↑ 240.07INR
SWIGGY (NSE:SWIGGY) — 1-3 Year Structural Read
SWIGGY closed at 232.20 on the last completed session (14 Oct 2026, 04:30 UTC run), down 46.65% over 1 year and 40.31% YTD, sitting 2.44% above its 52-week low of 229.50. The daily technical gauge reads Sell (5 Buy / 6 Neutral / 15 Sell), the weekly structure is bearish, and the stock trades below its 50- and 200-day SMAs — a downtrend, not a base. The ana
NEOGEN Technical Analysis & Trade Setup
- Symbol: NEOGEN (Neogen Chemicals Ltd.) — Daily Timeframe (NSE)
- Current Price: ₹2,754.30 (+7.18% intraday move)
- Market Structure: Following an extended consolidation and base-building phase above the ₹1,683 swing low, the stock has staged a robust momentum breakout. Price action displays strong trend reversal characteristics, clearing local resistance levels and expanding into fresh high territory with heavy volume participation.
Key Technical Trade Le
Possible Long in MOBIKWIK #mobikwikMOBIKWIK Analysis:
A weekly breakout supported by high volume and a bullish MACD crossover indicates strong upward momentum. If overall market sentiment remains supportive, MOBIKWIK presents a solid long setup.
Trade Plan:
Position: Long
Stop Loss: Below the trendline support
Risk Management: Position sized risk 1%
GUJRAFFIA Technical Analysis & Trade Setup
- Symbol: GUJRAFFIA (Gujarat Raffia Industries Limited) — Daily Timeframe (NSE)
- Current Price: ₹61.41 (-0.02% intraday move)
- Market Structure: Following a prolonged side-trending base accumulation phase tightly bound between ₹35 and ₹45, the stock has exploded higher with strong momentum. The price action signals a major structural breakout, clearing multi-month range resistance to launch a new bullish markup phase.
Key Technical Trade Levels
- Entry
High Probability Breakout!! - Neogen ChecmicalsLooks like a well brewed Breakout on Weekly chart with volumes developing on daily.
The stock has been Relatively Strong as compare with major indices and also in the momentum zone RSI > 60 on both weekly and daily charts.
VCP just before the daily break out vouches for a higher conviction.
Favorable Risk to Reward Ratio!!
#Momentum
#Breakout
#RisktoReward
#HighProbabilityWinner
LTM Strong Recovery from Recent Decline🔥 LTM Limited: Strong Recovery from Recent Decline
📊 MARKET STRUCTURE SNAPSHOT | NSE: LTM | DAILY
Closing Price: 4,215.00
Core Trend: Downtrend
Market State: Ranging
Chart Pattern: No confirmed chart pattern
Candlestick Pattern: Strong Bullish Candle
Price Structure: After declining from the August highs near 4,850, LTM has been trading under pressure. The latest session produced a strong recovery candle, closing at 4,215.00, up 4.88%, and moving back above the recent 4,000 area.
Technicals: Mom
Strong Bullish Recovery with Elevated Volume🔥 Infosys: Strong Bullish Recovery with Elevated Volume
📊 MARKET STRUCTURE SNAPSHOT | NSE: INFY | DAILY
Closing Price: 1,062.10
Core Trend: Broader trend remains under pressure; short-term recovery is visible
Market State: Range-bound
Chart Pattern: No confirmed chart pattern
Candlestick Pattern: Strong Bullish Candle
Price Structure: Infosys has rebounded from the recent low region around 990–1,000 after a prolonged decline from the 1,180–1,195 zone. The latest daily candle gained 4.13%, closin
TATAELXSI Strong Bullish Reversal with Three White Soldiers🔥 Tata Elxsi: Strong Bullish Reversal with Three White Soldiers
📊 MARKET STRUCTURE SNAPSHOT | NSE: TATAELXSI | DAILY
Closing Price: 3,426.70
Core Trend: Broader trend remains under pressure; short-term bullish reversal is developing
Market State: Range-bound
Chart Pattern: No confirmed chart pattern
Candlestick Pattern: Three White Soldiers
Price Structure: After declining from the 3,800–3,850 region towards 3,000, Tata Elxsi has recorded a strong recovery. The latest candle gained 5.21%, closin
SHRIRAMFIN Strong Bullish Recovery + Bullish Engulfing🔥 Shriram Finance: Strong Bullish Recovery + Bullish Engulfing
📊 MARKET STRUCTURE SNAPSHOT | NSE: SHRIRAMFIN | DAILY
Closing Price: 988.00
Core Trend: Broader trend remains under pressure; short-term recovery is visible
Market State: Range-bound
Chart Pattern: No confirmed chart pattern
Candlestick Pattern: Bullish Engulfing
Price Structure: After a sustained decline from the 1,100–1,140 region, Shriram Finance rebounded sharply from the recent lows near 920–930. The latest candle gained 6.31% a
HCLTECH Strong Bullish Reversal with Exceptional Volume🔥 HCL Technologies: Strong Bullish Reversal with Exceptional Volume
📊 MARKET STRUCTURE SNAPSHOT | NSE: HCLTECH | DAILY
Closing Price: 1,326.00 (+8.42%)
Core Trend: Broader trend under pressure; short-term momentum bullish
Market State: Strong Recovery / Range Expansion
Chart Pattern: No confirmed chart pattern
Candlestick Pattern: Bullish Engulfing
Price Structure: HCL Technologies has rebounded sharply from the 1,200–1,220 region, with a strong bullish candle carrying price above the recent con