BUY TODAY SELL TOMORROW for 5%DON’T HAVE TIME TO MANAGE YOUR TRADES?
- Take BTST trades at 3:25 pm every day
- Try to exit by taking 4-7% profit of each trade
- SL can also be maintained as closing below the low of the breakout candle
Now, why do I prefer BTST over swing trades? The primary reason is that I have observed that 90% of the stocks give most of the movement in just 1-2 days and the rest of the time they either consolidate or fall
Trendline breakout in TRANSRAILL
BUY TODAY SELL TOMORROW for 5%
BUY TODAY SELL TOMORROW for 5%DON’T HAVE TIME TO MANAGE YOUR TRADES?
- Take BTST trades at 3:25 pm every day
- Try to exit by taking 4-7% profit of each trade
- SL can also be maintained as closing below the low of the breakout candle
Now, why do I prefer BTST over swing trades? The primary reason is that I have observed that 90% of the stocks give most of the movement in just 1-2 days and the rest of the time they either consolidate or fall
Round bottom breakout in KLBRENG-B
BUY TODAY SELL TOMORROW for 5%
BUY TODAY SELL TOMORROW for 5%DON’T HAVE TIME TO MANAGE YOUR TRADES?
- Take BTST trades at 3:25 pm every day
- Try to exit by taking 4-7% profit of each trade
- SL can also be maintained as closing below the low of the breakout candle
Now, why do I prefer BTST over swing trades? The primary reason is that I have observed that 90% of the stocks give most of the movement in just 1-2 days and the rest of the time they either consolidate or fall
Trendline breakout in MANINDS
BUY TODAY SELL TOMORROW for 5%
BUY TODAY SELL TOMORROW for 5% DON’T HAVE TIME TO MANAGE YOUR TRADES?
- Take BTST trades at 3:25 pm every day
- Try to exit by taking 4-7% profit of each trade
- SL can also be maintained as closing below the low of the breakout candle
Now, why do I prefer BTST over swing trades? The primary reason is that I have observed that 90% of the stocks give most of the movement in just 1-2 days and the rest of the time they either consolidate or fall
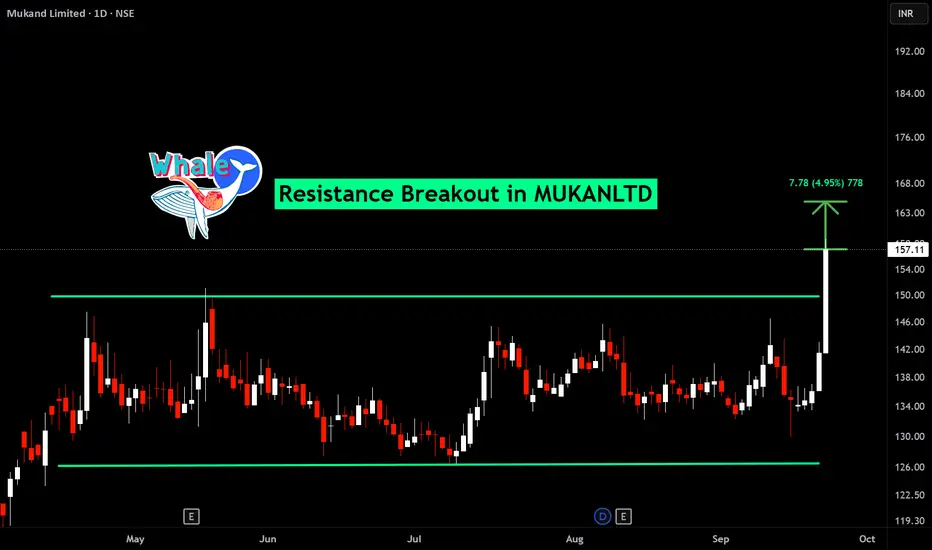
Resistance breakout in MUKANDLTD
BUY TODAY SELL TOMORROW for 5%
BUY TODAY SELL TOMORROW for 5%DON’T HAVE TIME TO MANAGE YOUR TRADES?
- Take BTST trades at 3:25 pm every day
- Try to exit by taking 4-7% profit of each trade
- SL can also be maintained as closing below the low of the breakout candle
Now, why do I prefer BTST over swing trades? The primary reason is that I have observed that 90% of the stocks give most of the movement in just 1-2 days and the rest of the time they either consolidate or fall
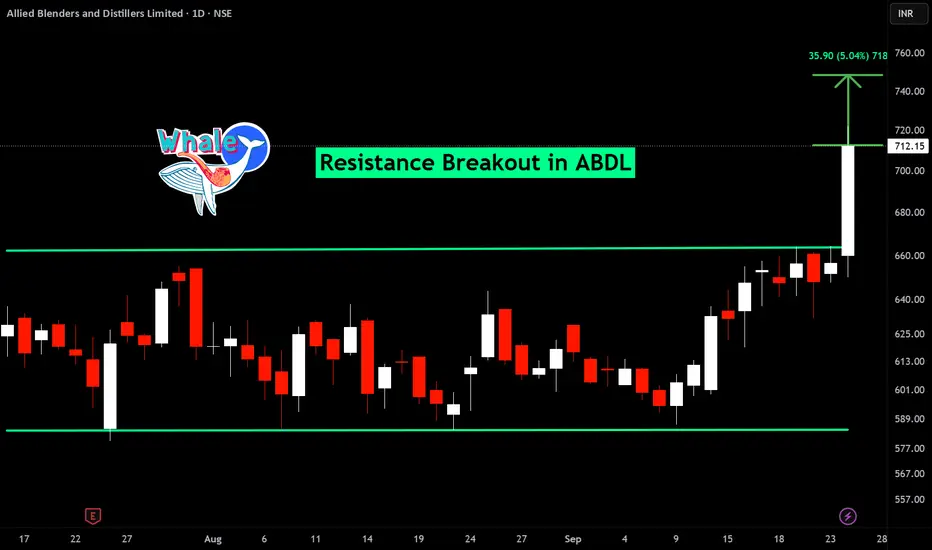
Resistance breakout in ABDL
BUY TODAY SELL TOMORROW for 5%
BUY TODAY SELL TOMORROW for 5%DON’T HAVE TIME TO MANAGE YOUR TRADES?
- Take BTST trades at 3:25 pm every day
- Try to exit by taking 4-7% profit of each trade
- SL can also be maintained as closing below the low of the breakout candle
Now, why do I prefer BTST over swing trades? The primary reason is that I have observed that 90% of the stocks give most of the movement in just 1-2 days and the rest of the time they either consolidate or fall
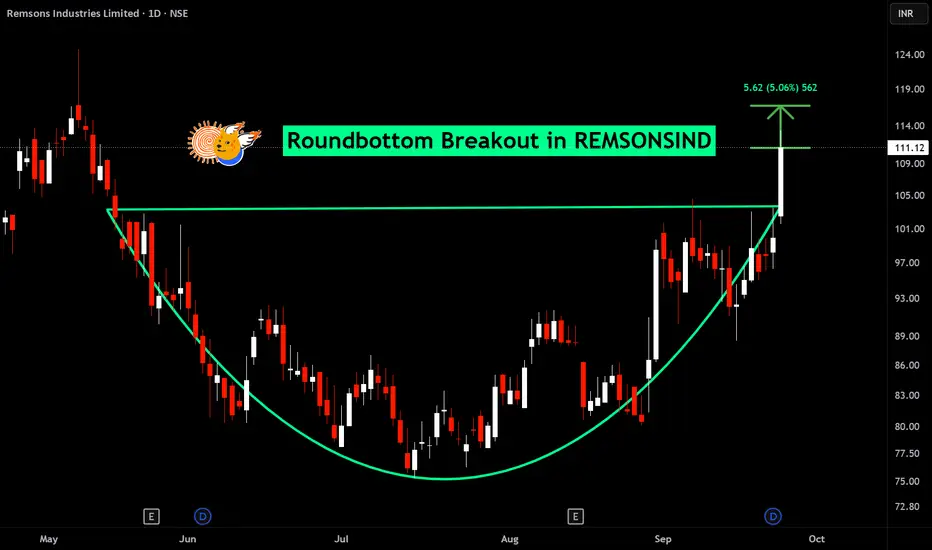
Round bottom breakout in REMSONSIND
BUY TODAY SELL TOMORROW for 5%
BUY TODAY SELL TOMORROW for 5%DON’T HAVE TIME TO MANAGE YOUR TRADES?
- Take BTST trades at 3:25 pm every day
- Try to exit by taking 4-7% profit of each trade
- SL can also be maintained as closing below the low of the breakout candle
Now, why do I prefer BTST over swing trades? The primary reason is that I have observed that 90% of the stocks give most of the movement in just 1-2 days and the rest of the time they either consolidate or fall
Ascending triangle breakout in BOSCH-HCIL
BUY TODAY SELL TOMORROW for 5%
BUY TODAY SELL TOMORROW for 5%DON’T HAVE TIME TO MANAGE YOUR TRADES?
- Take BTST trades at 3:25 pm every day
- Try to exit by taking 4-7% profit of each trade
- SL can also be maintained as closing below the low of the breakout candle
Now, why do I prefer BTST over swing trades? The primary reason is that I have observed that 90% of the stocks give most of the movement in just 1-2 days and the rest of the time they either consolidate or fall
Trendline breakout in PASHUPATI
BUY TODAY SELL TOMORROW for 5%
BUY TODAY SELL TOMORROW for 5%DON’T HAVE TIME TO MANAGE YOUR TRADES?
- Take BTST trades at 3:25 pm every day
- Try to exit by taking 4-7% profit of each trade
- SL can also be maintained as closing below the low of the breakout candle
Now, why do I prefer BTST over swing trades? The primary reason is that I have observed that 90% of the stocks give most of the movement in just 1-2 days and the rest of the time they either consolidate or fall
Resistance breakout in NINSYS
BUY TODAY SELL TOMORROW for 5%
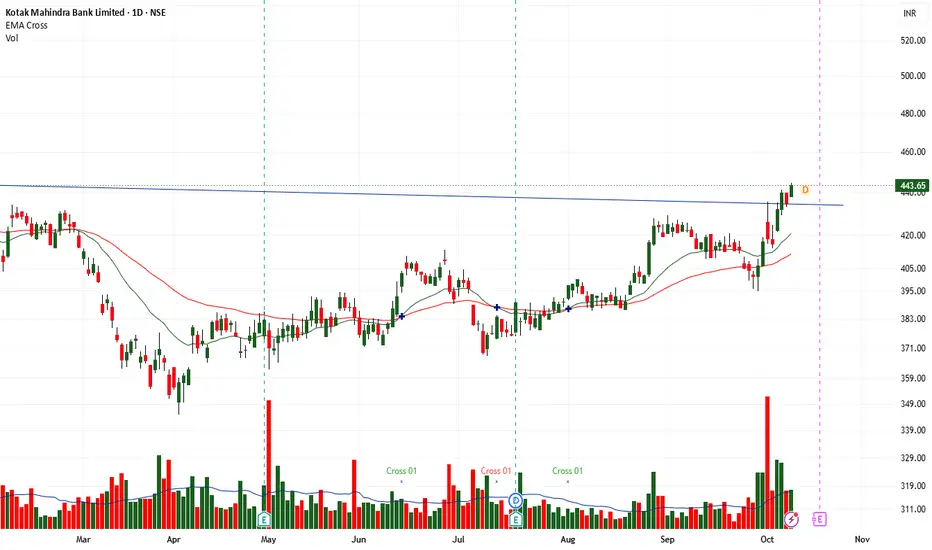
Breakout in Kotak BankKotak Bank has broken above a long-term descending trendline resistance, indicating a potential bullish breakout. 🚀
✅ Price breakout above trendline resistance
✅ Strong bullish candle with a volume spike
✅ Price trading above key moving averages
✅ SuperTrend indicating positive momentum
🎯 What to Watch: Sustained price action above the breakout zone around ₹435–₹445 could support further upside. Watch for a successful retest and follow-through before considering a trade.
⚠️ *Disclaime
TCS Stages Strong Recovery Following Q2 ResultsHighlights
TCS has rallied approximately 5% following its Q2 FY27 results announced on October 8, indicating renewed buying interest after a prolonged correction.
Immediate resistance is around ₹2,100–₹2,120. A sustained breakout above ₹2,120 could extend the recovery towards ₹2,180–₹2,200, followed by ₹2,250–₹2,300.
On the downside, ₹2,050–₹2,070 is the immediate support zone, while ₹2,000 remains the crucial medium-term support. Holding above these levels would strengthen the recovery st
Diego Nal formation in E wave of triangle in lower time frame. Elliott Wave Analysis:-
As we salsas in previous chart there is a triangle wave and in that triangle wave we can see the 5th wave or E wave is a diagonal wave appearing as of now. If it confirms then this was a dual conformation for the wave to upwards move.
Epack Prefab Tech cmp 256.35 Daily Chart since listedEpack Prefab Tech cmp 256.35 Daily Chart since listed
- Support Zone 220 to 250 price band
- Resistance Zone 265 to 300 price band
- Price trending along Rising Support Trendline
- Breakout been attempted from Resistance Trendline
- Volumes seen in good sync of average traded quantity
- Multiple Rounding Bottoms and/or repeat Cup and Handle
- Price rejection at Resistance needs heavy Volumes for fresh uptrend
Indiabulls Ltd (D): CONSOLIDATION BREAKOUTTimeframe: Daily | Chart Scale: Linear
Explosive +7.36% surge today backed by a massive 80.33M volume spike! 🔥
Technical Highlights:
✅ Breakout: Cleared & closed above short-term horizontal resistance, resolving a sideways trend active since Jun/Jul '26.
✅ Volume: Massive surging volume trend over the past few days confirms heavy buyer interest!
✅ Momentum: Short-term EMAs in positive crossover (Daily/Weekly/Monthly). MACD & RSI rising. 🚀
Key Levels to Watch:
🎯 Target 1: 4
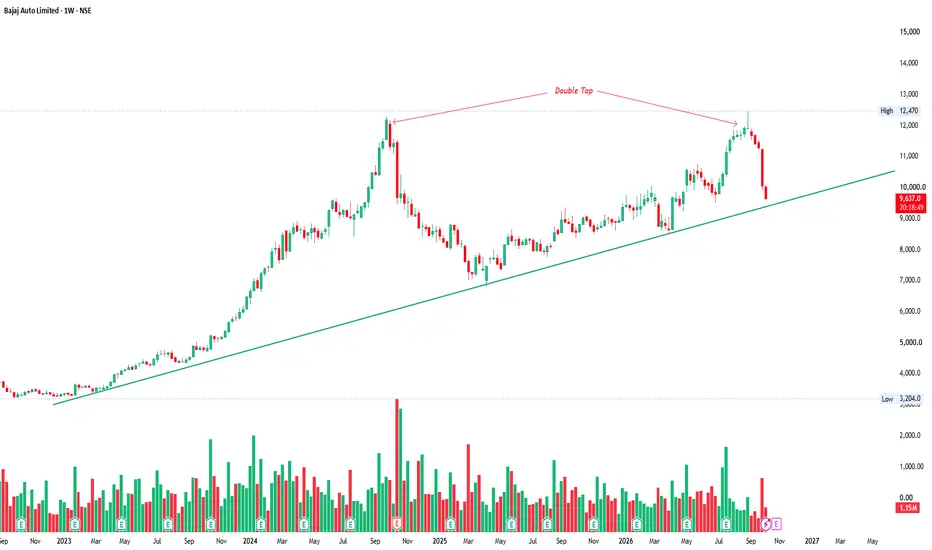
BAJAJ AUTO: From Double Top to Multi-Year TrendlineBajaj Auto is now approaching a critical technical zone after a sharp rejection from the ₹12,000–₹12,500 region, where the chart formed a clear double-top structure.
The rejection from this zone has triggered a strong correction, bringing price back toward ₹9,400.
🎯 Why ₹9,400 matters
₹9,400 is important for two reasons:
1️⃣ Horizontal support
It has acted as an important price area during the recent structure.
2️⃣ Long-term rising trendline
The stock is also approaching a multi-year ascendi
TVS MOTOR: Correction Within the Channel or Trend Breakdown?TVS Motor is trading within a well-defined ascending channel, and the recent correction is now bringing price closer to the lower boundary of the channel.
The key level I'm watching is ₹3,600.
This zone becomes important because it is close to the lower channel support and has the potential to act as a demand area.
🟢 If ₹3,600 holds
A strong rejection from this zone could keep the broader uptrend intact.
If buyers step in and price starts forming a reversal structure, the stock could move ba
Maruti Suzuki Is Approaching a 10-Year Trendline!!!!Maruti Suzuki is now approaching a major long-term rising trendline on the monthly chart.
This trendline has been developing for several years and has acted as an important structural support during previous major corrections.
After making an all-time high around ₹17,200, the stock has entered a sharp correction and is now trading around ₹11,200.
🎯 Key Zone: ₹11,400–₹11,500
This is the area I'm watching closely.
The important question isn't whether the stock reaches this level — it's how price
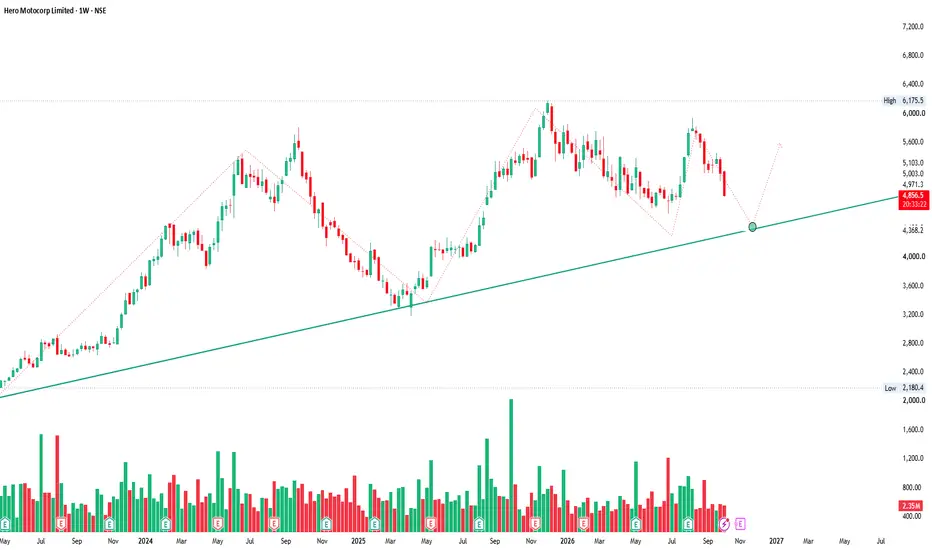
HERO MOTOCORP: ₹4,400 Is the Line in the SandHero MotoCorp is now approaching a very important technical zone on the weekly chart.
The stock has been respecting a long-term rising trendline since 2023, with multiple significant reactions from this trendline over the past few years.
After making a high around ₹6,175, the stock has entered a corrective phase and is now trading around ₹4,850.
The interesting part?
The long-term trendline is currently converging around the ₹4,400–₹4,500 zone.
That makes ₹4,400 a critical level to watch.
🔎
BUY TODAY SELL TOMORROW for 5%DON’T HAVE TIME TO MANAGE YOUR TRADES?
- Take BTST trades at 3:25 pm every day
- Try to exit by taking 4-7% profit of each trade
- SL can also be maintained as closing below the low of the breakout candle
Now, why do I prefer BTST over swing trades? The primary reason is that I have observed that 90% of the stocks give most of the movement in just 1-2 days and the rest of the time they either consolidate or fall
Resistance breakout in INDOKEM
BUY TODAY SELL TOMORROW for 5%
BUY TODAY SELL TOMORROW for 5%DON’T HAVE TIME TO MANAGE YOUR TRADES?
- Take BTST trades at 3:25 pm every day
- Try to exit by taking 4-7% profit of each trade
- SL can also be maintained as closing below the low of the breakout candle
Now, why do I prefer BTST over swing trades? The primary reason is that I have observed that 90% of the stocks give most of the movement in just 1-2 days and the rest of the time they either consolidate or fall
Trendline breakout in FINOPB
BUY TODAY SELL TOMORROW for 5%
#ICICIBANK SELL 📉 ICICI Bank: Wave C Leg Aiming for 1,150? 📊🔍
Clean flat corrective structure unfolding on higher timeframes 🧭⚡
🌊 Wave Count Breakdown
* 🅰️ Wave A: 1,500 peak (Jul 2025) ➡️ dropped to 1,187 (Mar 2026) in 3 clear waves (Flat signal) 🔻📉
* 🅱️ Wave B: Relief bounce locked high at 1,480 (Jul 2026) 🚀📈
* 🅲 Wave C: Impulse active now ➡️ retesting the cycle low ⚡🎯
🎯 Key Watch Levels
* 🧲 Downside Target: 1,150 key demand zone 🛑📉
* 🧱 Invalidation: Weekly close above 1,480 cancels the move ⚠️🛡️
🐻 Strat
#RELIANCE CORRECTION COMPLETE?📉 Reliance: Wave C Bottom Near? 📊🔍
Clean flat correction unfolding on higher timeframes 🧭⚡
🌊 Wave Count
* 🅰️ Wave A: 1,608 (Jul 2024) ➡️ low of 1,114 (Apr 2025) 🔻📉
* 🅱️ Wave B: Expanded bounce to 1,611 (Jan 2026) 🚀📈
* 🅲 Wave C: Active in 5 clear subwaves ⚡🎯
🎯 Key Rule & Levels
* 📐 Rule: Wave 5 length must NOT exceed Wave 3 🛑✅
* 🧱 Bottom Zone: If this holds, Wave C exhausts right here 💎🛡️
🧘♂️ Strategy: Wait & Watch 👀💼
* 🔪❌ No knife-catching
* 🐂🚀 Wait for reversal confirmation before going
KAVERI DEFENCE — SWING BREAKOUT SETUPKAVERI DEFENCE — SWING BREAKOUT SETUP
Entry, Stop Loss & Targets Are Clearly Defined — Helping You Plan Your Trade With Confidence.
📊 Stock Strength: 65/100
(Note: Higher score indicates stronger stock conditions, not guaranteed returns.)
A bullish breakout has appeared on the 1W timeframe with positive price action and strong volume expansion.
🔄 Trade Type: Swing Trade
────────────────────
🎯 TRADE LEVELS
ENTRY: ₹93
🛑 STOP LOSS
ATR SL: ₹79
🎯 TARGETS
T1: ₹103
T2: ₹116
T3: ₹131
─────────