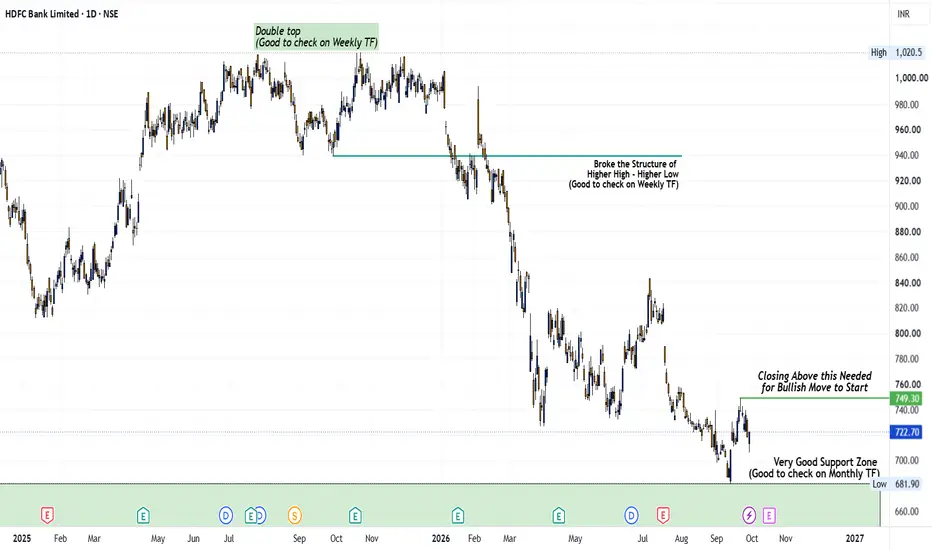
HDFC Bank at a major monthly support zone HDFC Bank (NSE: HDFCBANK) | CMP 722.70 | Positional view
The stock is about 29% below its 2025 high of 1,020.5 and is now sitting on a zone that has held three times in four years (2022, early 2024 and now).
MONTHLY
- Very good support zone at roughly 640 to 682.
- September monthly candle: open 705.05, high 749.30, low 681.90, close 722.70. Sellers pushed it below 700 but could not hold it.
WEEKLY
- Double top near 1,020, then the higher high - higher low structure broke in early 2026.
- No
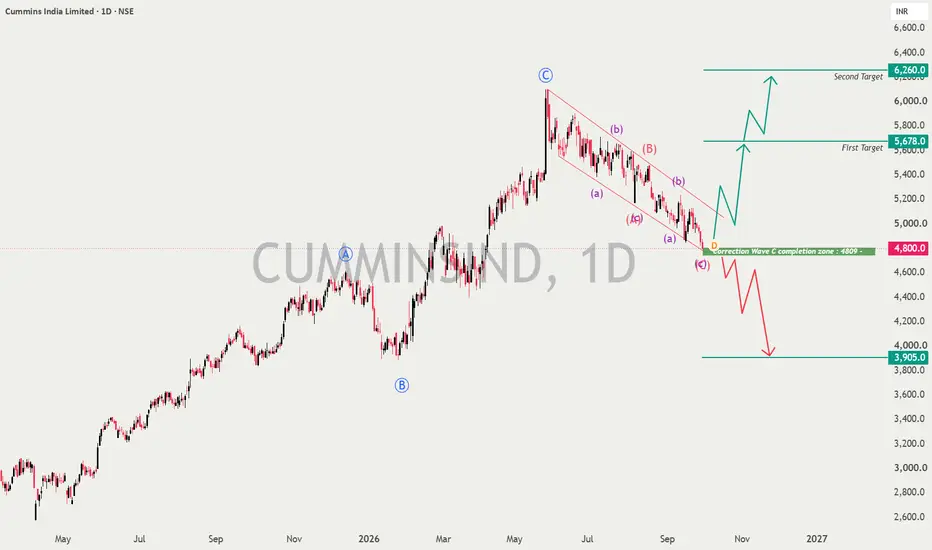
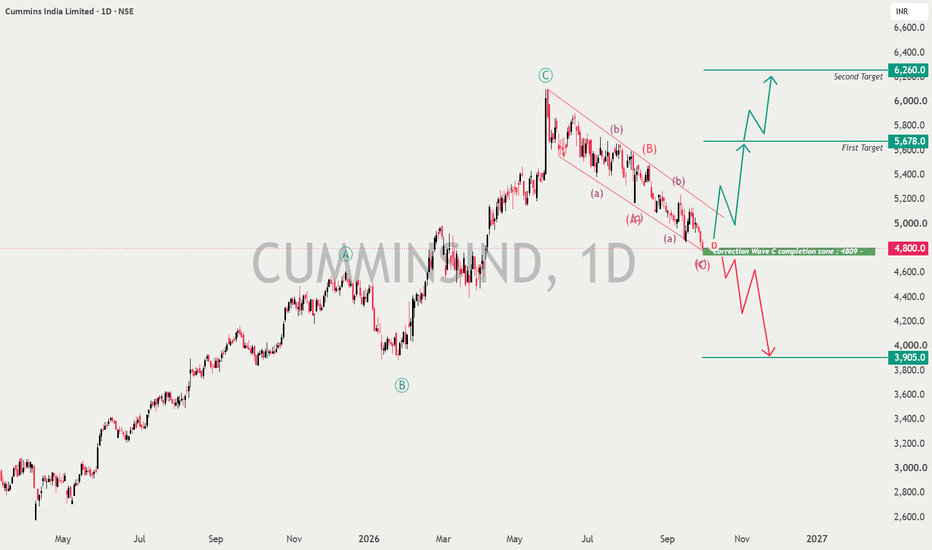
CUMMINSIND – CORRECTION AT A CRITICAL ZONETimeframe: 1D
CMP: ₹4,800
Structure: Elliott Wave + Descending Corrective Channel
Key Zone: ₹4,809 – ₹4,800
Cummins India is currently trading at a very important technical decision point. The stock has undergone a prolonged correction from the June high near ₹6,050 and is now approaching the lower end of its corrective structure.
The chart suggests that the ongoing decline may represent a larger Wave C correction , with price now entering the marked Wave C completion zone around ₹4,8
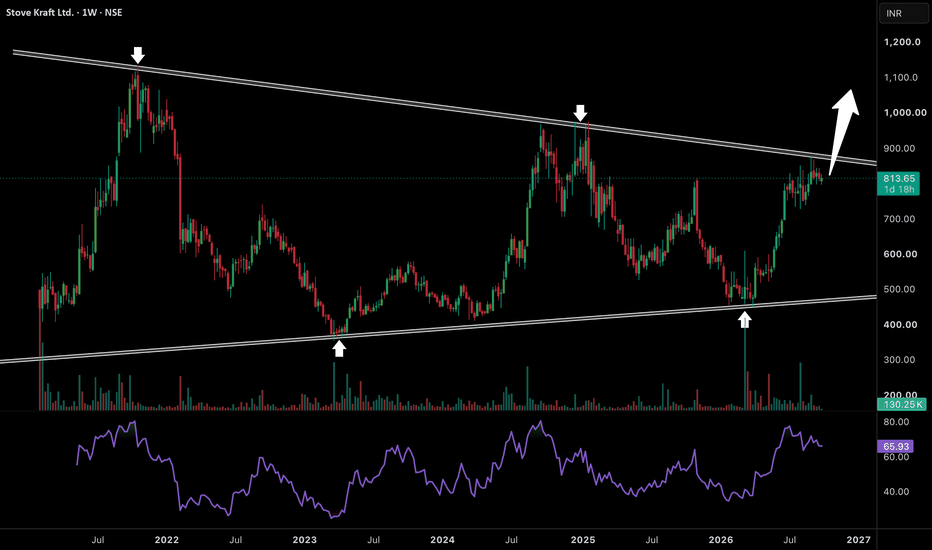
This Multi-Year Structure Is Getting Ready To ExpandStove Kraft has been moving inside this huge compression structure for years and price is now again approaching the upper falling trendline near 850-880. The important part is how strongly buyers defended the lower trendline around 450-500 and pushed price sharply higher from there. Since that reversal the stock has built strong momentum and is now sitting just below the same resistance zone that rejected price near 1100 in 2021 and again around 950 in 2024.
If price finally breaks this long te
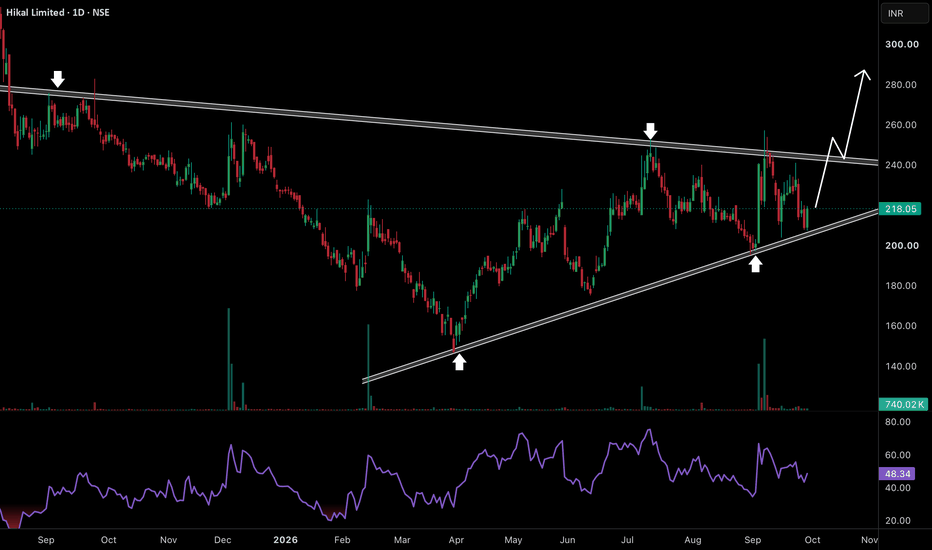
This Compression Is Getting Ready For ExpansionHikal is forming a clean symmetrical triangle after months of recovery from the April lows. Buyers are consistently defending the rising trendline near 200-210 while every rally is meeting the same falling resistance around 240-245. This is creating tighter price action and that usually means pressure is building inside the structure. The important part is that buyers are still holding the higher-low sequence and every dip near the lower trendline is getting absorbed.
A clean breakout above 240
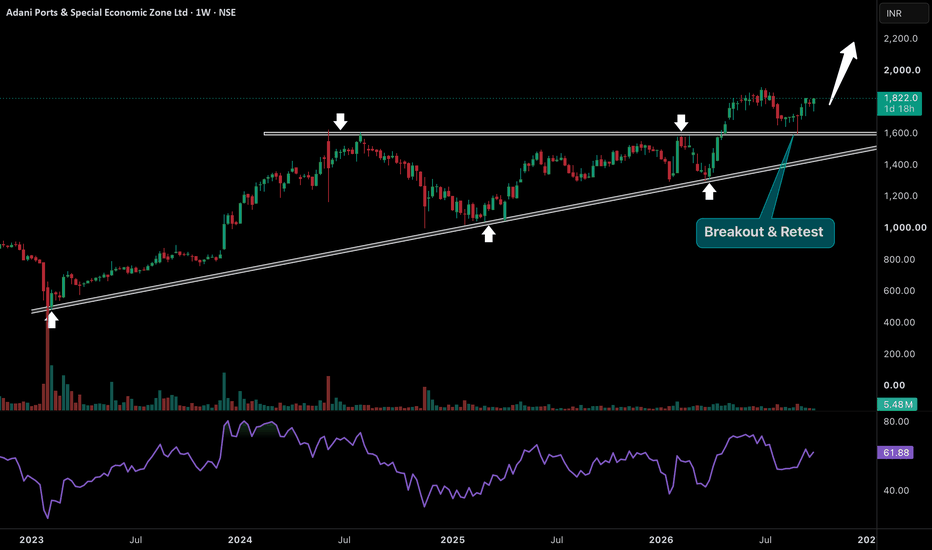
This Breakout Has Already Changed The StructureAdani Ports has already done the difficult part. Price spent almost two years struggling around the 1600 resistance zone but once that level was finally broken the move expanded quickly toward 1900. More importantly the recent pullback came back to the same breakout area and buyers defended it strongly. That old resistance is now acting like support which makes this retest very important and keeps the broader bullish structure intact.
As long as price continues to hold above the 1600 breakout z
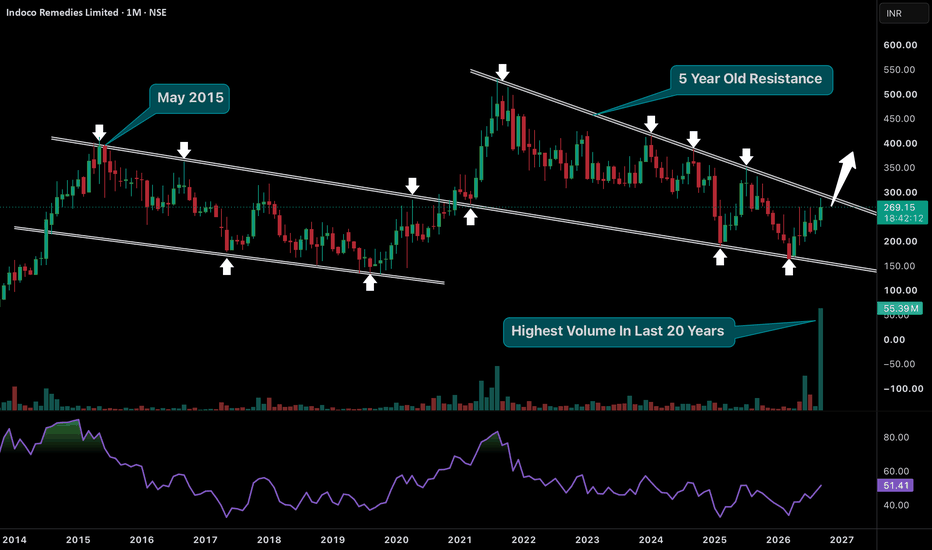
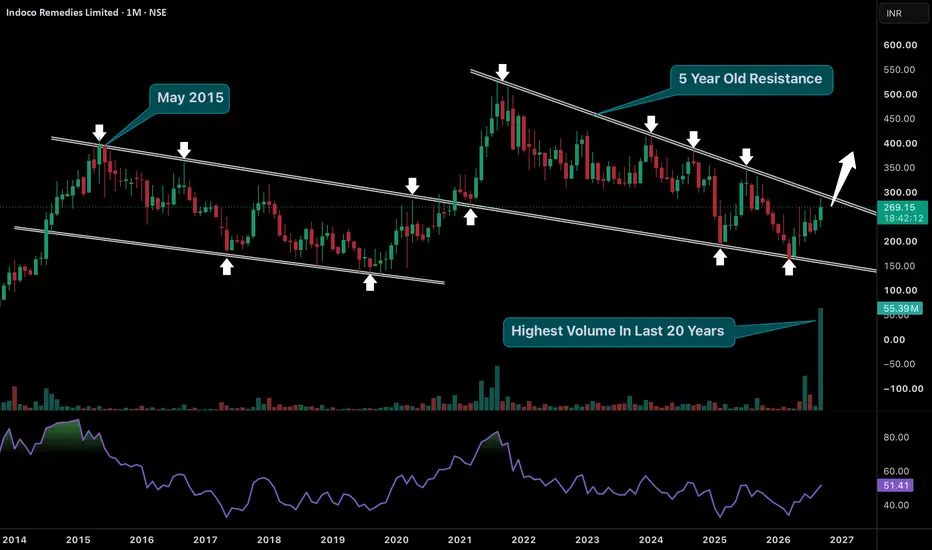
Something Big Is Waking Up After Years Of PressureIndoco Remedies is sitting at a very important point on the monthly chart. Price has respected this long term falling structure for years and now it is again testing the 5 year old resistance near 270-280 after taking a strong reversal from the lower trendline support. What makes this move more interesting is the volume. This month is showing the highest volume seen in almost 20 years which tells us participation has changed completely. Buyers are entering aggressively near a level where sellers
Azad Engineering Ltd. (1W) – Breakout Confirmed📈 Azad Engineering Ltd. (1W) – Breakout Confirmed, Eyes on the Next Expansion 🚀
Azad Engineering has delivered a powerful breakout after a prolonged consolidation, signaling renewed bullish momentum. The stock has reclaimed key resistance levels and is now attempting to continue its upward trajectory, making it one of the charts worth tracking closely. 👀
🔍 Technical Highlights
✅ Breakout Above Major Resistance:
The stock has decisively moved above the ₹2,080 resistance zone, which had capped
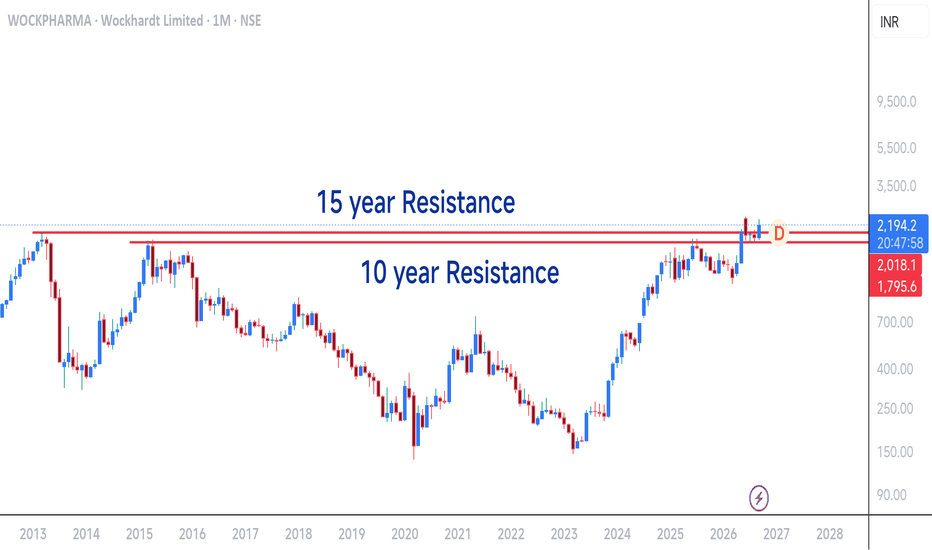
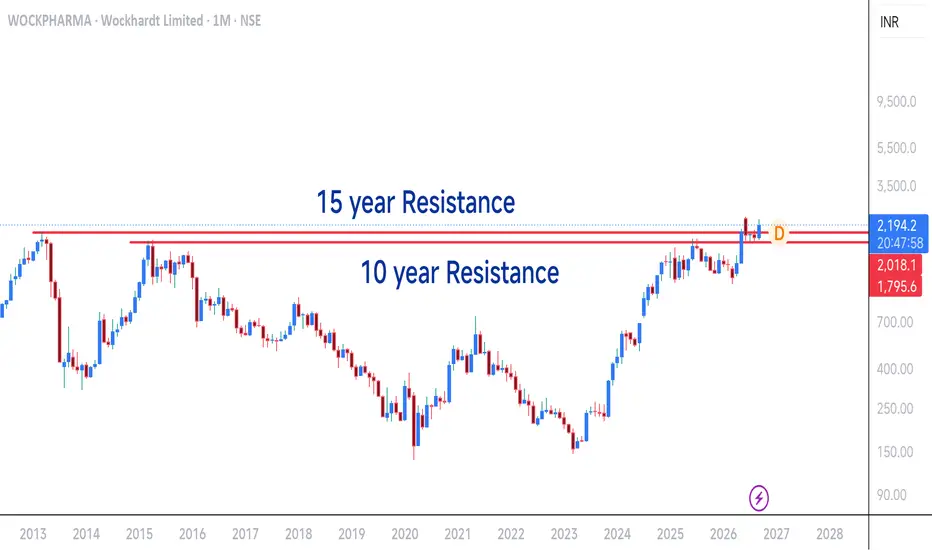
Wockhardt – Monthly | 15 Year Resistance Broken. Price Discovery
Two major resistance levels that held for over a decade have been broken on the monthly chart with massive volume confirmation.
10 year resistance: ₹1710 ✅ broken
15 year resistance: ₹1881 ✅ broken
CMP: ₹2189
No historical resistance visible above current price. Stock is in uncharted territory.
Key level to watch on pullback: ₹1881 — former 15 year resistance should now act as support.
Not a tip. DYOR.
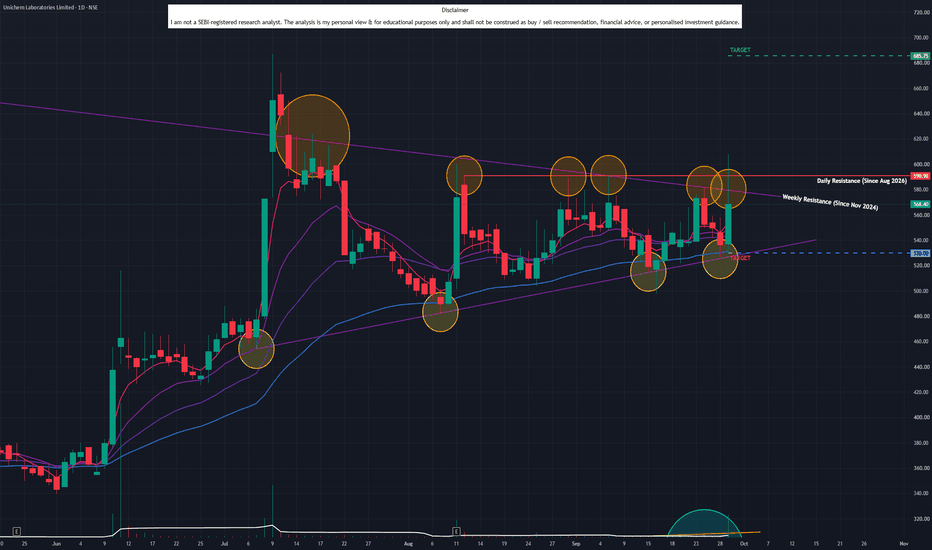
Unichem Laboratories (D): MASSIVE RESISTANCE TESTTimeframe: Daily | Chart Scale: Linear
Strong +5.97% surge today backed by a sudden 4.13M volume spike! 🔥
Technical Highlights:
⚠️ Dual Breakout Attempt: Pushed above an angular resistance (Nov '24) AND a horizontal resistance (Aug '26) intraday, but couldn't secure the close.
✅ Volume Reversal: Sudden volume spike breaking a recent "dry volume" trend.
✅ Momentum: Short-term EMAs in positive crossover (Daily/Weekly/Monthly). MACD & RSI rising. 🚀
Key Levels to Watch:
🎯 Targ
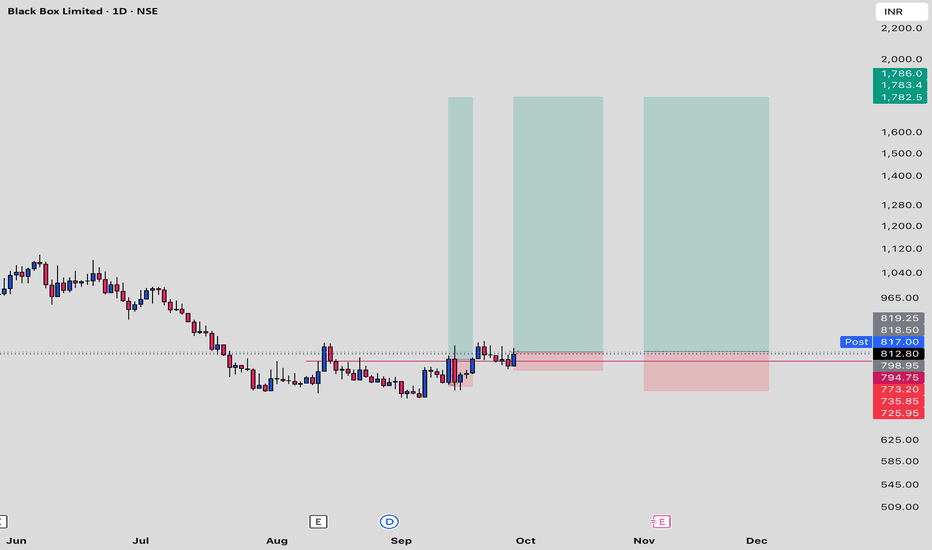
BBOX daily chart updateBlack Box Limited (BBOX) daily chart update 📊 Powerful +4.5% surge today to ₹818.40 🔥 Price is breaking out of a multi-month consolidation base with strong momentum. Structure looking constructive after the long correction from June highs. Higher lows forming nicely ✅ Watching for sustained hold above ₹810–818 zone for further upside ⚡👀 Risk remains below recent swing supports. Who’s on this one? Drop your views & levels 👇 #BlackBox #BBOX #NSE #StockMarket #TechnicalAnalysis #IndianStocks
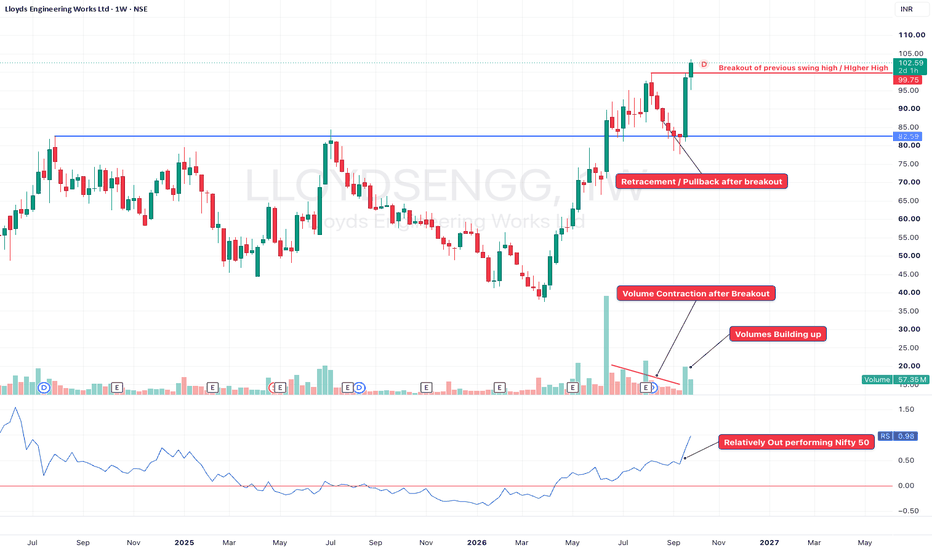
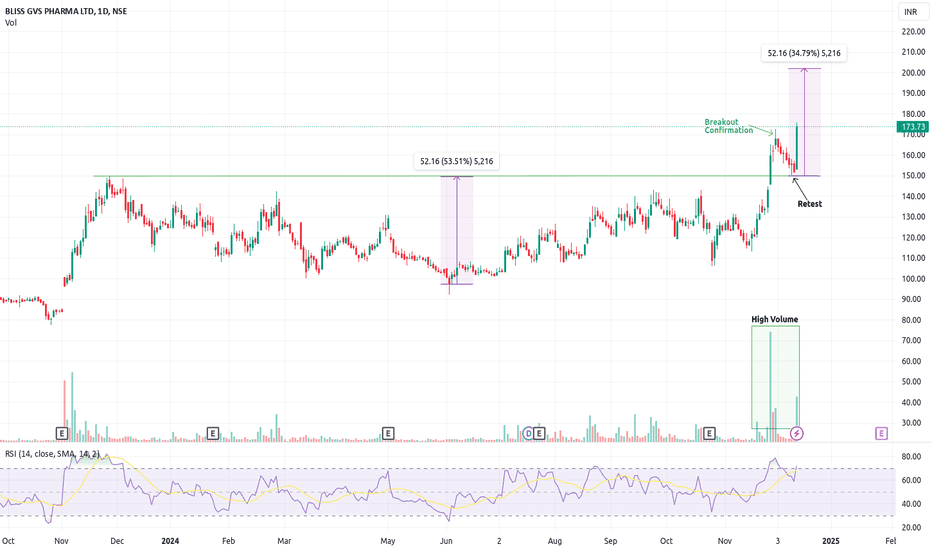
LLOYDSENGG All time High Breakout #LLOYDSENGG 🔥
**A clean example of a Breakout → Retracement → Continuation setup!**
One of the patterns I like watching after a breakout is how the stock behaves during the **first pullback**.
In LLOYDSENGG, the structure was quite interesting:
📌 **Step 1 – Breakout**
Price moved above an important resistance zone, indicating that buyers were willing to push the stock into a new price range.
📌 **Step 2 – Small Retracement**
Instead of immediately falling back into the previous range, th
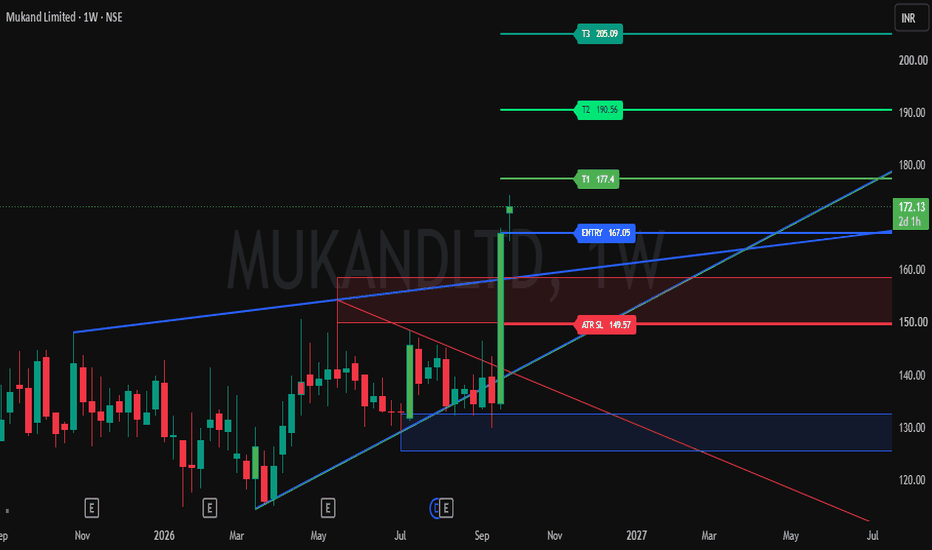
MUKANDLTD — SWING BREAKOUT SETUPMUKANDLTD — SWING BREAKOUT SETUP
Entry, Stop Loss & Targets Are Clearly Defined — Helping You Plan Your Trade With Confidence.
📊 Stock Strength: 70/100
(Note: Higher score indicates stronger stock conditions, not guaranteed returns.)
A bullish breakout has appeared with positive price action and strong volume expansion.
🔄 Trade Type: Swing Trade
────────────────────
🎯 TRADE LEVELS
ENTRY: ₹167
🛑 STOP LOSS
ATR SL: ₹150
🎯 TARGETS
T1: ₹177
T2: ₹191
T3: ₹205
────────────────────
📈 VOLUME
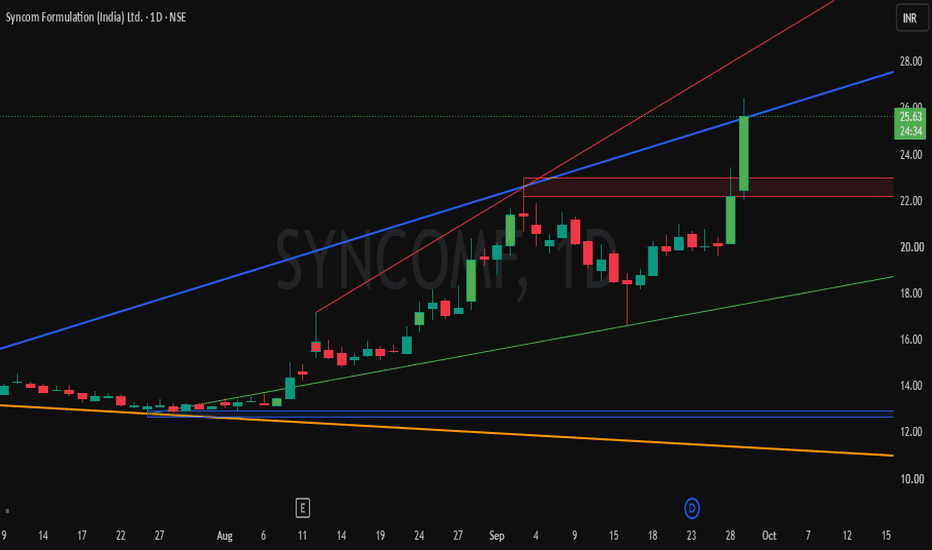
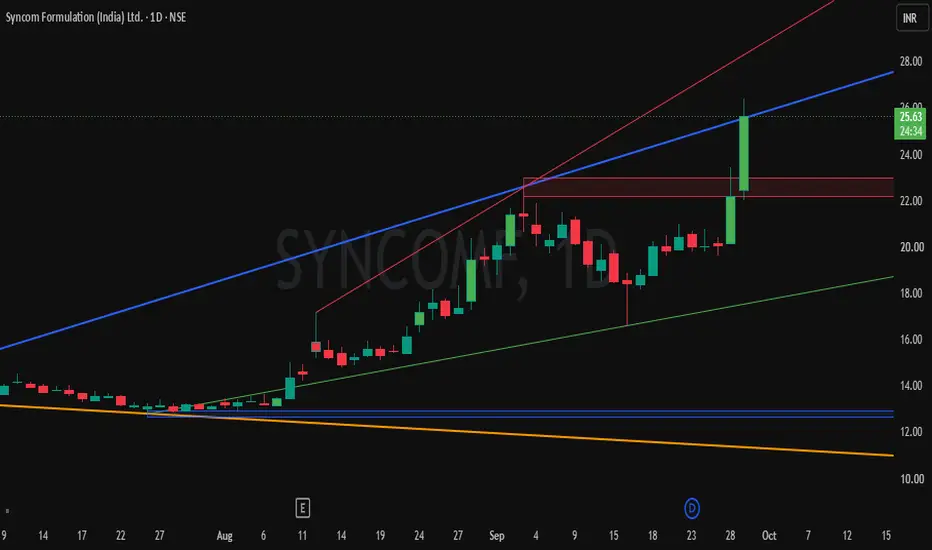
Buy Today, Sell Tomorrow for 3–5% – Daily Breakout SetupSYNCOMF — BTST BREAKOUT SETUP
Entry, Stop Loss & Targets Are Clearly Defined — Helping You Plan Your Trade With Confidence.
📊 Stock Strength: 75/100
(Note: Higher score indicates stronger stock conditions, not guaranteed returns.)
A bullish breakout has appeared with positive price action and strong volume expansion.
🔄 Trade Type: BTST
────────────────────
🎯 TRADE LEVELS
ENTRY: ₹26
🛑 STOP LOSS
ATR SL: ₹23
🎯 TARGETS
BTST Target: 3–5%
────────────────────
📈 VOLUME
20D Volume: 862%
1D V
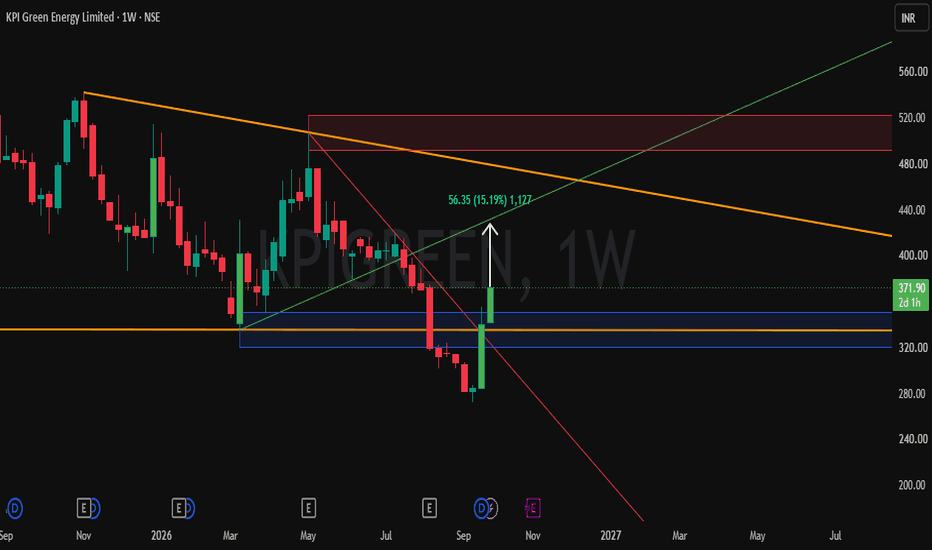
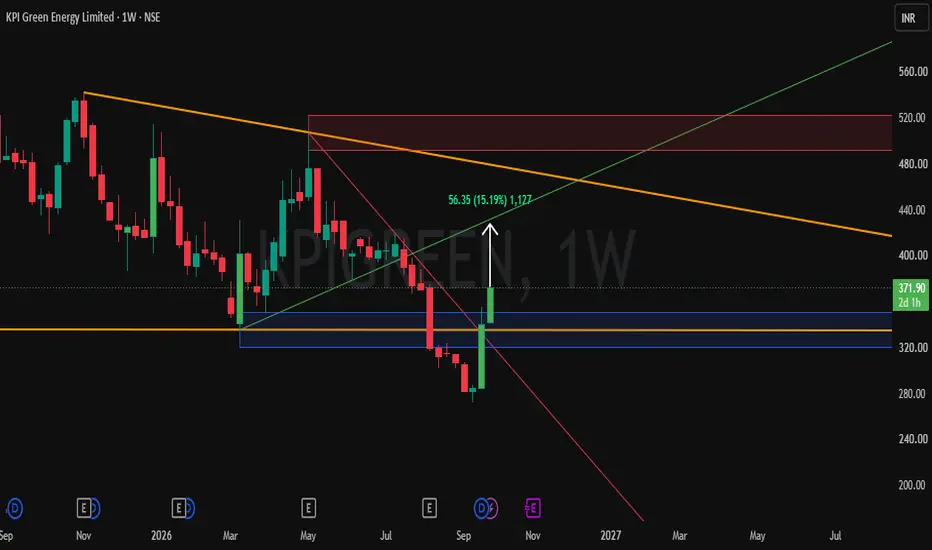
KPI GREEN ENERGY — WEEKLY BREAKOUT SETUPKPIGREEN — WEEKLY BREAKOUT SETUP
Entry, Stop Loss & Target Are Clearly Defined — Helping You Plan Your Trade With Confidence.
🔄 Trade Type: Swing Trade — Weekly Setup
────────────────────
🎯 TRADE LEVELS
ENTRY: ₹376
🛑 STOP LOSS
SL: ₹335
🎯 TARGET
Target: ₹432
Target Potential: 15%
────────────────────
⏱ Timeframe: 1 Week
📌 Trade Entry: Take the trade only after the weekly breakout is confirmed.
The position can be held for a weekly swing move if the trend remains strong.
The setup is b
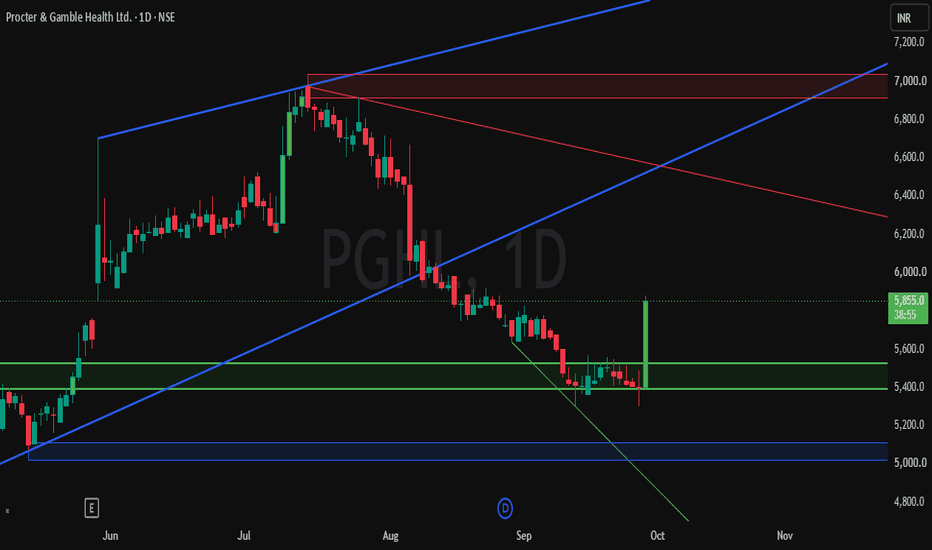
Buy Today, Sell Tomorrow for 3–5% – Daily Breakout SetupPGHL — BTST BREAKOUT SETUP
Entry, Stop Loss & Targets Are Clearly Defined — Helping You Plan Your Trade With Confidence.
📊 Stock Strength: 69/100
(Note: Higher score indicates stronger stock conditions, not guaranteed returns.)
A bullish breakout has appeared with positive price action and strong volume expansion.
🔄 Trade Type: BTST
────────────────────
🎯 TRADE LEVELS
ENTRY: ₹5,857
🛑 STOP LOSS
ATR SL: ₹5,633
🎯 TARGETS
BTST Target: 3–5%
────────────────────
📈 VOLUME
20D Volume: 575%
1
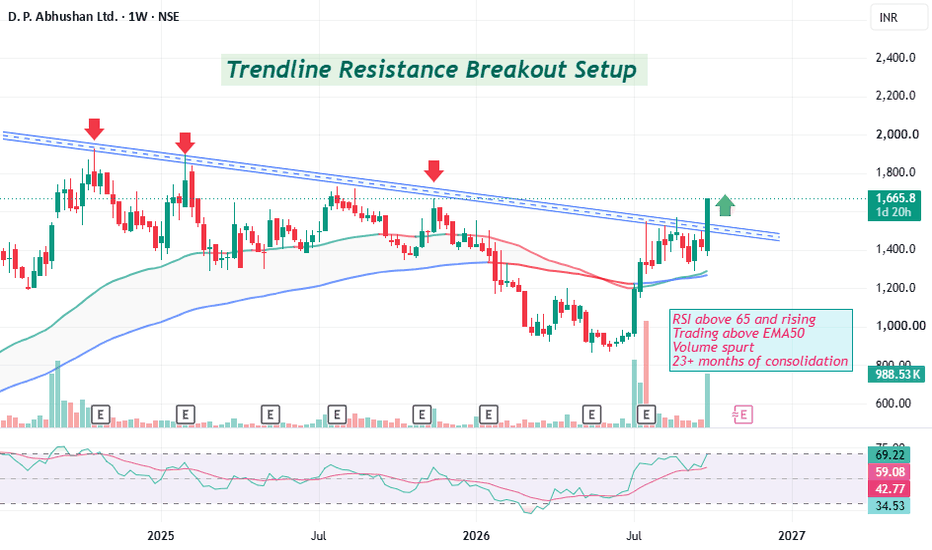
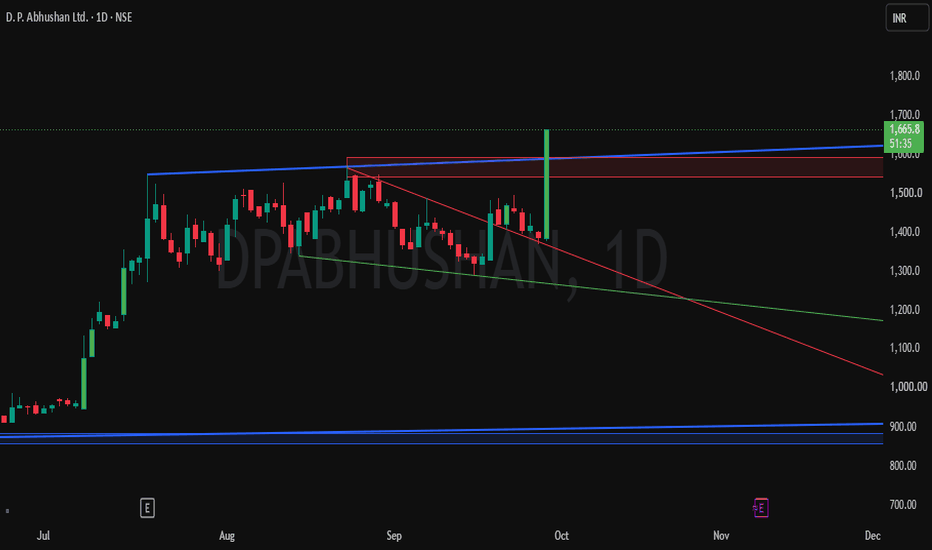
Buy Today, Sell Tomorrow for 3–5% – Daily Breakout SetupDPABHUSHAN — BTST BREAKOUT SETUP
Entry, Stop Loss & Targets Are Clearly Defined — Helping You Plan Your Trade With Confidence.
📊 Stock Strength: 75/100
(Note: Higher score indicates stronger stock conditions, not guaranteed returns.)
A bullish breakout has appeared with positive price action and strong volume expansion.
🔄 Trade Type: BTST
────────────────────
🎯 TRADE LEVELS
ENTRY: ₹1,666
🛑 STOP LOSS
ATR SL: ₹1,549
🎯 TARGETS
BTST Target: 3–5%
────────────────────
📈 VOLUME
20D Volume:
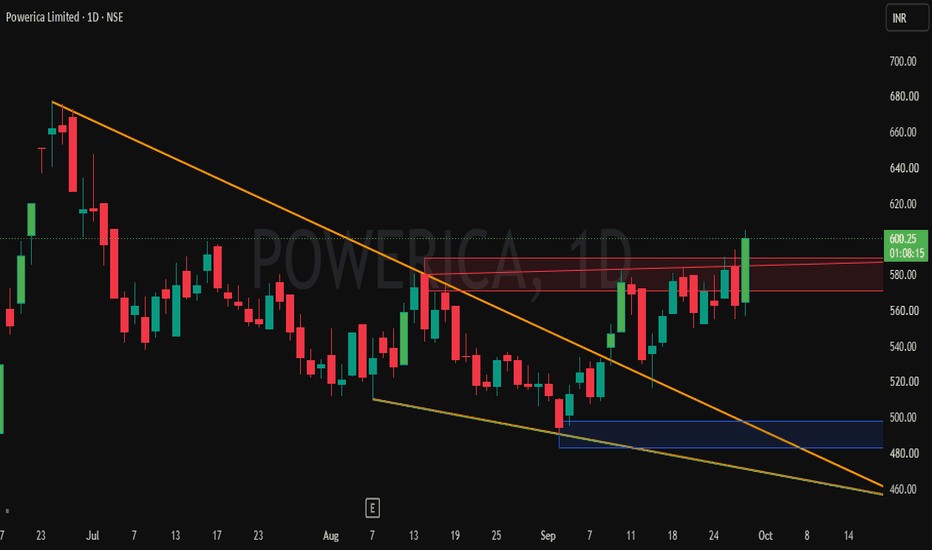
Daily Breakout Swing Trading SetupPOWERICA LIMITED — SWING BREAKOUT SETUP
Entry, Stop Loss & Targets Are Clearly Defined — Helping You Plan Your Trade With Confidence.
📊 Stock Strength: 72/100
(Note: Higher score indicates stronger stock conditions, not guaranteed returns.)
A bullish breakout has appeared on the 1D timeframe with positive price action and strong volume expansion.
🔄 Trade Type: SWING
────────────────────
🎯 TRADE LEVELS
ENTRY: ₹599
🛑 STOP LOSS
ATR SL: ₹558
🎯 TARGETS
T1: ₹629
T2: ₹666
T3: ₹708
───────────
SMSPHARMA Multi-Month Resistance Breakout on Weekly TimeframeSMS Pharmaceuticals Limited has demonstrated a strong bullish market structure on the weekly timeframe.
After an extended period of upward momentum, the price has successfully broken out and closed above a critical multi-month resistance zone marked at 431.70.
The recent bullish candles are accompanied by significant volume spikes, validating the strength of the breakout and indicating strong institutional or market interest.
The previous swing resistance around 387.10 was successfully flippe
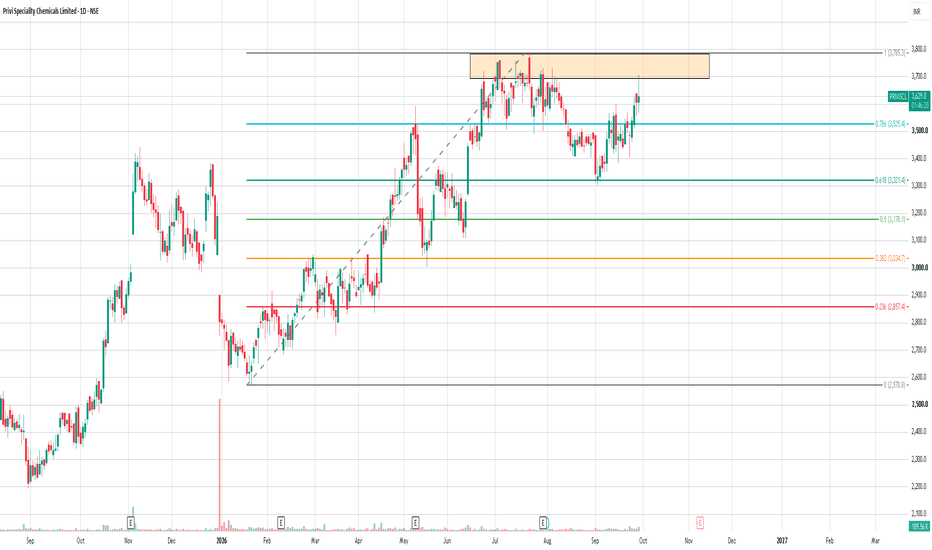
Privi Specialty Chemicals — Weekly Fibonacci AnalysisThe stock has maintained a strong recovery structure after finding support near the lower Fibonacci zones. Price has moved back above the 0.618 Fib at ₹3,321 and has now reclaimed the important 0.786 Fib at ₹3,525, indicating improving bullish momentum.
However, price is now approaching a major supply/resistance zone between ₹3,700–₹3,785, which also aligns with the 1.0 Fibonacci level at ₹3,785. This is the key area to watch.
🔼 Bullish scenario:
A strong weekly close above ₹3,785, follo