MOLD-TEK PACKAGING – Approaching a Major Trendline Breakout!📈 MOLD-TEK PACKAGING – Approaching a Major Trendline Breakout! Is a Bigger Recovery Ahead?
━━━━━━━━━━━━━━━━━━━━
🏢 COMPANY OVERVIEW & BUSINESS THEME
━━━━━━━━━━━━━━━━━━━━
Mold-Tek Packaging Ltd. is an Indian manufacturer of rigid plastic packaging solutions, catering to several industries, including Paints, Lubricants, Food, FMCG and Pharmaceuticals.
The company specialises in injection-moulded packaging and In-Mould Labelling (IML) technology, which integrates product labels directly into plas
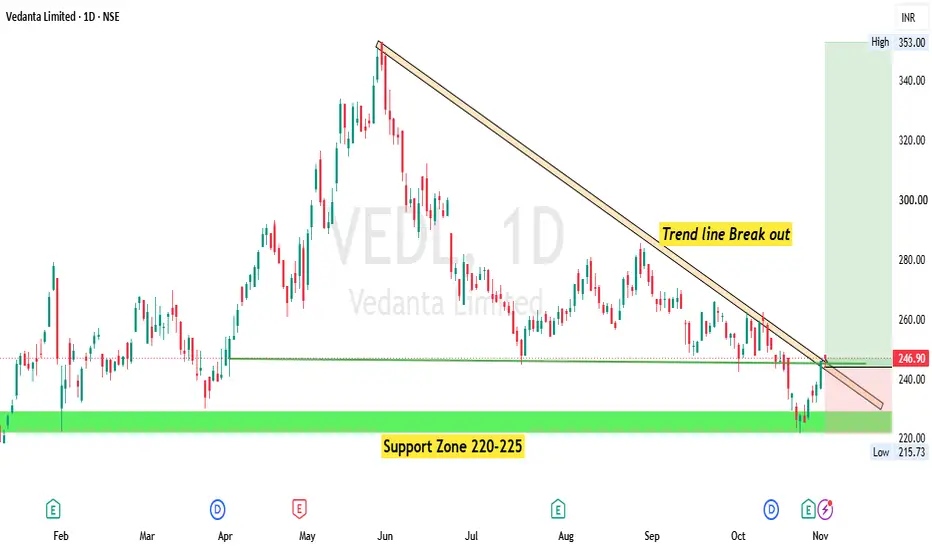
VEDANTA – Major Downtrend Line Breakout Attempt|Support ZoneVEDANTA (NSE: VEDL)
Vedanta is approaching a crucial technical breakout zone after a prolonged downtrend.
🔹 Major Support:₹220–225
🔹 Immediate Support: ₹240–243
🔹 Breakout Zone: ₹247–250
🔹 Upside Resistance: ₹260–265, ₹280, ₹300
A sustained breakout above the descending trendline with strong volume may indicate a potential trend reversal.
Key Observation: Watch for a decisive daily candle close above ₹250 for confirmation.
Disclaimer: For educational purposes only. Not a buy/sell rec
Buyers Are Defending The Trend Before The Next Big RallyThe stock is showing a strong bullish reversal from its long-term rising channel support near 11500–11700. This is the same trendline that has supported multiple major recoveries throughout the past year. After correcting from its recent highs near 14500 the stock has once again attracted buyers at the lower boundary and recovered towards 12188. What makes this setup interesting is that the broader uptrend remains intact despite the recent correction. The daily RSI is also showing early signs of
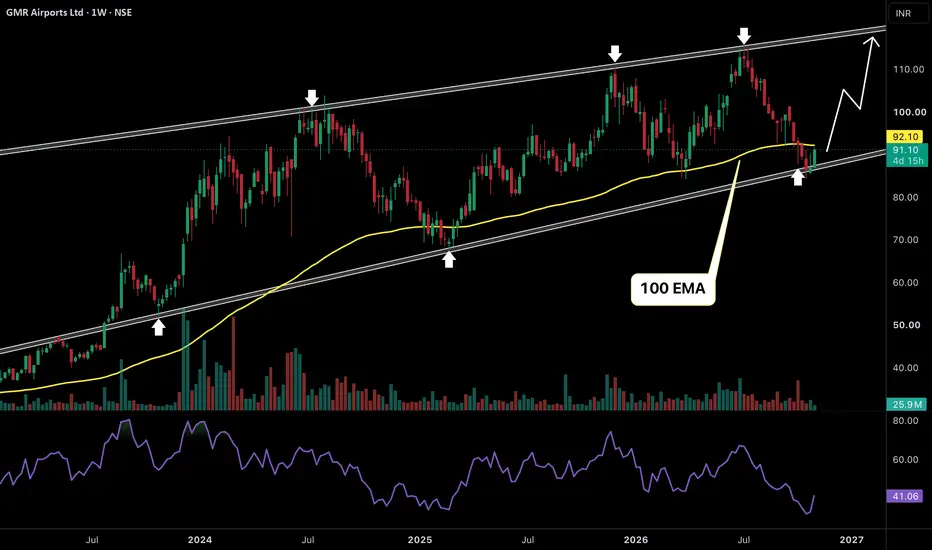
GMR Airports: Buyers Are Defending The Next Big Rally ZoneGMR Airports is showing a strong bullish reversal setup on the weekly chart after correcting from its recent highs near 115. The stock has now reached its long-term rising support trendline around 85–88 which has triggered multiple major recoveries since 2023. What makes this setup interesting is that buyers are once again defending this important zone while the weekly RSI is recovering from near oversold levels. The stock is also trading close to its 100 EMA around 92 which makes the current ar
ITC: One Breakout Can End The Sellers’ DominanceITC is showing a strong bullish reversal setup after spending several months inside a falling channel. The stock is now attempting to break above its long-term descending resistance trendline near 270–275 where the 100 EMA is also acting as a major hurdle. What makes this setup interesting is the recent recovery from the 255–260 support zone followed by improving buying momentum. The daily RSI has climbed above 62 which suggests buyers are gaining strength and sellers are gradually losing contro
Balu Forge: Sellers Are Losing Control Of This Big StructureThe stock is showing a promising bullish reversal from its long-term rising support trendline near 420–440. The stock has been consolidating inside a massive symmetrical triangle for more than two years with sellers repeatedly defending the falling resistance while buyers continue to protect the lower trendline. The latest recovery towards 487 suggests that demand is returning after another successful support test. The daily RSI has also recovered above 50 which indicates improving bullish momen
JK Cement Is Building Pressure For A Powerful RallyJK Cement is showing a strong bullish setup on the weekly chart as price approaches the final stage of a large symmetrical triangle. After correcting from its highs near 7200 the stock has been forming lower highs while consistently defending its long-term rising support trendline. What makes this structure interesting is the additional support from the weekly 200 EMA near 4650. Buyers have repeatedly protected this zone and price is now recovering towards 5085. The tightening structure suggests
Prestige Estates Is Building Pressure For A Massive BreakoutThe stock is showing a promising bullish structure on the weekly chart with buyers consistently defending the long-term rising support trendline. The stock has been consolidating inside a large symmetrical triangle since its previous highs near 2100 and every major correction towards the lower trendline has attracted strong buying. After recovering from the 1150 support zone price is once again building momentum near 1537. The weekly RSI has also recovered above 50 which suggests that buyers ar
Corona Remedies Is Ready To Enter A New Bullish PhaseCorona Remedies is showing excellent bullish strength on the daily chart after consistently respecting its long-term rising support trendline. The stock has been forming higher lows and buyers have repeatedly stepped in during corrections which clearly shows strong demand. After recovering from the 1950–2000 support zone price has now reached the crucial 2270–2290 resistance area where previous rallies faced selling pressure. What makes this setup interesting is the strong recovery in RSI toward
Buyers Are Defending Every Dip Before A Major Breakout360 ONE WAM is showing a strong bullish reversal from its long-term rising support trendline near 980–1000. This support has been respected multiple times since 2024 and buyers have once again stepped in aggressively to defend it. The stock is also forming a large symmetrical triangle where the falling resistance trendline has repeatedly rejected price near 1200–1300. What makes this setup interesting is that every major correction is finding support at progressively higher levels which suggests
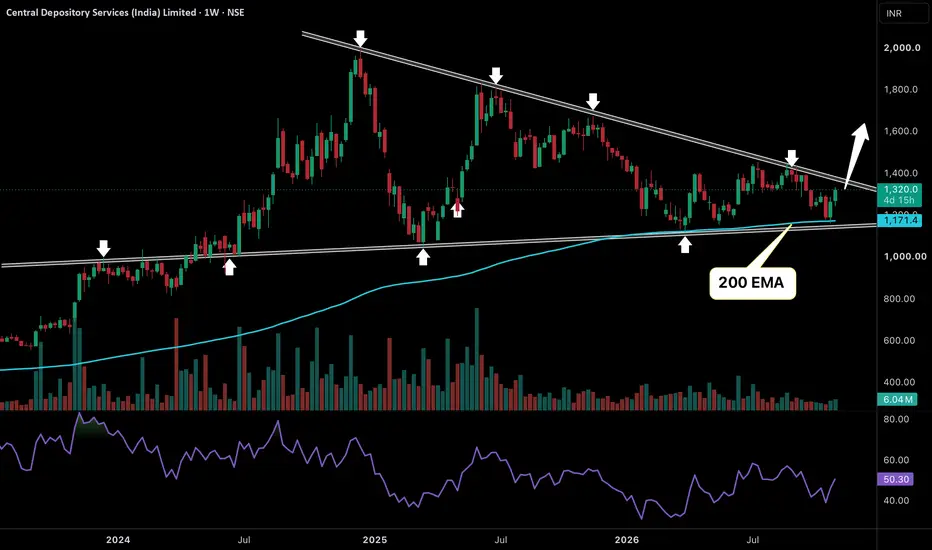
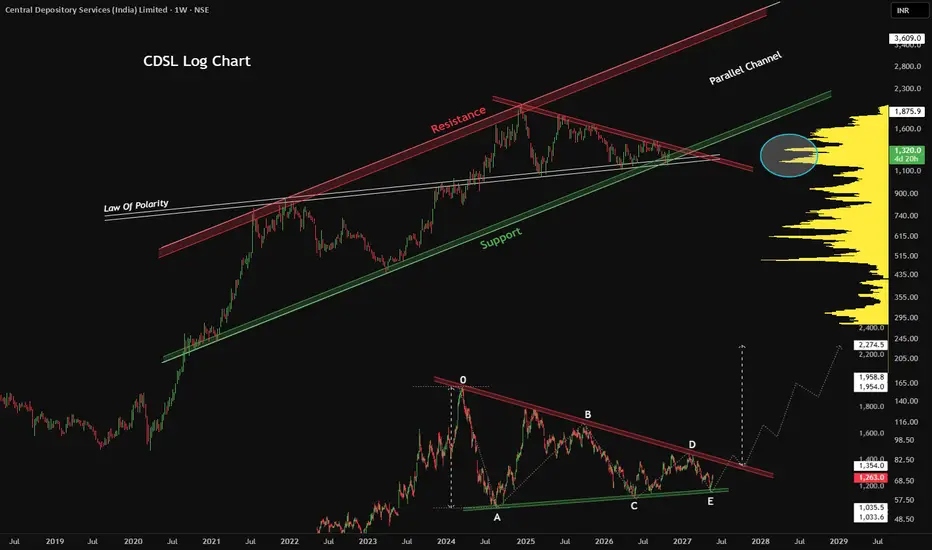
CDSL: Buyers Are Preparing To Break The Sellers’ GripCDSL is showing a strong bullish reversal from its long-term rising support trendline and the weekly 200 EMA near 1170. This zone has supported multiple major recoveries in the past and buyers have once again defended it aggressively. The stock has bounced towards 1320 and is now approaching the falling resistance trendline that has controlled every major rally since 2024. What makes this setup interesting is that sellers are repeatedly failing to break the support while buyers are slowly buildi
Sellers Are Losing Their Grip On NESCO’s DowntrendNESCO is showing a strong bullish reversal from its long-term falling support trendline near 930–950. This support has already triggered a major recovery in the past and buyers are once again stepping in aggressively. The stock has recovered towards 1037 and is now challenging the falling resistance trendline that has rejected every major rally since September 2025. What makes this setup interesting is that sellers are repeatedly failing to push price below the lower support while the RSI has re
BUY TODAY SELL TOMORROW for 5%DON’T HAVE TIME TO MANAGE YOUR TRADES?
- Take BTST trades at 3:25 pm every day
- Try to exit by taking 4-7% profit of each trade
- SL can also be maintained as closing below the low of the breakout candle
Now, why do I prefer BTST over swing trades? The primary reason is that I have observed that 90% of the stocks give most of the movement in just 1-2 days and the rest of the time they either consolidate or fall
Cup and handle breakout in NELCAST
BUY TODAY SELL TOMORROW for 5%
NSE – IPO Breakout SetupTrade Type: Swing Trading – Bullish Breakout
***Entry Strategy
Resistance: ₹1,804–₹1,805
Entry: Above ₹1,815+ after breakout confirmation.
Prefer a strong daily candle close above resistance with volume expansion.
Avoid entry if price makes a false breakout and closes below resistance.
****Stop Loss
Initial SL: ₹1,760 (below EMA support zone).
Risk per share: Approximately ₹55.
****Targets
T1: ₹1,880 – Previous swing high; book partial profit.
T2: ₹1,925 – Approximately 2R.
T3: ₹1,98
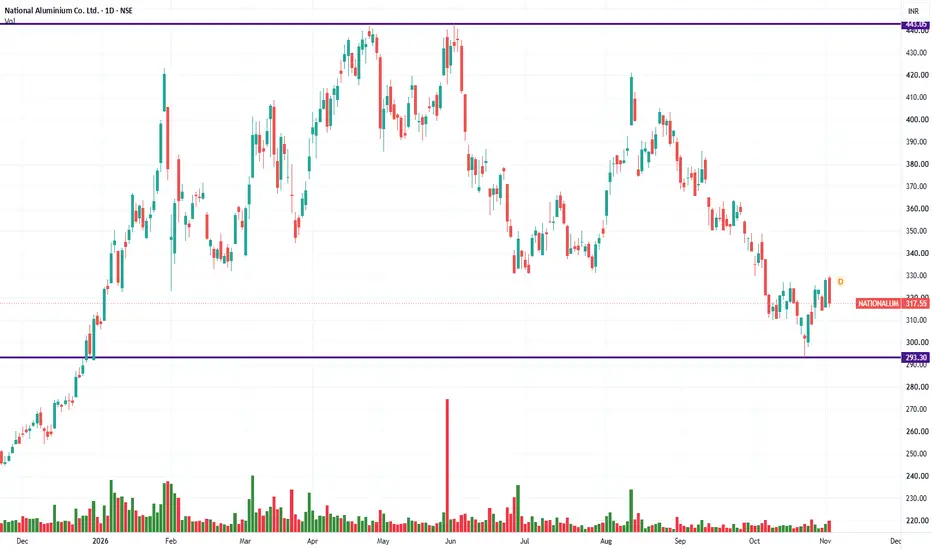
NALCO Q2 RESULTS: PROFIT JUMPS 28% YoY Can the Momentum Continue🚀NALCO Q2 FY27 RESULTS: PROFIT JUMPS 28% YoY! Can the Momentum Continue?
National Aluminium Company Ltd. (NALCO) has delivered a strong performance in Q2 FY27, backed by higher alumina realisations, robust aluminium production and improved year-on-year profitability.
However, rising input costs and a sequential decline in margins remain important factors to watch.
📊 Q2 FY27: Key Financial Highlights
In Q2 FY27, NALCO reported revenue of ₹5,419 crore, registering a year-on-year growth of
A Simple Strategy to Build Your Trading Edge Before 2027Apoorv Dubey | SEBI Registered Research Analyst
Many traders are experiencing losses in this market, while others who follow a tested strategy may be having a strong year. What often makes the difference is having a process—and the discipline to follow it.
In this educational video, I use the Trident chart as an illustration to explain a simple price action strategy and how to think about building an edge. The focus is on the strategy, rather than an analysis of the company.
For educational p
Bullish Setup in CDSL𝗙𝘂𝘁𝘂𝗿𝗲 𝗦𝗲𝗴𝗺𝗲𝗻𝘁 𝗦𝘁𝗼𝗰𝗸
𝗖𝗗𝗦𝗟: 𝗕𝘂𝗹𝗹𝗶𝘀𝗵 𝗧𝗲𝗰𝗵𝗻𝗶𝗰𝗮𝗹 𝗦𝗲𝘁𝘂𝗽 𝗪𝗶𝘁𝗵 𝗦𝘁𝗿𝗼𝗻𝗴 𝗙𝘂𝗻𝗱𝗮𝗺𝗲𝗻𝘁𝗮𝗹𝘀
Every time investors buy or sell shares in the Indian stock market, a critical piece of infrastructure works behind the scenes – the depository system.
CDSL (Central Depository Services India Ltd.) is one of India's two major securities depositories, providing electronic demat and securities-related services to millions of investors.
𝗡𝗼𝘄, 𝗹𝗲𝘁'𝘀 𝗹𝗼𝗼𝗸 𝗮𝘁 𝘄𝗵𝗮𝘁 𝘁𝗵𝗲 𝗰𝗵𝗮𝗿𝘁 𝗶𝘀 𝘁𝗲𝗹𝗹𝗶𝗻𝗴 𝘂𝘀!
𝗕𝘂𝗹𝗹𝗶𝘀𝗵 𝗦𝗲𝘁𝘂𝗽 𝗦𝗽𝗼𝘁𝘁𝗲𝗱 𝗼𝗻 𝘁𝗵𝗲 𝗖𝗗𝗦𝗟 𝗖𝗵𝗮𝗿𝘁
GROWW Trade Setup – Bullish BreakoutGROWW is trading within a descending channel on the daily timeframe. A breakout above the upper resistance trendline near ₹212 could indicate a potential bullish move toward ₹252.
First Entry (60%): Enter 60% of the planned position after a confirmed breakout above ₹212
Second Entry (40%): Add the remaining 40% after a daily candle closes above ₹221, bringing the total position to 100%
Target: ₹252, representing ~18.7% upside from the ₹212 breakout level
Stop-Loss: Place an initial stop-loss
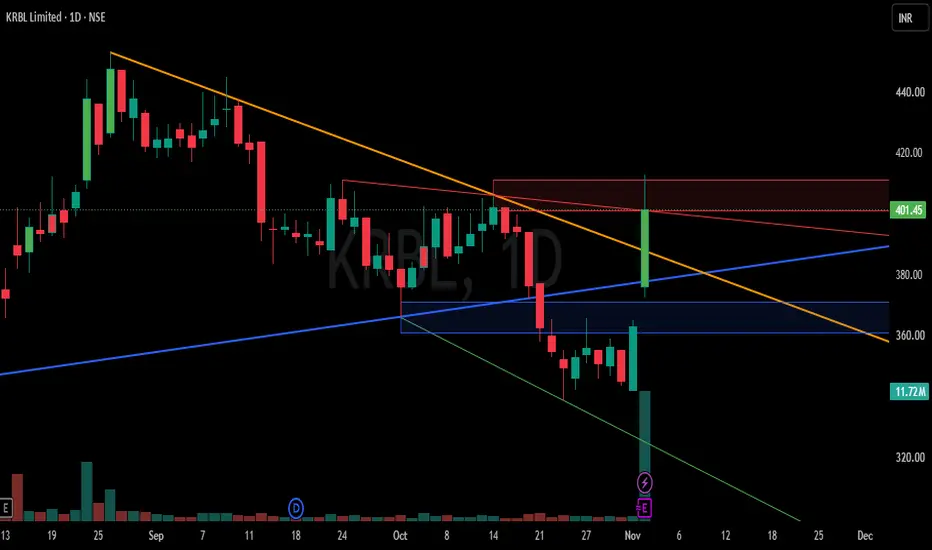
Buy Today, Sell Tomorrow for 3-5% - Daily Breakout SetupKRBL — BTST BREAKOUT SETUP
Entry, Stop Loss & Targets Are Clearly Defined — Helping You Plan Your Trade With Confidence.
A bullish breakout has appeared on the 1D timeframe with positive price action and strong volume expansion.
🔄 Trade Type: BTST
────────────────────
🎯 TRADE LEVELS
ENTRY: ₹401
🛑 STOP LOSS
Previous Candle Low
🎯 TARGETS
3–5%
────────────────────
📈 VOLUME
Volume: GOOD
────────────────────
⏱ Timeframe: 1 Day
📌 Trade Entry: Take the trade only after 3:15 PM.
The positi
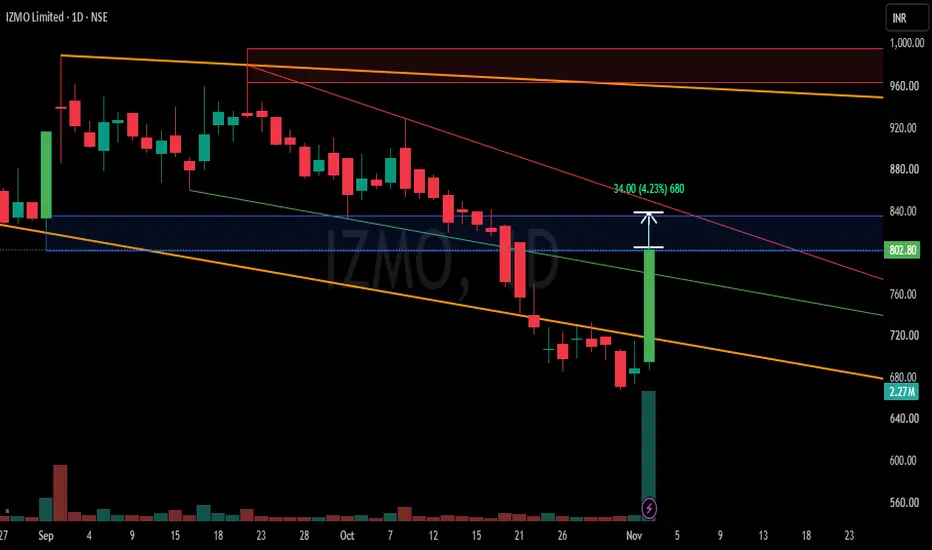
Buy Today, Sell Tomorrow for 3-5% - Daily Breakout SetupIZMO — BTST BREAKOUT SETUP
Entry, Stop Loss & Targets Are Clearly Defined — Helping You Plan Your Trade With Confidence.
A bullish breakout has appeared on the 1D timeframe with positive price action and strong volume expansion.
🔄 Trade Type: BTST
────────────────────
🎯 TRADE LEVELS
ENTRY: ₹795
🛑 STOP LOSS
₹750
🎯 TARGETS
3–5%
────────────────────
📈 VOLUME
Volume: GOOD
────────────────────
⏱ Timeframe: 1 Day
📌 Trade Entry: Take the trade only after 3:15 PM.
The position can be held
Buy Today, Sell Tomorrow for 3-5% - Daily Breakout SetupCDSL — BTST BREAKOUT SETUP
Entry, Stop Loss & Targets Are Clearly Defined — Helping You Plan Your Trade With Confidence.
📊 Stock Strength: 69/100
(Note: Higher score indicates stronger stock conditions, not guaranteed returns.)
A bullish breakout has appeared on the 1D timeframe with positive price action and strong volume expansion.
🔄 Trade Type: BTST
────────────────────
🎯 TRADE LEVELS
ENTRY: ₹1320
🛑 STOP LOSS
Previous Candle Low: ₹1261
🎯 TARGETS
3–5%
────────────────────
📈 VOLUME
2
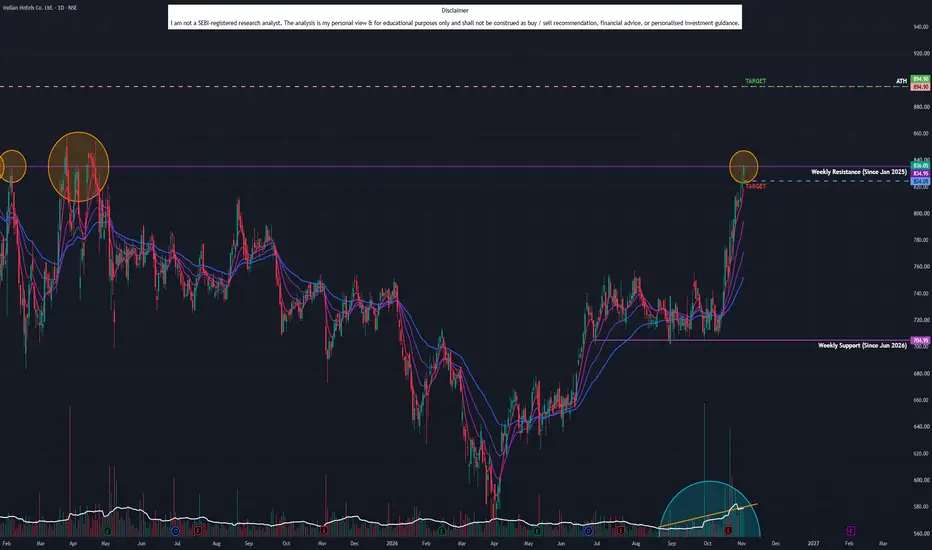
Indian Hotels (D): LONG-TERM HORIZONTAL BREAKOUTTimeframe: Daily | Chart Scale: Linear
Constructive +1.65% daily advance backed by a solid 4.68M volume! 🔥
Technical Highlights:
✅ Breakout: Cleared & closed above a major long-term horizontal resistance (active since Jan '25).
✅ Volume: Steady rising volume over the past several weeks confirms heavy buyer accumulation.
✅ Momentum: Perfect alignment! EMAs in positive crossover (Daily/Weekly/Monthly). MACD & RSI rising. 🚀
Key Levels to Watch:
🎯 Target: 895
🛡️ Support / Pullba