Lloyds Engineering works🚀 BREAKOUT RADAR
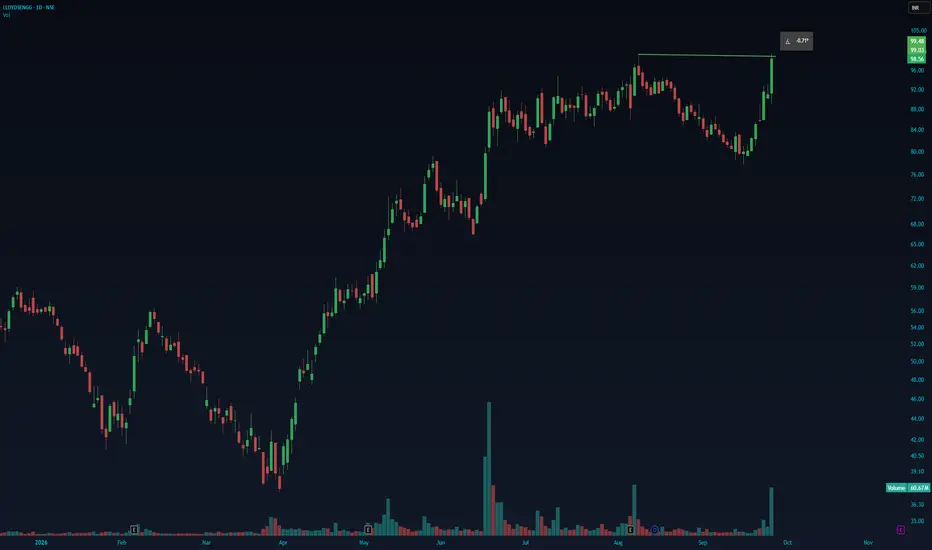
Lloyds Engineering Works — Daily Chart | Buy Setup
Lloyds Engineering Works is showing a strong breakout attempt on the daily chart after several weeks of consolidation between roughly ₹80–₹98.
The current move has pushed price into the ₹98–₹100 resistance zone, with a clear pickup in volume supporting the breakout attempt.
Buy above ₹100 only after a sustained breakout/close with volume.
🎯 Targets: ₹105 → ₹110 → ₹115
🛑 SL: ₹95–₹96
A successful retest of ₹98–₹100 followed
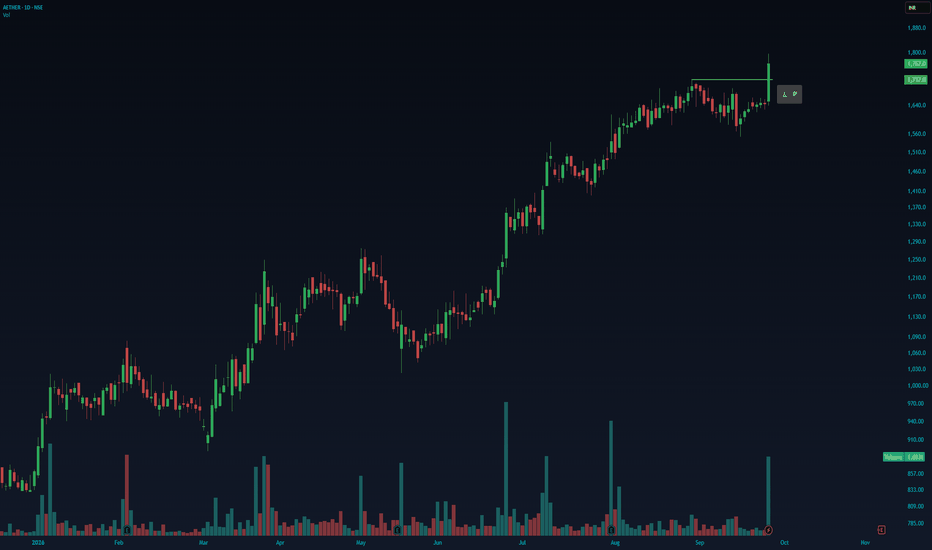
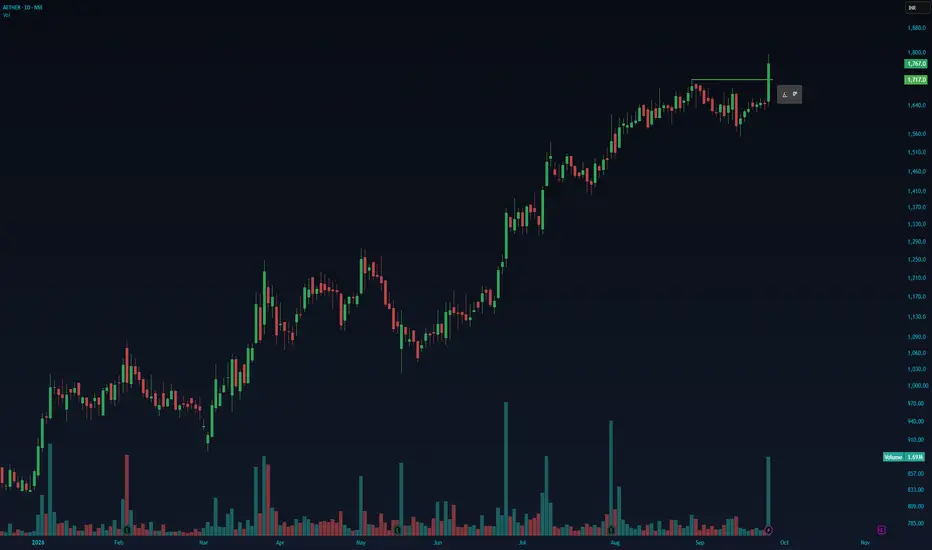
AETHER INDUSTRIES🚀 Aether Industries — Breakout Setup
Aether Industries is showing a strong breakout on the daily chart after consolidating around the ₹1,650–₹1,720 zone.
Price has moved above the previous resistance near ₹1,717, backed by a significant volume expansion, which adds strength to the breakout.
📈 Buy above ₹1,720–1,725 on sustained price action
🎯 Targets: ₹1,800 → ₹1,850 → ₹1,900
🛑 SL: ₹1,670
A successful retest of ₹1,717–₹1,720 can also be watched for a better risk-defined entry.
Breakout + vo
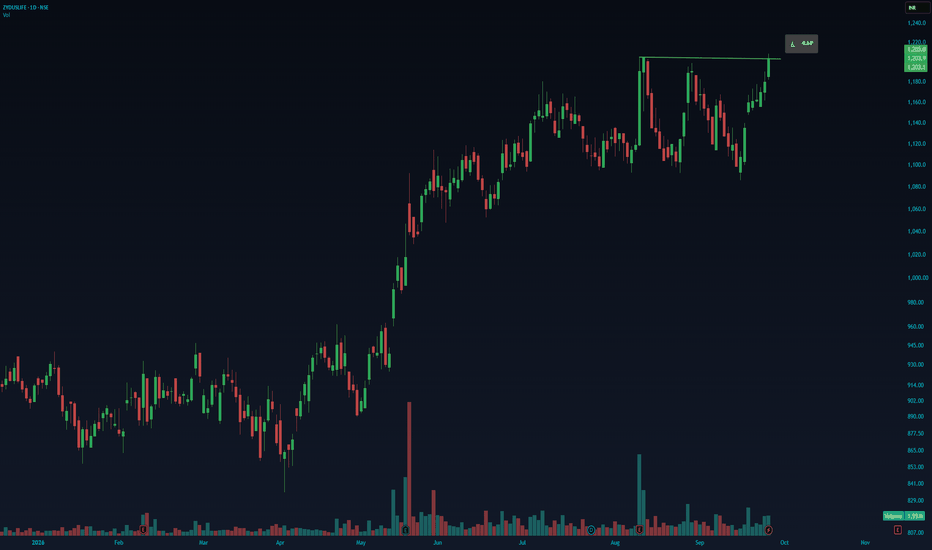
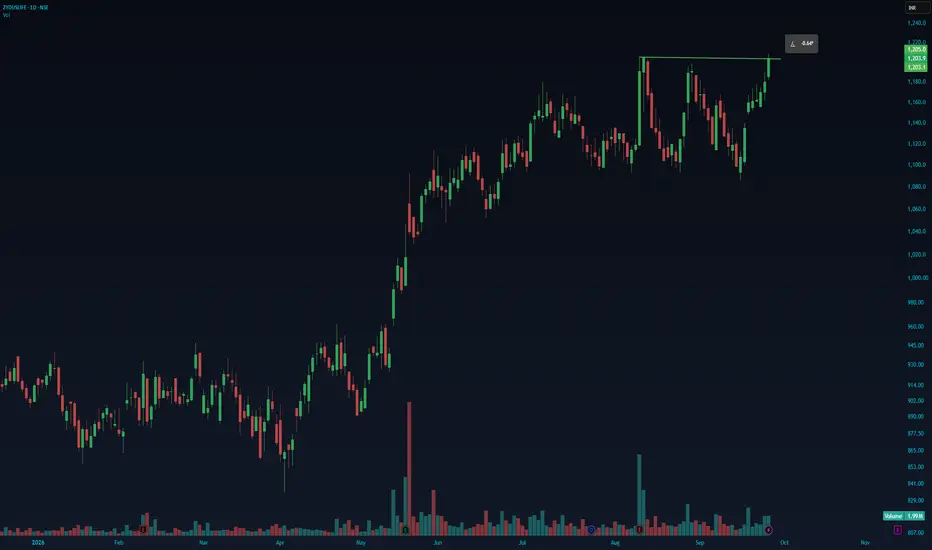
ZYDUS LIFESCIENCES🚀 Zydus Lifesciences — Breakout Setup
Zydus Life is approaching a major resistance zone around ₹1,205 after consolidating for several weeks.
📈 Price is testing the previous high with volume above its 20-day average, supporting the breakout attempt.
Buy above ₹1,205 with sustained price action/volume confirmation.
🎯 Targets: ₹1,250 → ₹1,300
🛑 SL: ₹1,175
A successful breakout and retest of ₹1,200–1,205 can provide a better risk-defined entry.
Key trigger: ₹1,205 breakout + volume confirmatio
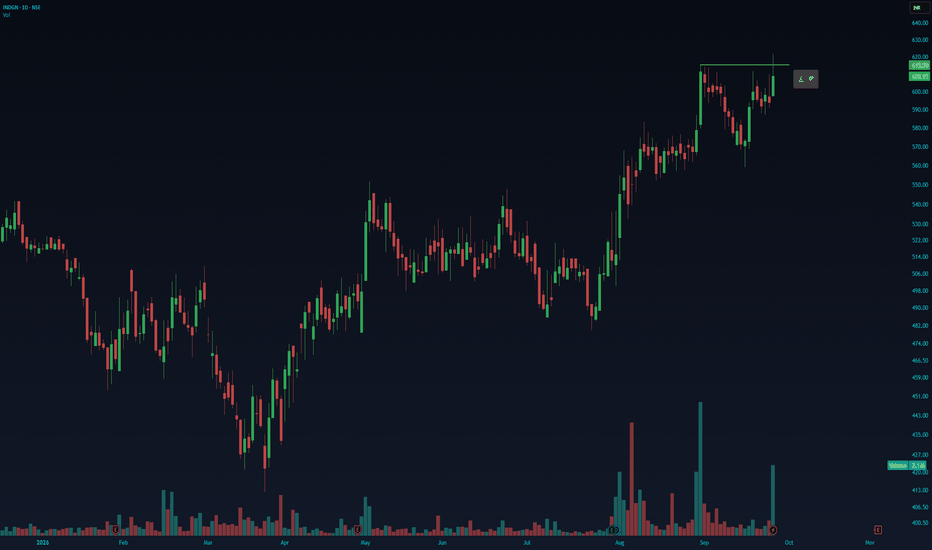
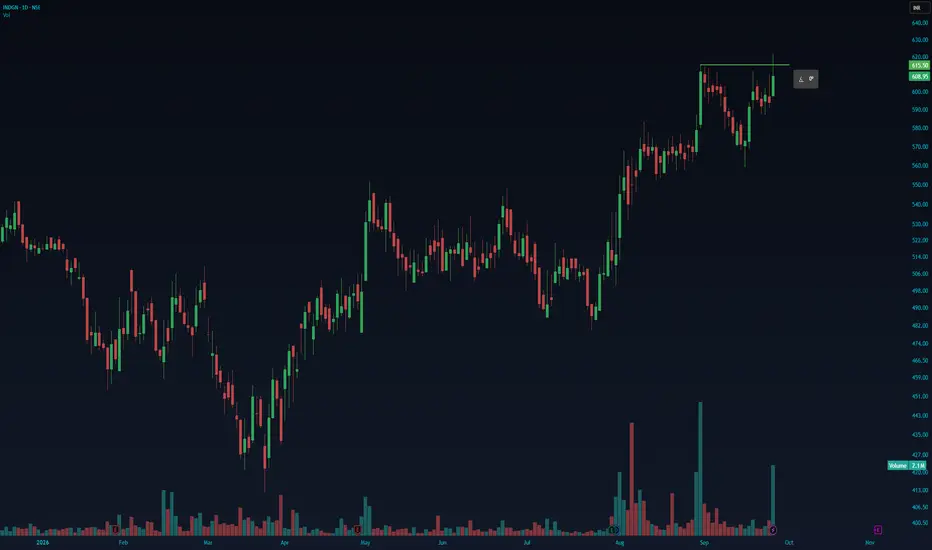
INDEGENE Indegene — Breakout Setup
Indegene is approaching a key resistance zone around ₹615–₹616 after a strong recovery and consolidation near the highs.
📈 Price is testing the previous swing high, with the latest move supported by a noticeable volume expansion.
Buy above ₹616 with sustained breakout and volume confirmation.
🎯 Targets: ₹630 → ₹645 → ₹660
🛑 SL: ₹595
A successful breakout followed by a retest of ₹615–₹616 can offer a better risk-defined entry.
Key trigger: ₹616 + volume confirmatio
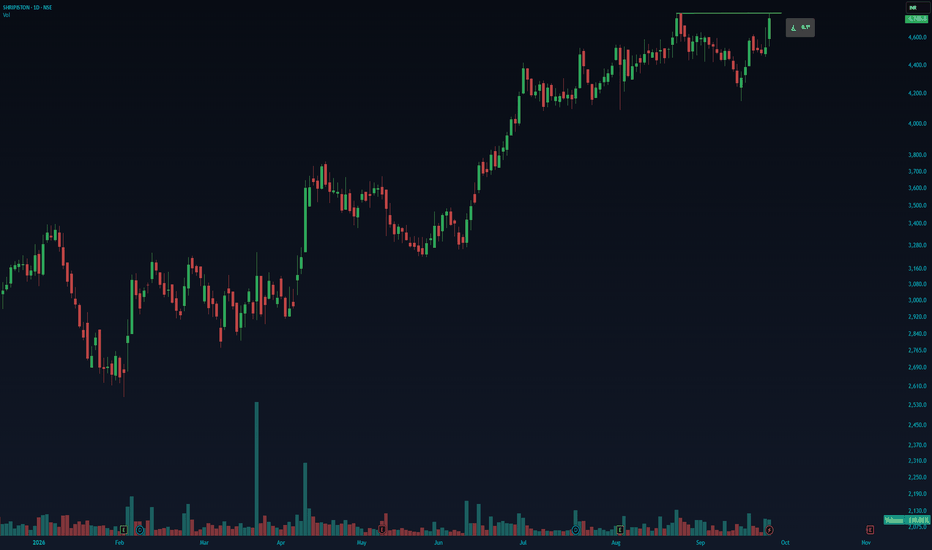
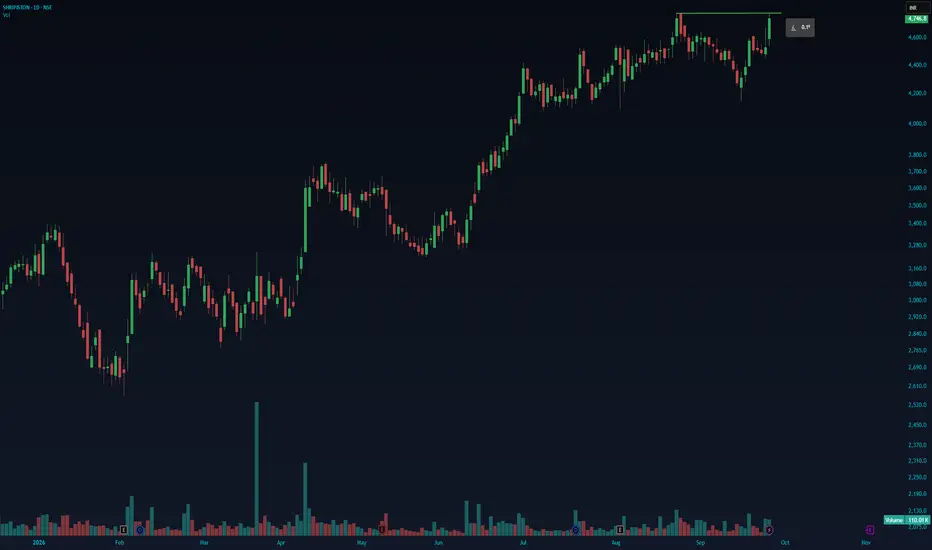
SHRIRAM PISTONSShriram Pistons is testing a major resistance zone around ₹4,785 after a strong uptrend and a period of consolidation near the highs.
📈 Price is approaching the previous high with volume above the recent average, making this an interesting breakout setup.
Buy above ₹4,785 with a sustained breakout and volume confirmation.
🎯 Targets: ₹4,900 → ₹5,050 → ₹5,200
🛑 SL: ₹4,650
A breakout followed by a successful retest of ₹4,750–₹4,785 could offer a better risk-defined entry.
Key trigger: ₹4,785 b
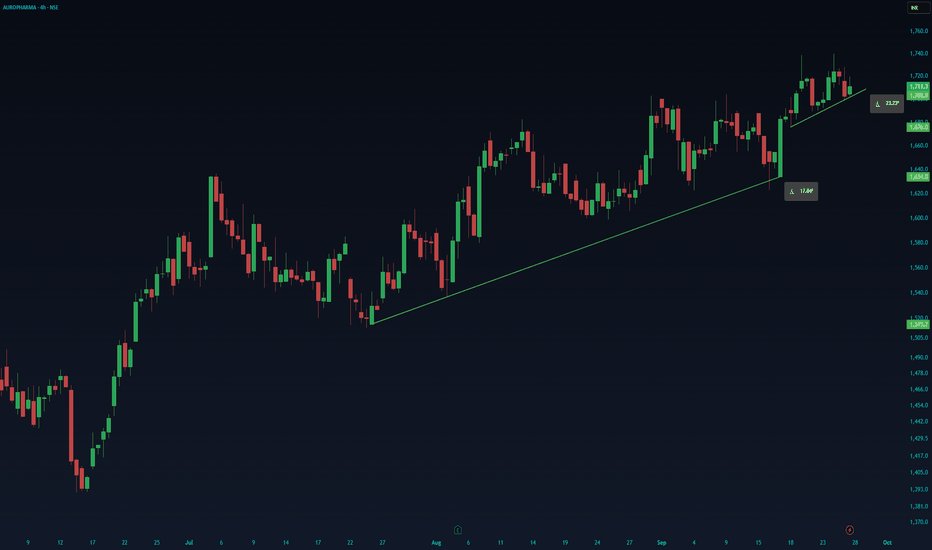
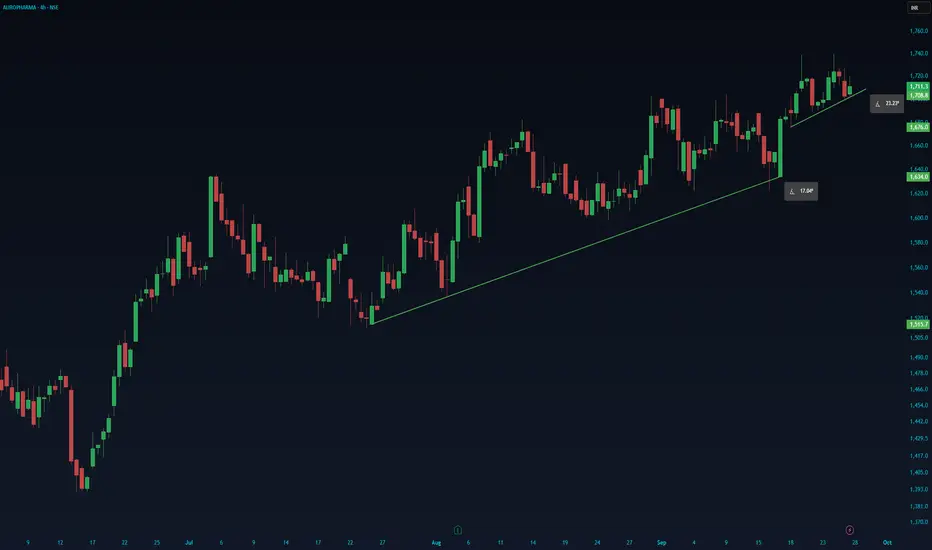
auro phamra bullishAurobindo Pharma — Long Setup
Bullish structure remains intact with higher highs and higher lows.
Long setup: Watch for a sustained breakout above ₹1,730 with volume/price confirmation.
Entry: Above ₹1,730 after confirmation
SL: Below ₹1,700
Targets: ₹1,760 → ₹1,800+
Alternative: A bullish reversal near ₹1,700–₹1,708 can also be watched for a pullback entry.
The setup remains valid as long as the rising trend structure holds. Wait for confirmation; avoid chasing a weak breakout.
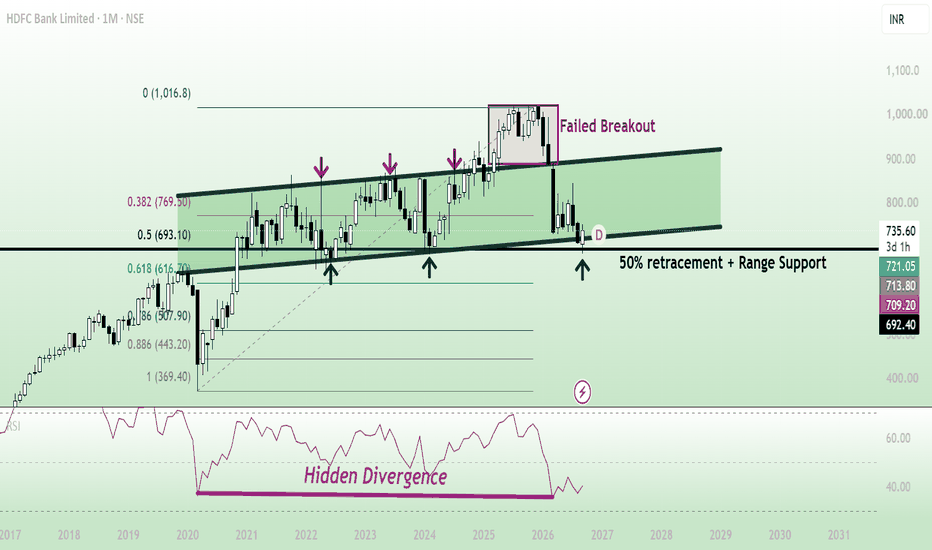
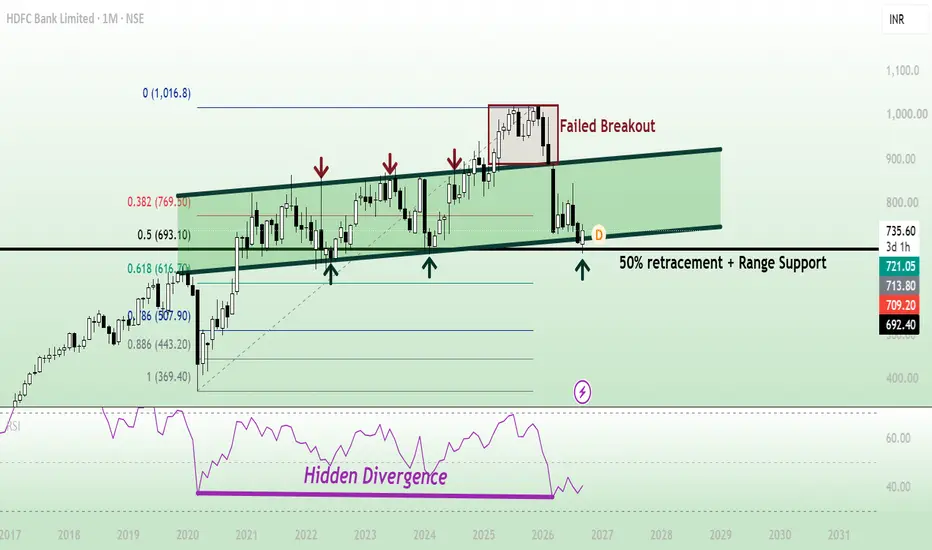
HDFCBANK | RETRACEMENT LONG OVERDUE?Key Points to note:
-----------------------
1. Stock has been in a fall since Dec '25 without reasonable retracement, indicating oversold condition.
2. Currently it's taking support at the 50% Fibonacci retracement level.
3. This level is also the support of a range that it's been trading inside of. There was a breakout attempt, but it failed and price got back inside the range
4. There is also hidden divergence that RSI shows, which means a loss of selling interest.
------------------------
K
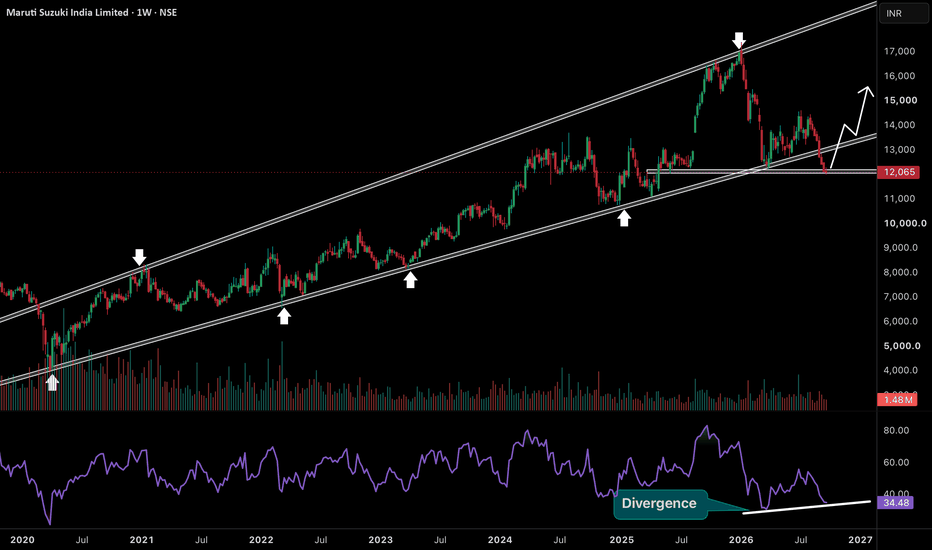
Retail Panic Near Support, But A Reversal Is Taking Shape
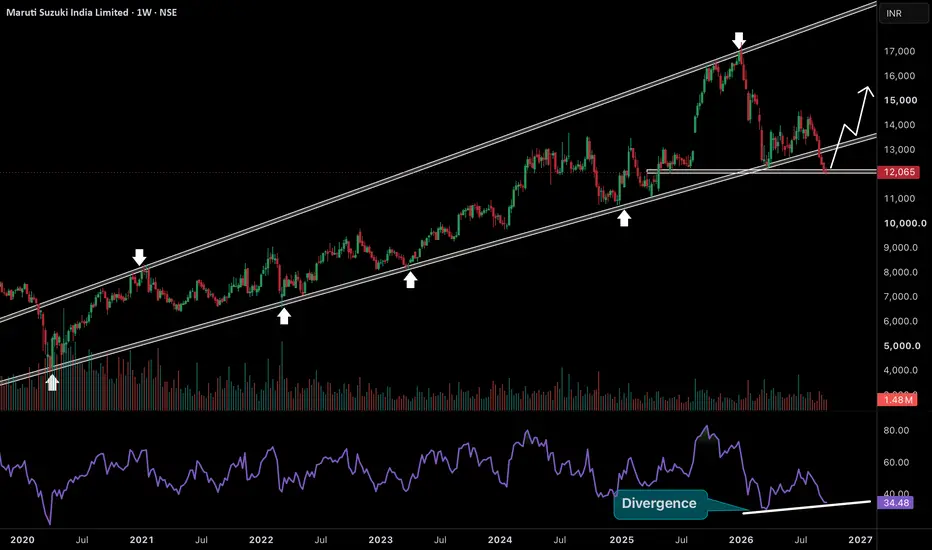
Maruti Suzuki is approaching a very important support zone around 12000 after a sharp correction from its recent highs near 17000. The stock has been moving inside a massive ascending channel for several years and has repeatedly attracted strong buying whenever it approached the lower trendline. This time price has slipped below the channel support and is testing its previous horizontal support. Interestingly the weekly RSI is showing a potential bullish divergence as momentum weakens less tha
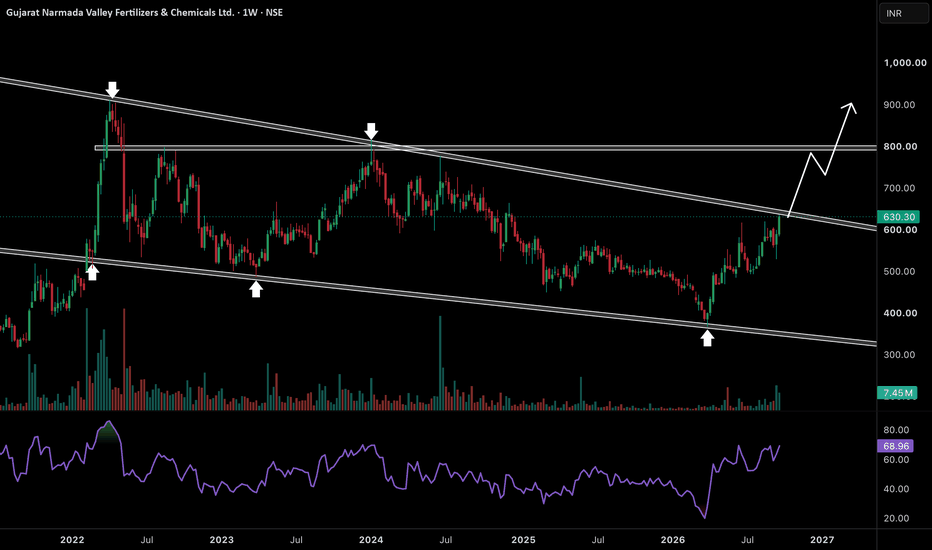
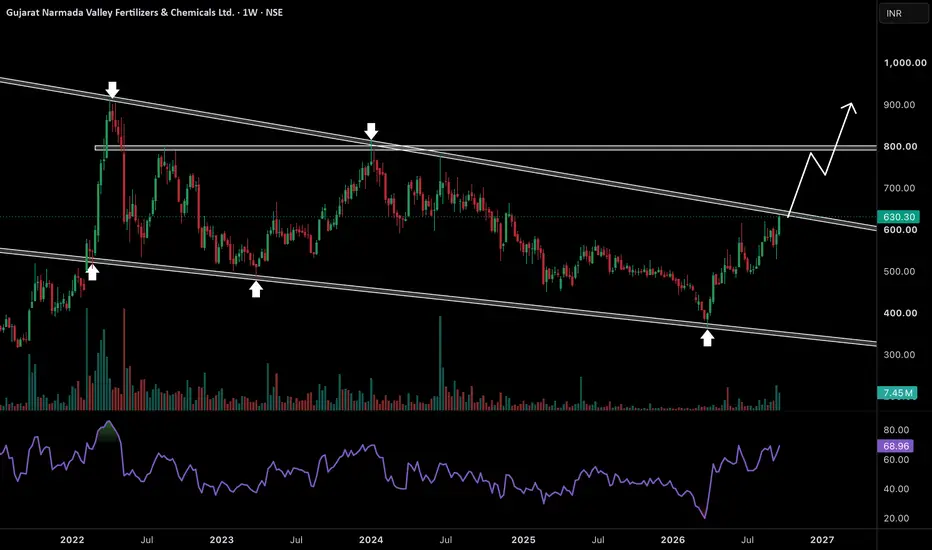
Three Years of Selling Pressure Could End With One BreakoutGNFC is approaching a major turning point after spending more than three years inside a massive descending channel. Every major rally since 2022 has faced rejection near the upper trendline while the lower boundary has repeatedly attracted buyers. This time the stock has recovered sharply from the 370–380 support zone and is now testing its multiyear resistance around 630–650. The recovery is supported by improving volumes and weekly RSI near 69 which indicates strong buying momentum. Sellers ha
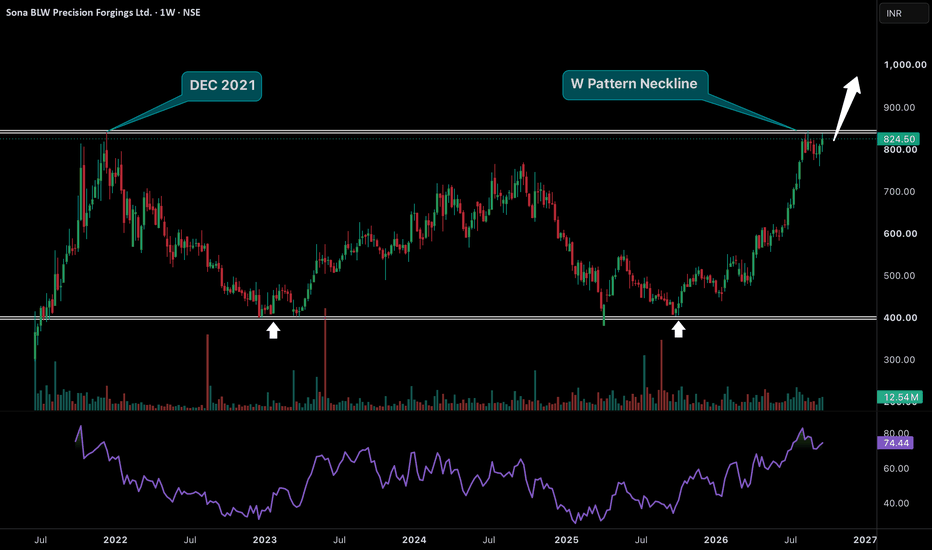
Four Years of Resistance. One Breakout Can Change EverythingSona BLW is approaching a very important breakout after forming a massive W pattern on the weekly chart. The stock has defended the 400 support zone twice and recovered strongly from both bottoms. Now buyers have pushed the price towards the 820–840 neckline which also happens to be the major resistance from December 2021. This is not just an ordinary resistance level. A breakout here would complete a multiyear double-bottom reversal pattern and signal a major shift in the long-term structure. R
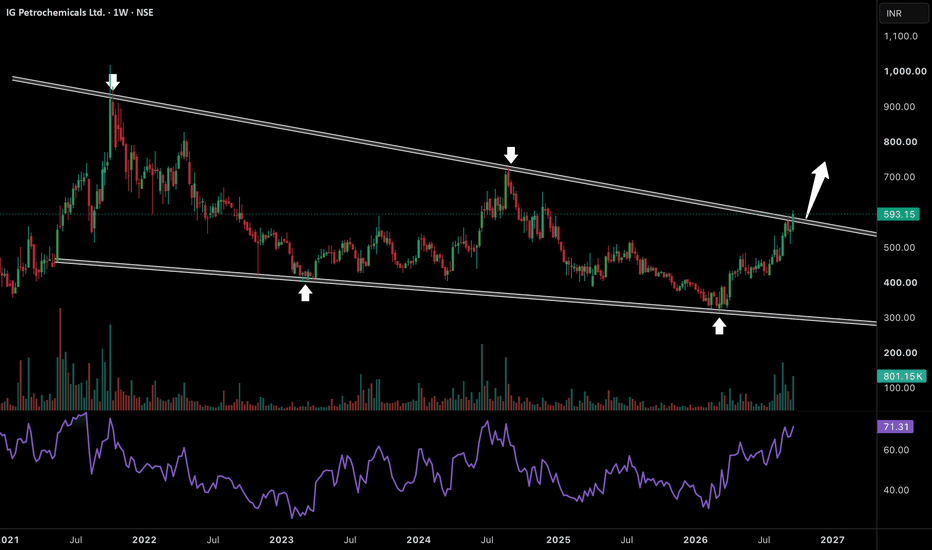
A Five-Year Downtrend Is Finally Losing Its GripIG Petrochemicals is showing strong bullish momentum after recovering sharply from the lower boundary of its long-term descending channel. The stock has been trading inside this structure since 2021 with every major rally facing rejection near the upper trendline. But this time buyers have pushed the price back towards 593 with strong volume and RSI above 71. The stock is now attempting to break its five-year descending resistance. A successful breakout could trap sellers who have been expecting
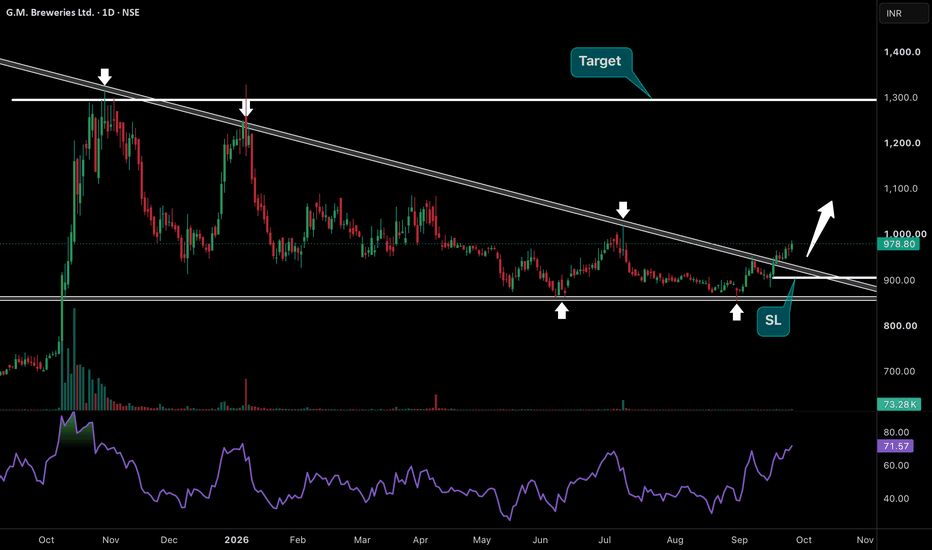
The Downtrend Is Breaking and Buyers Are Taking ControlG.M. Breweries is showing strong bullish momentum after breaking above a descending trendline that has been acting as resistance for almost a year. Every previous attempt to cross this trendline resulted in selling pressure but this time the structure looks different. Price has formed a strong base around 850–870 and is now trading near 979 after breaking the trendline. The recent recovery is supported by a rising RSI above 70 which indicates strong buying momentum. Sellers who were expecting an
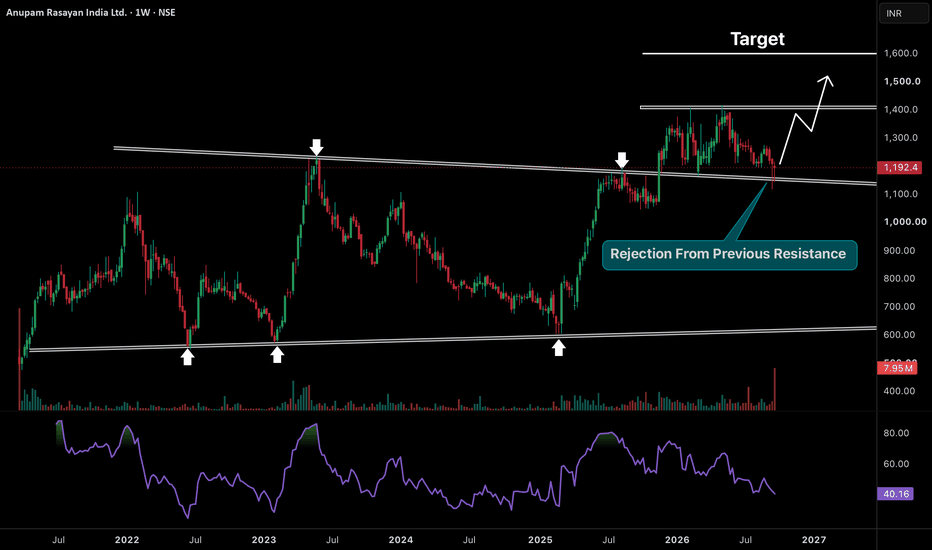
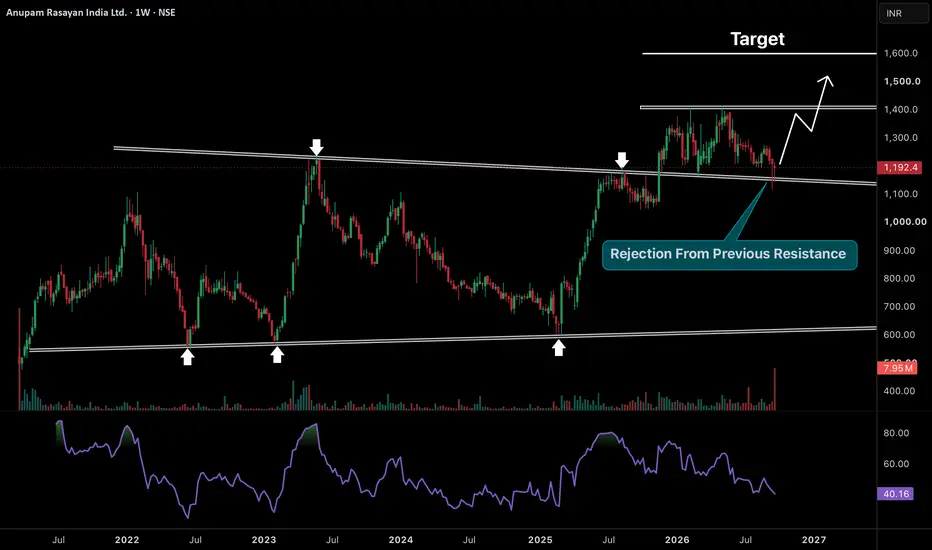
This Retest Could Trigger the Next Big RallyAnupam Rasayan is back at a very important zone after its strong rally from the 600 levels towards 1400. The stock has corrected towards its previous multiyear resistance around 1150–1200 which is now acting as support. This is a classic breakout and retest structure where price returns to test the same level that previously restricted its upside. The latest weekly candle has shown rejection from this zone but the recovery still needs confirmation. If buyers successfully defend this support and
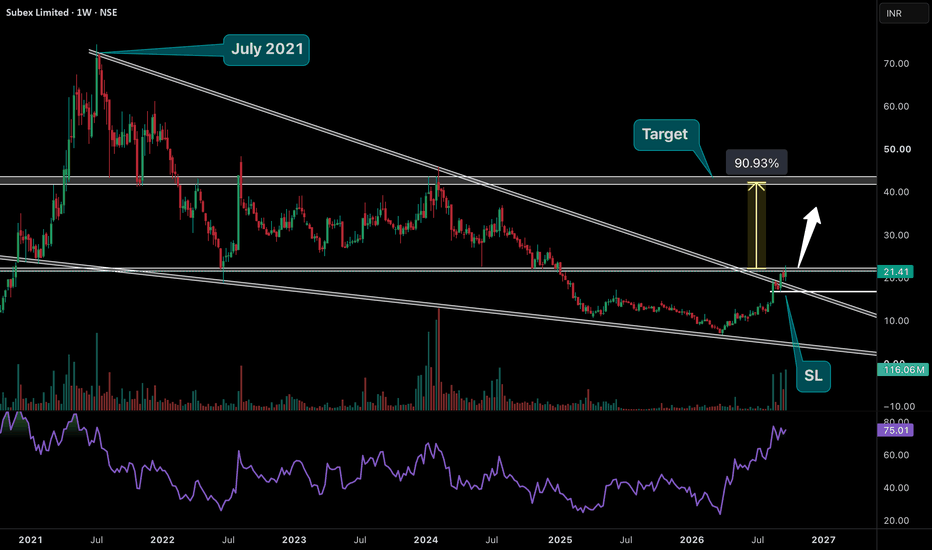
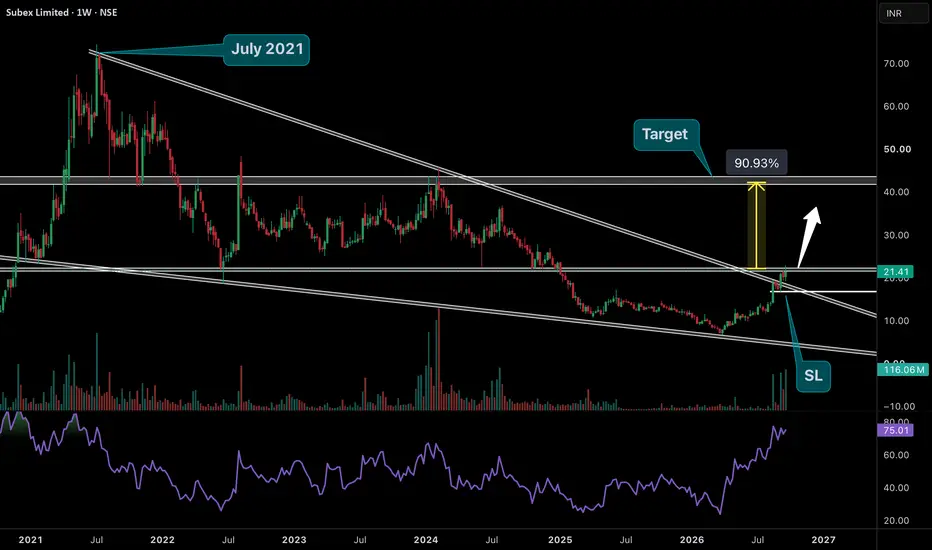
A 5-Year Downtrend Is Ending. Momentum Is ExplodingSubex is showing exceptional strength after spending almost five years under a major descending trendline that started in July 2021. The stock has finally reached a crucial breakout zone around 20–22 and is attempting to break out of its long-term bearish structure. What makes this setup particularly interesting is the sharp recovery from its recent lows accompanied by a massive increase in trading volume. Weekly RSI has climbed to 75 which shows how aggressively momentum has shifted towards buy
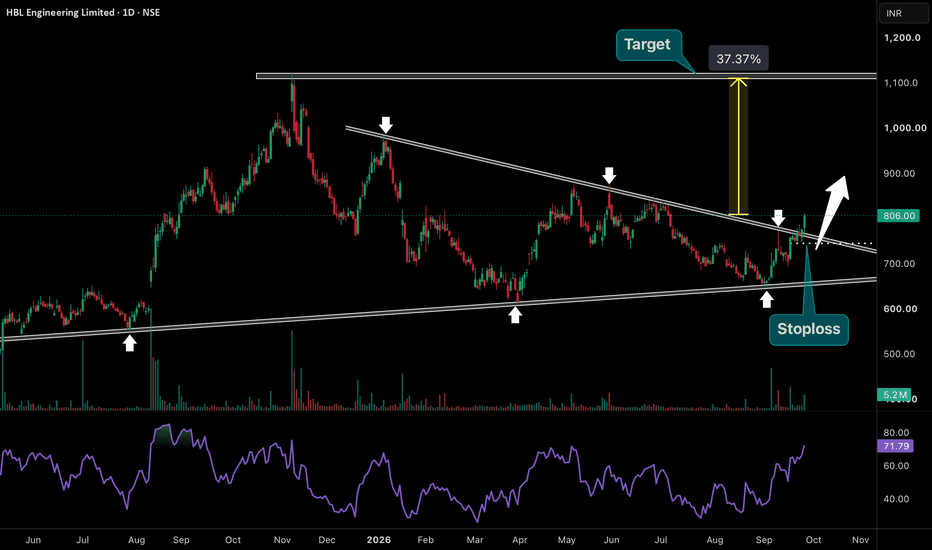
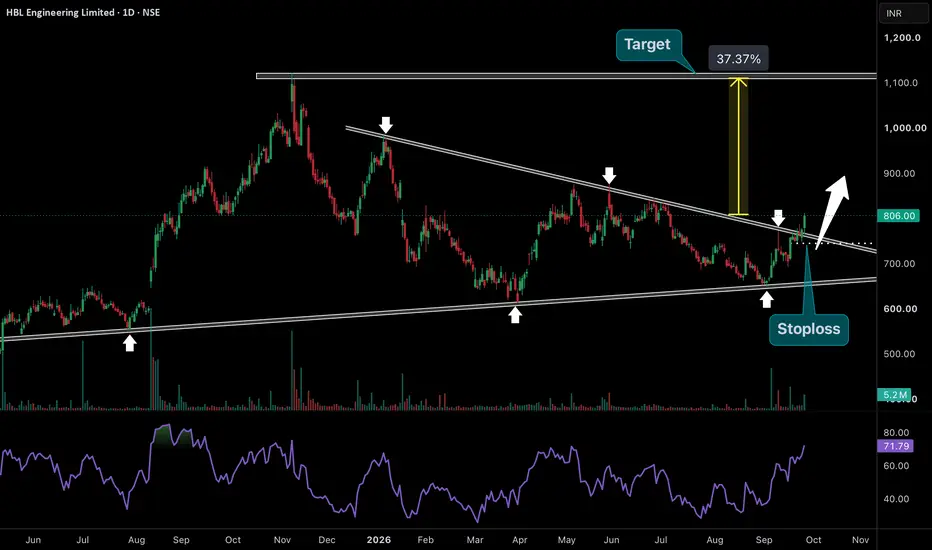
This Breakout Could Unlock a Powerful Rally Towards 1100HBL Engineering is showing excellent strength after bouncing from its long-term rising support near 650. The stock has been forming a series of lower highs under a descending trendline for several months while buyers have consistently defended the rising support. Now price is attempting to break this entire structure with strong bullish momentum. The latest move towards 806 is particularly important because the stock is crossing a trendline that has rejected multiple rallies in the past. RSI has
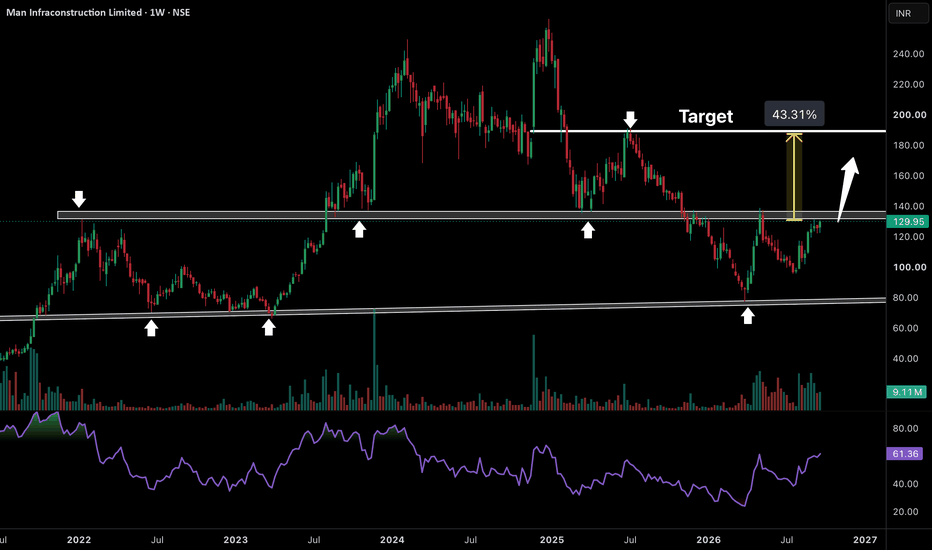
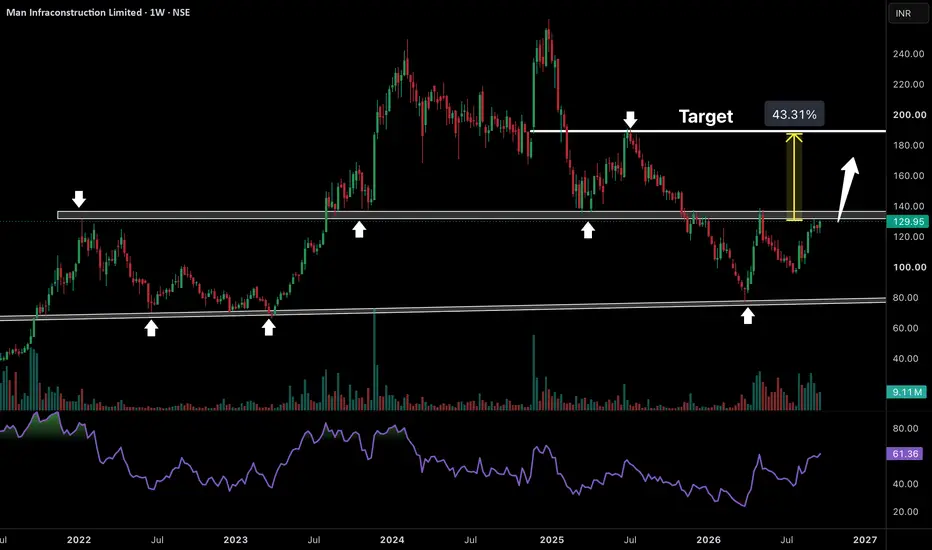
A Powerful Reversal Is Building After a Deep Correction
Man Infraconstruction is showing strong signs of recovery after a massive correction from its previous highs. The stock recently bounced from its long-term rising support around 75–80 and has recovered sharply towards 130. Now price is approaching the important 130–140 resistance zone which has acted as both support and resistance multiple times over the last four years. The weekly RSI has recovered above 60 and buying volumes have improved significantly. This suggests that buyers are gradually