Mazagon Dock (MAZDOCK) — Second Test of the 0.786 Fib ZoneOverview
Mazagon Dock has pulled back hard from its highs, and price is now testing an important support zone for the second time. Let's look at what's happening and what to watch for.
What's Happening
The stock had a strong run from 1,926 all the way up to 3,775, and has been falling back since then. Right now, price is sitting at the 0.786 Fib level (2,321.90) — and this is actually the second time it's come down to test this exact zone.
That matters. A level that gets tested once and holds is good. A level that gets tested twice and still holds is usually seen as stronger, since more traders are now watching and defending that price.
There's also a falling trendline resistance from the highs still in play, and the Weekly 50 EMA (2,510) sits just above current price too — so even if this support holds, there's a bit of a fight waiting above.
Key Levels to Watch
Support Zone (being tested now): 2,321–2,342 (Fib 0.786)
Bigger support below: 1,926 (Major Support) and Weekly 200 EMA (1,812)
Resistance above: Weekly 50 EMA (2,510), then the trendline resistance further up
Next Fib levels up if it bounces: 2,632 (0.618), then 2,850 (0.5)
Two Ways This Can Go
If support holds again: This would be the second successful defense of this zone, which is a good sign. Watch for a bounce back toward the 50 EMA (2,510) as the first hurdle.
If support breaks this time: A close well below 2,321 would mean the zone has finally given way, and the next real support to watch would be much lower, near 1,926 and the 200 EMA around 1,812.
Beginner's Lesson
Not all support levels are equal. A level that's been tested and held more than once tends to carry more weight, simply because more people remember it and act around it. That said, no level holds forever — eventually, even strong support can break if selling pressure is strong enough. This is why we always wait for confirmation rather than assuming a level will hold just because it did before.
Conclusion
Mazagon Dock is at an interesting second test of a key support zone. As always, we're watching for confirmation rather than guessing which way it goes. We'll post an update once this resolves one way or the other.
For educational purposes only. Not financial advice. Always manage your risk.  Long
Long
 Long
Long
 Long
Long
 Long
Long
Dixon Technologies: Long-Term Recovery Setup Near Key Fibonacci Trend (Long-Term Structure):
Dixon Technologies remains in a long-term bullish structure despite the recent correction. After a strong multi-year rally, the stock entered a corrective phase and is now attempting to stabilize near an important support zone. The larger trend remains positive as long as major support levels continue to hold.
Price Structure + Fibonacci:
Price corrected from the high around 19,174 and reached an important Fibonacci support region.
• 0.5 level: 10,845
• 0.618 level: 8,879
The stock has recently bounced from the support zone and is now attempting to move back above the 0.5 level. This indicates that buyers are becoming active near important retracement levels.
Volume Analysis:
Recent candles show healthy participation near lower levels. During the correction phase, volumes increased, and now recent recovery candles suggest that buying interest is gradually returning. Continued volume expansion would improve the probability of sustained upside.
RSI Analysis:
RSI is around 49 and recovering from the lower region near the 40 level. Momentum weakened during the correction, but RSI is now showing signs of recovery. A move above 60 would indicate stronger bullish momentum returning.
Current View:
The stock appears to be in a base-building phase after a substantial correction. Buyers are defending important Fibonacci levels, and price action suggests that the stock is trying to shift from correction mode into recovery mode.
Trading perspective:
• Immediate resistance: 10,800–11,000
• Higher resistance: 13,000–15,000
• Immediate support: 8,850–9,000
• Strong support: 7,500–8,000
• Bullish confirmation: Monthly close above 11,000 with strong volume
• Bearish confirmation: Monthly close below 8,850
Current View:
This currently looks like a long-term positional setup where the stock is attempting to recover after a major correction. As long as the 8,850–9,000 zone holds, the probability favors gradual upside movement over the coming months.
 Long
Long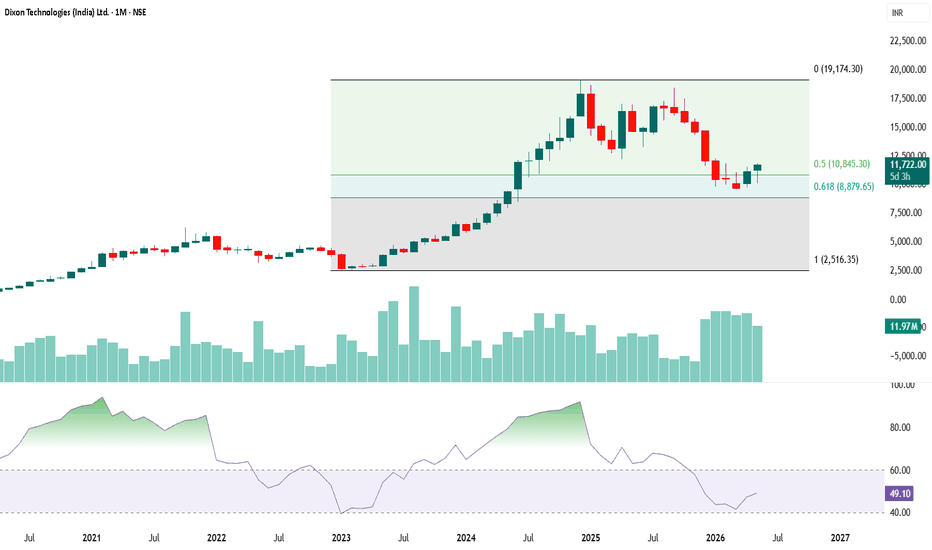
 Long
Long
Eternal/Zomato can be exceptional stock for next 5 years Based on my Elliott Wave analysis, Eternal (formerly Zomato) appears to have completed a larger Wave 2 correction and may now be forming multiple nested 1–2 wave structures. If this interpretation is correct, the stock could be preparing for a strong Wave 3 advance, which is typically the most powerful phase in an Elliott Wave cycle.
From a business perspective, the investment thesis also looks compelling. Eternal provides exposure to multiple long-term growth segments through its food delivery business and Blinkit, giving investors participation in both online food delivery and the rapidly expanding quick-commerce market.
If execution remains strong, profitability continues to improve, and the Wave 3 scenario plays out as expected, the stock has the potential to become a multibagger over the long term. That said, Elliott Wave analysis is a probabilistic framework rather than a certainty, so risk management and monitoring business fundamentals remain important.  Long
Long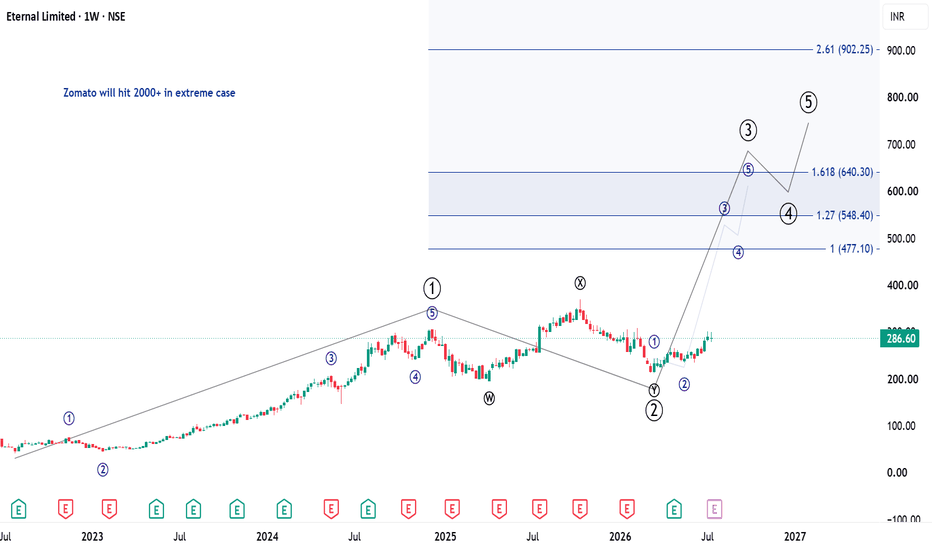
 Long
Long
 Short
Short
 Long
Long
Trading Masterclass #1Institutional trading means trading like hedge funds, banks, prop firms, and professional desks. They do not trade based on emotions, random tips, or gambling. They use systems, probabilities, risk control, position sizing, discipline, and psychology.
Retail traders often lose because they focus only on “entry.” Institutions focus on:
Risk Management
Capital Protection
Position Sizing
Probability
Psychology
 Education

How Monthly Structure Shapes Weekly Behavior🟢 This post is educational and observational in nature based on historical price action across multiple timeframes. It is not a forecast or a trading recommendation.
📈 Higher Timeframe
A higher timeframe refers to a chart view that compresses more time into each candle, such as monthly or weekly charts compared to daily or hourly ones. Higher timeframes tend to filter out short term noise and reveal the broader structural context a stock is trading within.
📏 Monthly Trendline
Marked in green, this trendline is drawn purely on the monthly timeframe. A trendline connects a series of highs or lows to reflect the underlying direction of price over a longer horizon, and because it originates from the monthly chart, it carries more structural weight than a trendline drawn on a lower timeframe.
📉 Bringing the Monthly Into the Weekly
On the right side of this post, the same monthly trendline has been carried over and overlaid onto the weekly timeframe. This is a deliberate multi timeframe approach, since a line drawn on a higher timeframe often continues to act as a relevant reference point even when viewed on a lower one.
🔄 The Flip Zone on the Weekly
Once overlaid, this level shows a clear flip zone on the weekly chart. What was previously acting as resistance on the weekly timeframe has, after being broken, converted into support
↩️ The Counter Trendline
Marked in white is a counter trendline, drawn against the direction of the primary trend. It is used to track corrective or pullback phases  Long
Long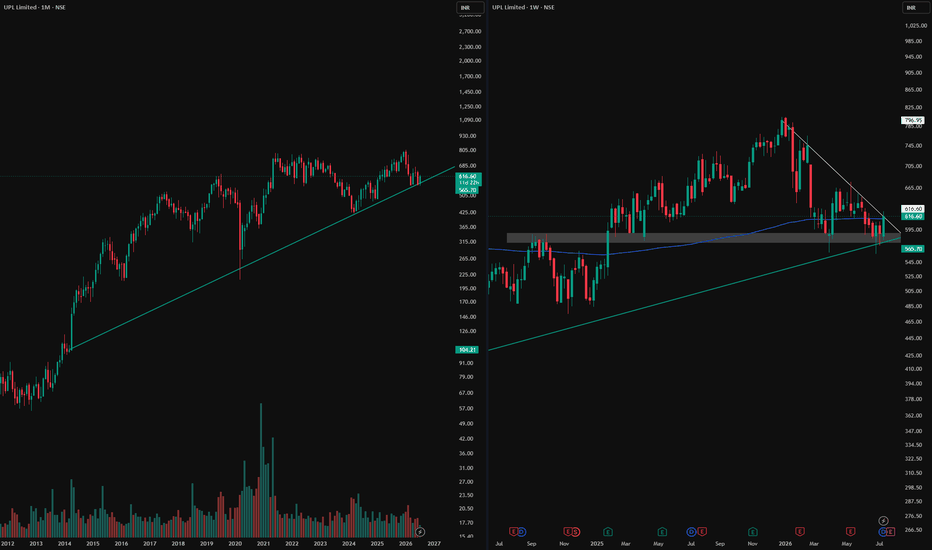
 Education

RELIANCE 1D Bearish Confirmation After Short Term Bullish RunThe move higher was helped by optimism around the proposed Jio Platforms IPO, which could unlock value for Reliance shareholders, alongside expectations around its AI, new-energy and digital businesses. More recently, Reliance also reported stronger than expected quarterly results, with strength in its O2C and Jio businesses.
But despite the fundamental strength and the recent rally, my technical bias is still bearish on the higher timeframe.
Reliance has been in a broader downtrend after rejecting from the ₹1,575–₹1,600 region.
Since then, price has been creating a series of lower highs and lower lows. The recent rally has brought price back toward the ₹1,350 area, which is an important resistance zone and the level I have marked for a potential short.
My expectation is that price could first push higher into this area, potentially creating the liquidity needed for the next leg down.
From there, I would be watching for confirmation of my bearish idea.
The long-term target I have marked is around ₹1,111, which is the previous major low and the area where I expect price could eventually seek liquidity.
So my technical idea is:
Retracement into ₹1,350 → rejection → bearish continuation → ₹1,111 long-term target.
The recent pump does not invalidate the bearish structure for me. In fact, a retracement higher into resistance could provide the exact setup I am waiting for. Short 
 Long
Long
Long 
Cera Sanitaryware LtdRating: Moderately Bullish (Medium Term) (8/10)
Latest Positives
Premium building materials brand with leadership in sanitaryware, faucets and wellness products.
Debt-free balance sheet, strong cash generation and consistently high return ratios.
Management expects retail demand recovery and healthy project demand to continue in FY27.
Recent price hikes have been absorbed by the market without impacting demand materially.
The company expects growth from premiumization, distribution expansion and market share gains, especially as some Morbi manufacturers continue facing operational challenges.
Latest Risks / Negatives
Building materials demand is still linked to the real estate cycle.
Valuation remains higher than several peers, leaving less room for disappointment.
Technically, the stock is still below its long-term falling trendline around ₹6,500-6,700.
Latest News & Analysts' Commentary
Prabhudas Lilladher: BUY, Target ₹7,429 citing retail recovery, premiumization and market share gains.
Motilal Oswal: Positive after Q4, Target around ₹6,850, expecting healthy growth guidance.
CRISIL reaffirmed AA/Stable rating, highlighting CERA's strong market position and diversified business.
Technical View
Indicating a bullish Flag and Pole pattern and is retesting.
The stock has bounced strongly from ₹4,700-4,900, indicating a medium-term bottom.
RSI is around 57, showing improving momentum.
Price is facing resistance around ₹6,300-6,500.
A breakout above ₹6,500 could trigger a move toward ₹7,000-7,400.
Volume has improved during the recent recovery, which is constructive.
Best Entry
Ideal accumulation: ₹5,850-6,050
Aggressive buy: Around current levels if it sustains above ₹6,000.
Breakout buy: Above ₹6,500 with strong volume.
Stop Loss
Conservative: Weekly close below ₹5,700
Targets
Target 1: ₹6,500
Target 2: ₹7,000
Target 3 (6–12 months): ₹7,400-7,700
Among building-material companies, CERA remains one of the highest-quality businesses, although investors pay a premium for that quality.
Delivery Percentage
Recent trading sessions indicate healthy delivery-based buying, with improving volumes during the recovery phase.
No signs of excessive speculative activity; the buying appears more positional than purely intraday. (Daily delivery percentages fluctuate, but the recent trend has been constructive.)
Final Verdict
Investment Rating: Accumulate on Dips
Risk: Medium-Low
Confidence: 8/10
Probability of reaching ₹7,000 within 6–12 months: 70–75%, provided housing demand remains healthy and the stock confirms a breakout above ₹6,500.
Key Levels to Watch
✅ Strong Support: ₹5,700-5,850
✅ Buy Zone: ₹5,850-6,050
✅ Breakout: ₹6,500
🎯 Medium-Term Target: ₹7,000-7,400  Long
Long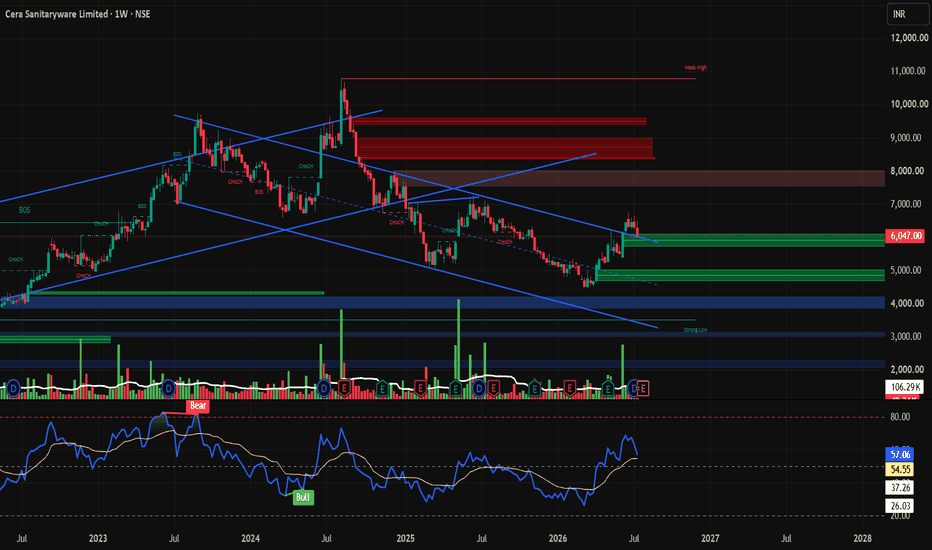
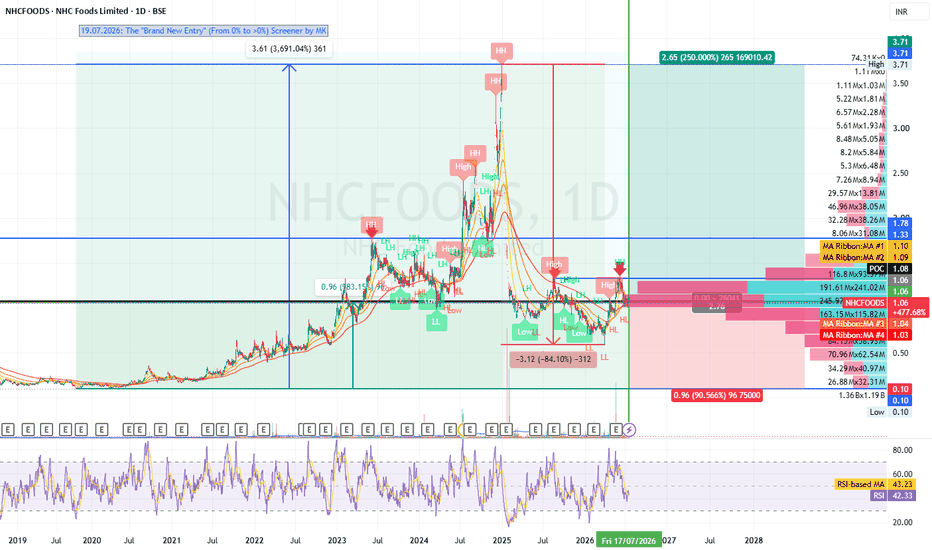
NHCFOODS: Consolidating at Macro Support Aft Volatile CorrectionOverview :
NHC Foods Limited (BSE: 517554) is currently navigating a period of consolidation on the daily (1D) timeframe. After peaking at a 52-week high of ₹1.35, the stock has experienced significant volatility and corrective pressure, now trading near the ₹1.06 level. The company, a nano-cap entity in the FMCG sector, has recently seen a notable expansion in its equity base following FCCB conversions, which continues to influence market sentiment.
Trend Direction (Moving Averages) :
MA Ribbon/EMA Analysis : The stock is currently trading in a tight range relative to its short-term moving averages. With the 5-day, 10-day, 20-day, and 50-day SMAs all clustered near the ₹1.10 level, the price is currently suppressed by this overhead resistance. However, it maintains a position slightly above its 200-day SMA (approx. ₹1.00), suggesting that the long-term bullish trend remains precariously intact.
Momentum Indicators :
RSI (Relative Strength Index) : The RSI(14) is currently in the 42–44 range. This indicates a neutral to slightly bearish momentum. It is neither overbought nor oversold, suggesting a lack of decisive trend-driving volume.
MACD : The MACD line remains below its signal line and the zero line, which is traditionally viewed as a bearish signal, reflecting the lack of upward momentum seen over the past month.
Fibonacci : The stock is testing levels that align with recent structural support. A breakdown below the ₹1.00 psychological floor would likely signal a retest of the 52-week low near ₹0.59.
Key Levels to Watch :
Resistance : The immediate hurdle is the ₹1.10–₹1.11 zone (the cluster of short-term moving averages and the recent high). A volume-backed breakout above ₹1.15 is required to shift the bias to bullish.
Support : The primary support zone sits at ₹1.00–₹1.05. If the price fails to hold the ₹1.00 level, the stock may enter a deeper retracement phase.
Directional Bias: NEUTRAL / CAUTIOUS
The stock is in a "wait-and-see" phase. Until NHCFOODS can decisively clear the ₹1.11 resistance with significant trading volume, the risk of sideways consolidation or a drift toward support remains higher than the probability of an impulsive breakout.
Disclaimer : This analysis is for educational purposes only and does not constitute financial advice. Nano-cap stocks like NHC Foods carry high volatility and liquidity risks; please manage your position sizing accordingly.  Long
Long