ICICI BankWe are about to witness ALL TIME HIGH breakout in this stock. Chances of multi bagger returns provided the breakout sustains. Sharing views for educational purposeby KaranVGupta21
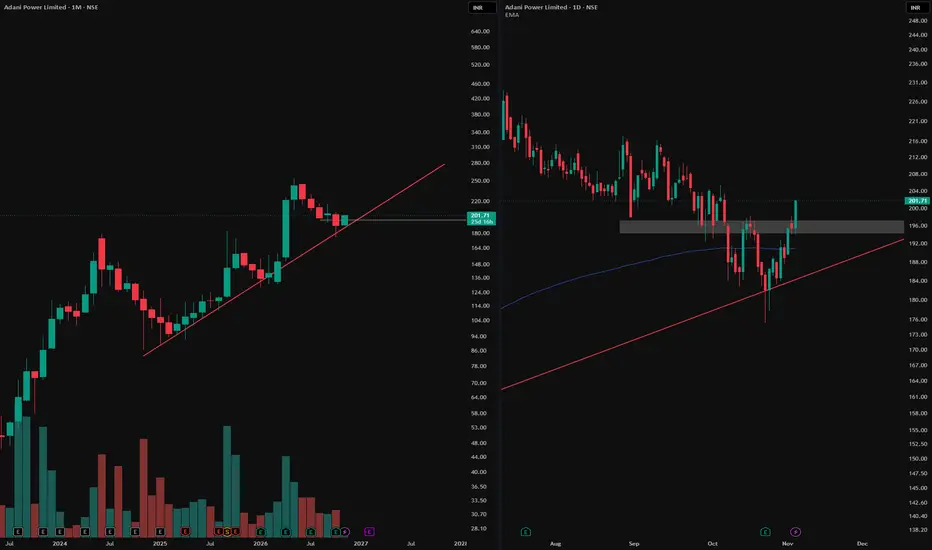
Adani Power: One Monthly Trendline, One Daily W-BottomApoorv Dubey | SEBI Registered Research Analyst | INH000030287 Monthly chart (left): The red line marks rising support. Price has reacted around this trendline several times, making it a useful reference for the broader trend. Daily chart (right): Zoom in on the latest reaction and you’ll see a W-shaped bottom. The grey zone first acted as support, then became resistance after price broke below it. It also marked the area of the rebound between the two lows. The latest daily candle closed abovLongby Apoorv-Dubey_SEBI-RA25
SBIN - Potential Bullish Reversal from Demand ZoneSBIN is showing early signs of a potential reversal from its previous demand zone. In May 2026, the stock made a low near 933.90, followed by a rally towards 1,124.50. After the subsequent correction, it revisited the demand zone and formed a slightly higher low near 937.50. The recent price action suggests buying interest is emerging at these levels, with early signs of a short-term bullish structure. A decisive breakout above the immediate resistance zone of 988-1,001 could strengthen the sby SatpalS417
Gland Pharma: Multi-Year Consolidation BreakoutGland Pharma: Multi-Year Consolidation Breakout with Strong Momentum Gland Pharma has emerged from a prolonged consolidation phase following its major downtrend. After spending several years moving within a broad ₹1,300–₹2,200 range, the stock eventually broke above the important resistance zone of ₹2,607 with strong volume participation. Since the breakout, the stock has rallied approximately 21.7% and is currently trading around ₹3,171.7. Another positive observation is the improving Relatiby Chart_Momentum411
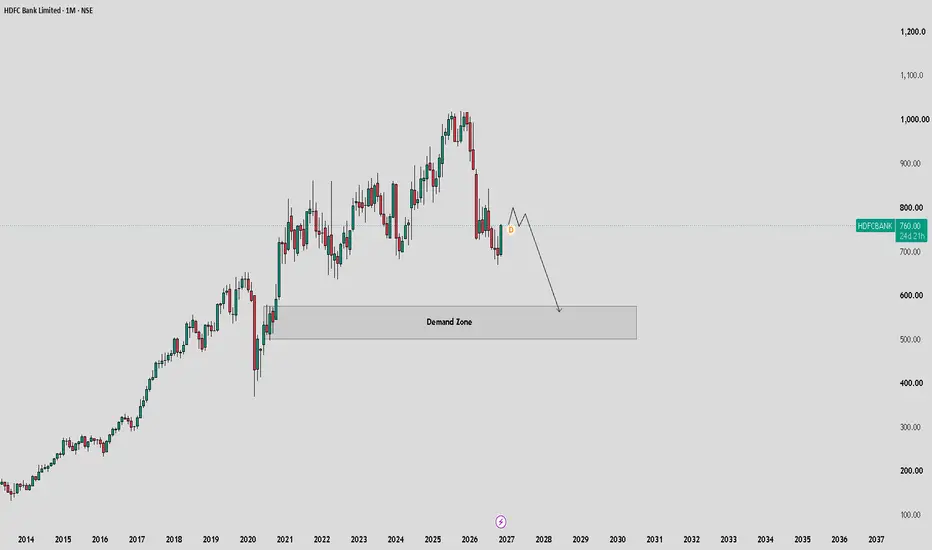
HDFC Bank - Fake Demand Area ! Major Potential Supply SideHDFC Bank is showing early for the demand side. But this demand also fake after 4-5 weeks continue demand. After 4-5 weeks ago then reversal for supply side. This reversal also create a bearish engulfing then move to down side Major support area 500-550 For learning and educational purposes only, not recommendation. Please consult your financial advisor before investing.by iamavijit13103
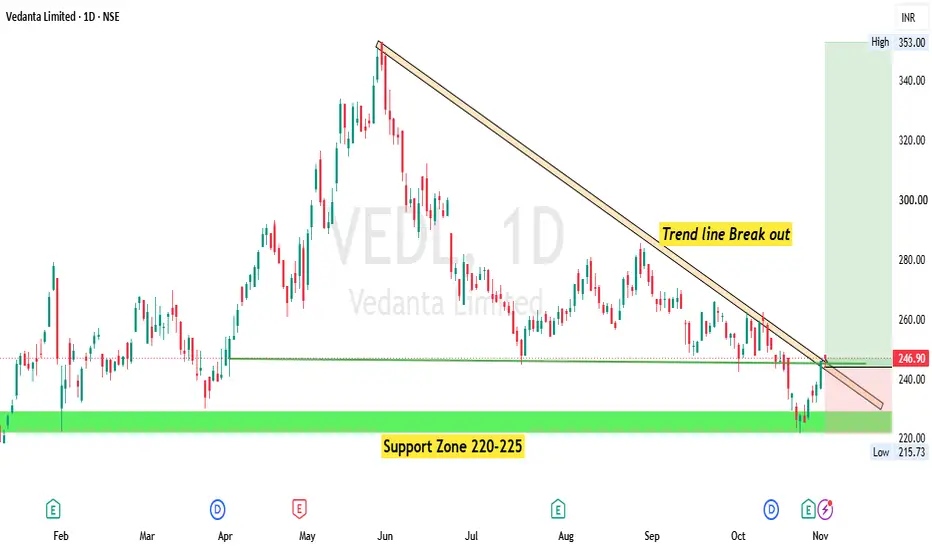
VEDANTA – Major Downtrend Line Breakout Attempt|Support ZoneVEDANTA (NSE: VEDL) Vedanta is approaching a crucial technical breakout zone after a prolonged downtrend. 🔹 Major Support:₹220–225 🔹 Immediate Support: ₹240–243 🔹 Breakout Zone: ₹247–250 🔹 Upside Resistance: ₹260–265, ₹280, ₹300 A sustained breakout above the descending trendline with strong volume may indicate a potential trend reversal. Key Observation: Watch for a decisive daily candle close above ₹250 for confirmation. Disclaimer: For educational purposes only. Not a buy/sell recLongby NismCertifiedResearchAnalyst333
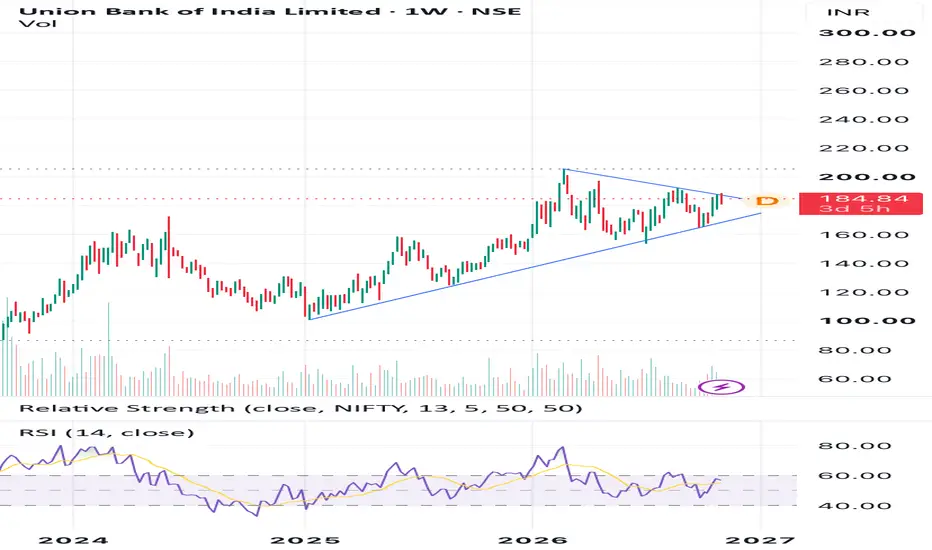
Union Bank of India – Weekly Chart Analysis1. Pattern – Symmetrical Triangle The stock is consolidating within a triangle after a strong upward rally. It is forming lower highs and higher lows, indicating a narrowing price range. 2. Upper Trendline – Resistance * Immediate resistance: ₹188–192 * Major resistance: ₹200–205 * A strong weekly close above ₹192 with volume can signal a bullish breakout. 3. Lower Trendline – Support * Important support zone: ₹168–173 * This is the rising support line connecting previous higher lows. * A buLongby HRpicks3
ASHOK LEYLAND - BULLISH RECOVERY OR BREAKOUT AHEAD?📊 **ASHOK LEYLAND (NSE: ASHOKLEY) – FIBONACCI ANALYSIS | BULLISH RECOVERY OR BREAKOUT AHEAD?** Ashok Leyland is showing signs of a short-term recovery after bouncing from its recent low of ₹140.02. The stock is currently trading around **₹154**, approaching a crucial resistance zone at ₹156.07. Fibonacci retracement levels highlight some interesting potential entry opportunities. 📌 **KEY FIBONACCI LEVELS** 🔴 0% – ₹156.07: Major resistance 🟠 23.6% – ₹152.28: Immediate support 🟡 38.2% –by shanmurali3
Is DLF Finally Ready to Construct a Rally?Pattern Structure: The chart illustrates a broadening formation where price has decisively broken out through the counter-trendline. Volume Analysis: A noticeable surge in buying volume for the past few months points to strong institutional and HNI interest, confirming the breakout's validity. Capital Deployment Strategy: Operating on a monthly timeframe requires disciplined capital deployment; scale in gradually using smaller portions across daily, weekly, and monthly closing bases to manage Longby Knox14112
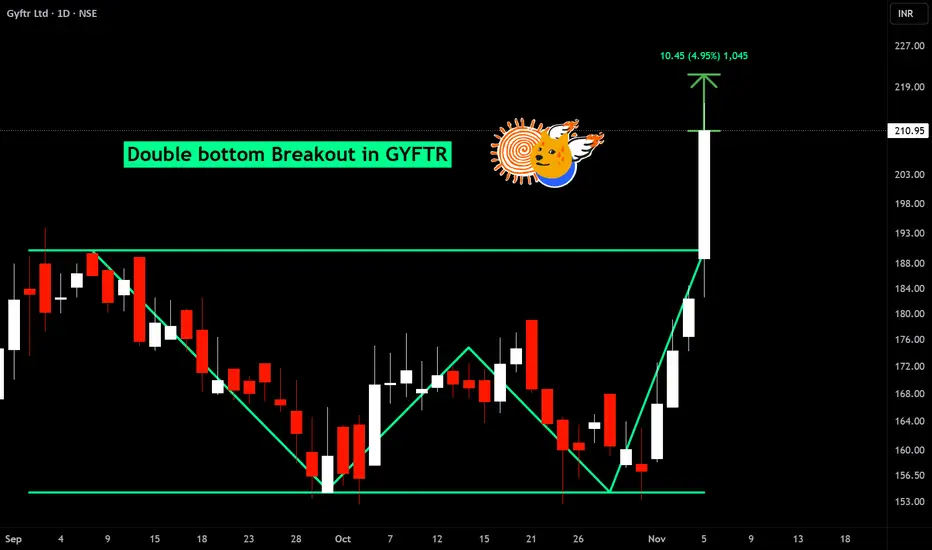
BUY TODAY SELL TOMORROW for 5%DON’T HAVE TIME TO MANAGE YOUR TRADES? - Take BTST trades at 3:25 pm every day - Try to exit by taking 4-7% profit of each trade - SL can also be maintained as closing below the low of the breakout candle Now, why do I prefer BTST over swing trades? The primary reason is that I have observed that 90% of the stocks give most of the movement in just 1-2 days and the rest of the time they either consolidate or fall Double bottom breakout in GYFTR BUY TODAY SELL TOMORROW for 5%by Kapil-Mittal22
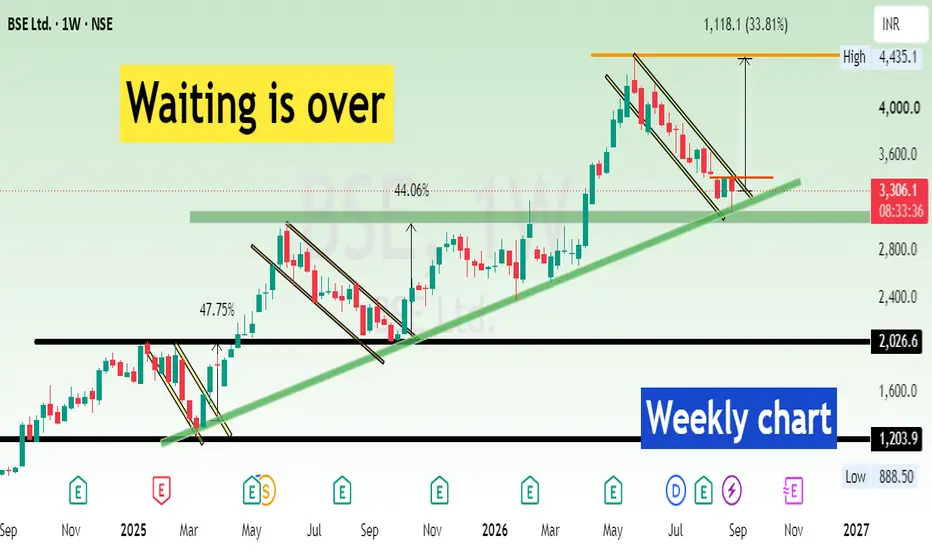
BSE Ltd – Waiting Is Over? | Weekly Breakout SetupBSE Ltd is currently approaching a crucial long-term support and trendline zone on the weekly chart. Interestingly, the chart shows a repeating price pattern during previous phases: Correction → Falling Channel → Trendline Support → Breakout → Strong Upside Move In the earlier setup, price found support near the long-term rising trendline and then broke out of the falling channel, followed by an approximately 47.75% upside move . The next similar setup also showed a correction towardsLongby NismCertifiedResearchAnalystUpdated 523
KFin Technologies: Understanding a Descending Triangle & FiboApoorv Dubey | SEBI Registered Research Analyst Let’s look at this chart as a simple story about price. 1. First came the rally 📈 KFin Technologies rose strongly from its marked swing low to its swing high. A swing low is an important low point on the chart, while a swing high is an important high point. 2. Then came a pause and a pullback After reaching its high, price started falling and moving sideways. It did not fall in a straight line: it bounced several times, but the later highs were Longby Apoorv-Dubey_SEBI-RA3
Parag Milk Foods (D): GAP-UP BREAKOUT & TREND CONFIRMATIONTimeframe: Daily | Chart Scale: Linear Explosive +10.88% surge today backed by a massive 21.72M volume spike! 🔥 Technical Highlights: ✅ Breakout: Gapped up, cleared & closed above long-term angular resistance (active since Nov '25). ✅ Trend: Forming Higher Lows since Mar '26—bullish structure confirmed! ⚠️ Caution: Given the huge 11% move, watch out for near-term profit booking. ✅ Momentum: Perfect EMA alignment (Daily/Weekly/Monthly). MACD & RSI rising. 🚀 Key Levels to WaLongby Learn_with_Pth0mas1
PDS Ltd (D): MASSIVE SURGE & RESISTANCE TESTTimeframe: Daily | Chart Scale: Linear Explosive +11.85% surge today backed by a sudden 13.83M volume spike! 🔥 Technical Highlights: ✅ Trend: Forming Higher Lows since Mar '26—bullish structure intact! ⚠️ Major Test: Breached a long-term horizontal resistance (Jun '25) intraday but couldn't secure the close. ✅ Volume: Sudden massive surge snaps a dry volume spell. ✅ Momentum: EMAs in positive crossover (Daily/Weekly). MACD & RSI rising. 🚀 Key Levels to Watch: 🎯 Target: 4by Learn_with_Pth0mas1
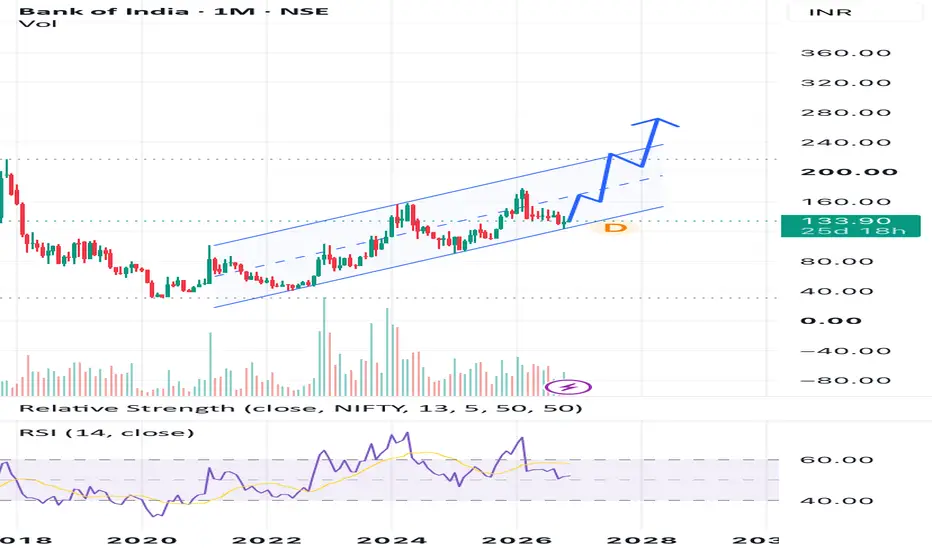
Bank of India (BANKINDIA) – Long-Term Buying Strategy | Monthly 1. Bullish Channel Formation: The stock has been moving within a well-defined upward-sloping parallel channel since 2020, indicating a gradual long-term trend reversal and accumulation. 2. Strong Higher-Low Structure: The price continues to form higher highs and higher lows, suggesting sustained buying interest and improving long-term price momentum. 3. Channel Support Opportunity: Current price around ₹134 is within the rising channel. Accumulation near ₹125–135 could offer an attractive risk-rLongby HRpicks2
AEGISVOPAK - Efforts Vs Result to be watchNSE:AEGISVOPAK Efforts Vs Result Trade Plan Near History of Price Action: Aegis Vopak Terminals Ltd. , had expressed sharp up move with nice expanded volume historically leaving a identifiable demand area responsible for that up momentum. Meanwhile with time, the price exhausted up momentum as reached to previously known supply area and finally corrected downside with negative RSI divergence with high volume activity expressing the strength of supply area. Current Price Action: Longby KingDoxa_trades3
Fractal Analytics cmp 835.65 Daily Chart since listedFractal Analytics cmp 835.65 Daily Chart since listed - Resistance Zone 845 to 950 price band - Support Zone ATL 696.30 to 800 price band - Bullish "W" Double Bottom by Resistance neckline - Heavy Volumes spike seen twice, over past few days - Volumes supported Breakout from Resistance Price Channel - Breakout of Resistance Zone necessary for Fresh Price Uptrendby PIYUSHCHAVDA1
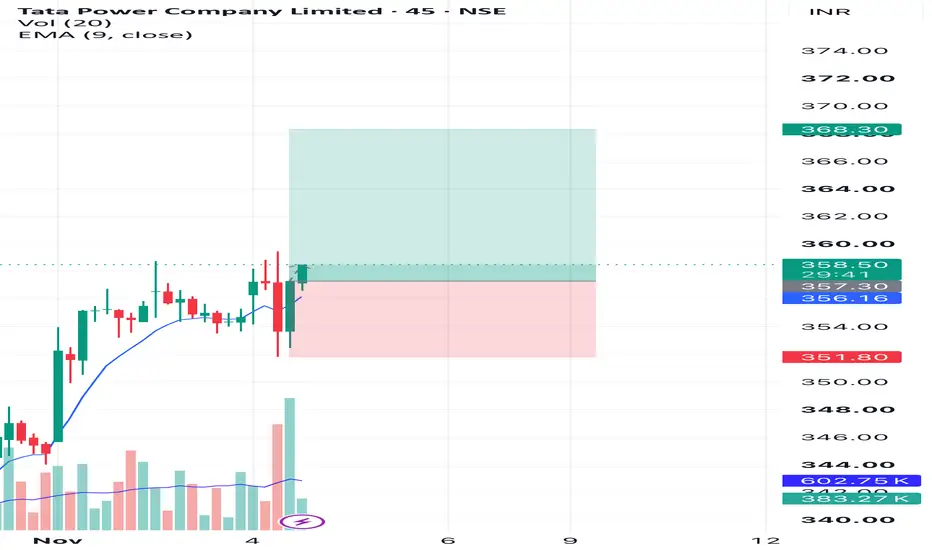
About to breakoutIf you see the 45-minute chart, it is making a bullish engulfing candle where the second green candle has more volume than the previous red candle. It is not breaking the structure upwards, but there is good resistance at that level, which means it can be broken anytime. Overall, it is an uptrend, so the chances of a breakout are higher than a breakdown. by drmukur2
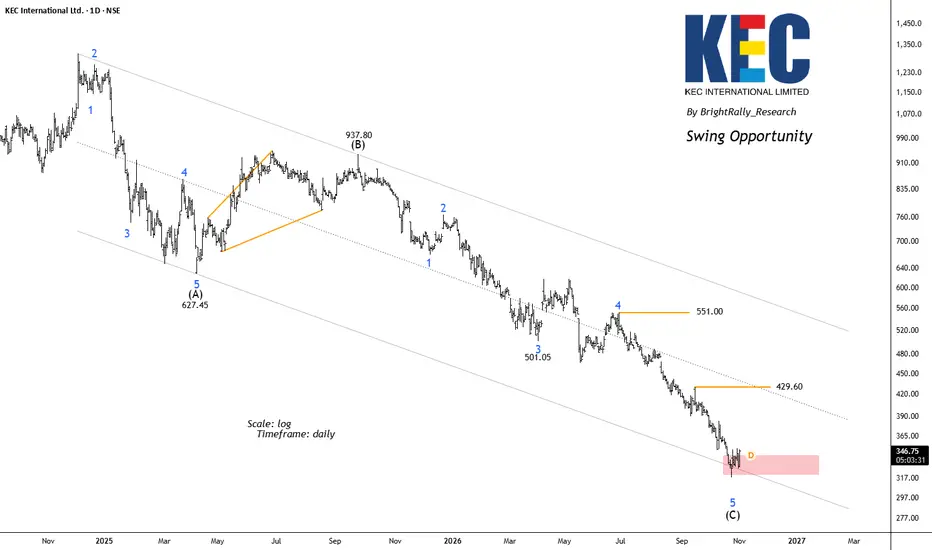
KEC: Is a Swing Reversal Taking Shape Near the Bottom?KEC International has been trading inside a broad descending channel, reflecting a prolonged corrective phase. The Elliott Wave structure suggests that the stock may be approaching the final stages of a larger Wave (C) decline. The chart shows Wave (A) ending near ₹627.45 , followed by a recovery into Wave (B) near ₹937.80 . Since then, the stock has continued its downward journey in a developing Wave (C) structure. The recent decline appears to be completing Wave 5, with the price now enterLongby BrightRally_ResearchUpdated 5
R Systems: Monthly Converging Trendlines & a High-Volume AreaApoorv Dubey | SEBI Registered Research Analyst A simple price action observation using the monthly timeframe: On R Systems’ chart, two converging trendlines help frame the broader structure: -The upper red line connects major highs and marks a descending resistance reference. -The lower red line tracks the rising support area. -Price has recently reacted near the lower boundary and remains within the broader structure shown. -The volume bars show substantial activity in recent months around thLongby Apoorv-Dubey_SEBI-RA5
NSE SBI Bank: Is a New Bullish Impulse Beginning?🏦 Is SBI preparing for a fresh bullish impulse, or is the recent recovery just another corrective move? Looking at the daily chart of NSE:SBIN , the decline from the February high near 1234.70 appears to have developed into a corrective A-B-C structure. The recent decline seems to have completed a five-wave sequence within wave (c), with a potential termination near 937.50. From this low, two possibilities are worth monitoring: 🟢 Scenario 1 – Beginning of a New Bullish Cycle The low near 9Longby VCSompura10
MOLD-TEK PACKAGING – Approaching a Major Trendline Breakout!📈 MOLD-TEK PACKAGING – Approaching a Major Trendline Breakout! Is a Bigger Recovery Ahead? ━━━━━━━━━━━━━━━━━━━━ 🏢 COMPANY OVERVIEW & BUSINESS THEME ━━━━━━━━━━━━━━━━━━━━ Mold-Tek Packaging Ltd. is an Indian manufacturer of rigid plastic packaging solutions, catering to several industries, including Paints, Lubricants, Food, FMCG and Pharmaceuticals. The company specialises in injection-moulded packaging and In-Mould Labelling (IML) technology, which integrates product labels directly into plasLongby alamcet1
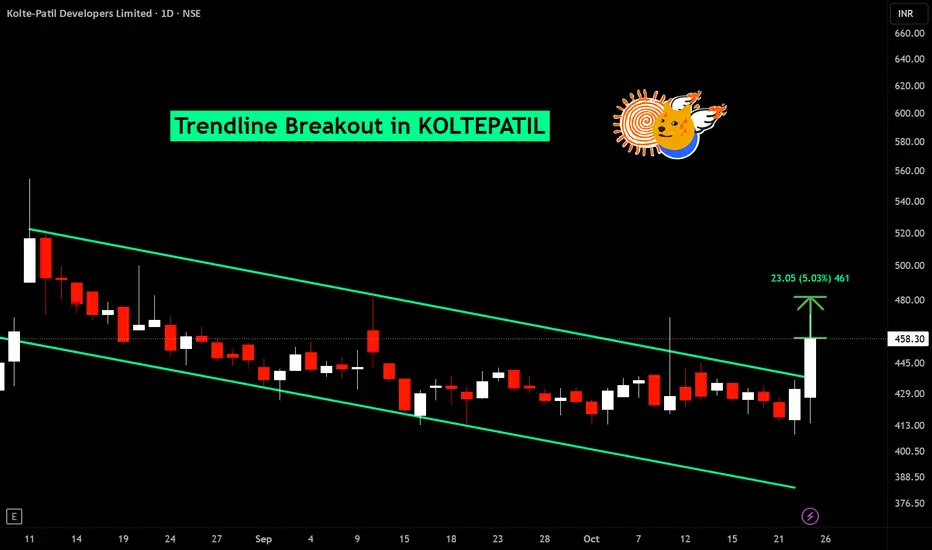
BUY TODAY SELL TOMORROW for 5%DON’T HAVE TIME TO MANAGE YOUR TRADES? - Take BTST trades at 3:25 pm every day - Try to exit by taking 4-7% profit of each trade - SL can also be maintained as closing below the low of the breakout candle Now, why do I prefer BTST over swing trades? The primary reason is that I have observed that 90% of the stocks give most of the movement in just 1-2 days and the rest of the time they either consolidate or fall Trendline breakout in KOLTEPATIL BUY TODAY SELL TOMORROW for 5%by Kapil-MittalUpdated 22
Ambuja Cements Ltd - Potential Long-Term Reversal Setup XABCD# 📊 Ambuja Cements Ltd. (NSE: AMBUJACEM) — Potential Long-Term Reversal Setup Reversal watch Weekly timeframe Ambuja Cements is trading near ₹372.65, showing a strong weekly candle of approximately +7.07% on the chart dated November 4, 2026. The weekly chart highlights a potential XABCD harmonic reversal structure, with price approaching the projected D-zone around ₹347–₹373. This is an important area to watch for a possible base formation and recovery. ## Key technical levels | Level Longby KMKB1

 Long


 Long
 Long

 Long

 Long
 Long
 Long

 Long
 Long


 Long
 LongLong
 Long

 Long